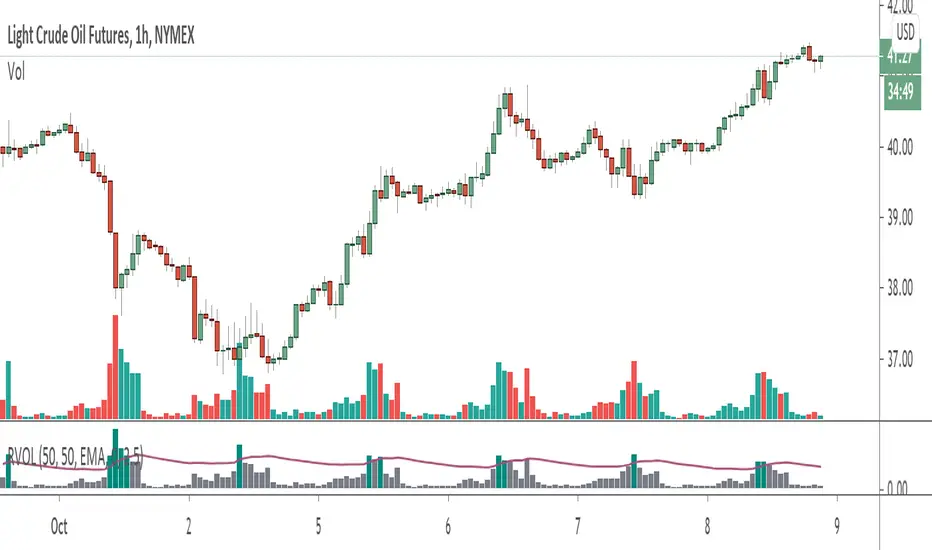
Volume+ (RVOL/Alerts)This indicator colors the volume bars based on any of the three follow criteria:
- Volume Amount
- RVOL (Relative Volume)
- Lookback (Highest Over Period)
You can use one, two or all three of these settings at the same time.
You can also set alerts with this indicator. The script will trigger an alert whenever any of the three specified flags are triggered.
RVOL is calculated as: Volume divided by Moving Average value. You can change the moving average period (and type) in the settings.
在脚本中搜索"alert"
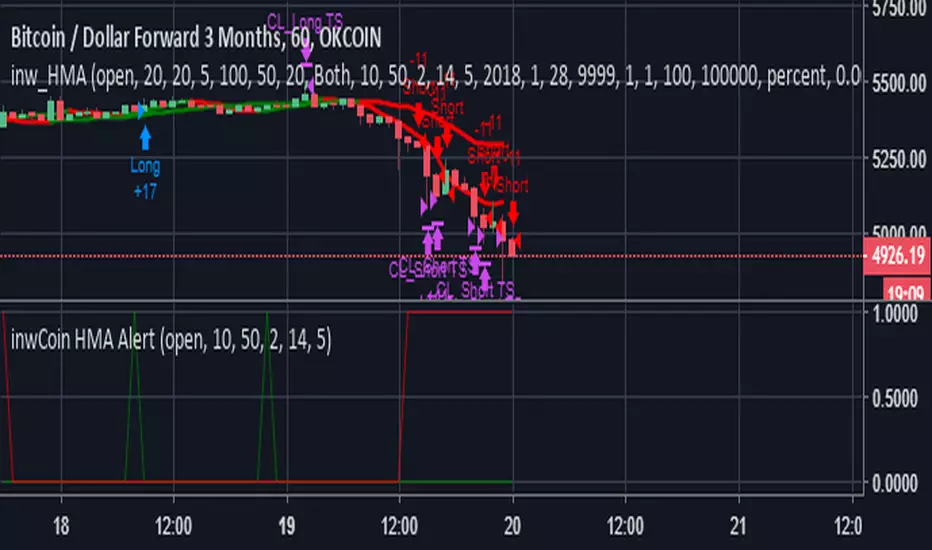
inwCoin HMA AlertinwCoin HMA alert for inwCoin HMA Strategy.
If you want to use this alert signal, please donate me 0.005 BTC for my electric bill/coffee/food to this address ( the man got to eat )
BTC : 3BRLGDEtNYpSPVD7YtKNZzVREsi1smcvvi
And send inform me about your donation, and I'll add you to access my alert script :)
If you need me to customize the script/alert/strategy to match your exchange, please let me know, and I'll do it for 0.01 BTC :)
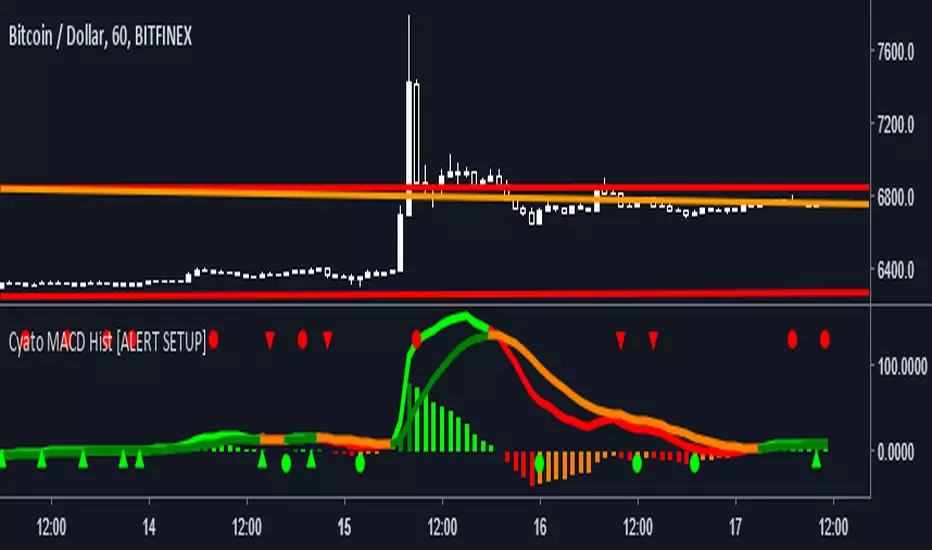
Cyatophilum MACD Hist [ALERT SETUP]Hello, I made a classic MACD Histogram indicator, with custom alerts and parameters though.
Shapes
Green circles : The MACD histogram is reversing, this is a buy (or Long) signal.
Red circles : The MACD histogram is reversing, this is a sell (or Short) signal.
Green Arrow up : The MACD histogram is enduring a bear fakeout. This is a buy signal.
Red Arrow up : The MACD histogram is enduring a bullfakeout. This is a sell signal.
Parameters ( INPUTS )
Classic MACD parameters.
Sensitivity : (1 = really sensitive to reverals and fakeouts - 5 = much less sensitive)
Activate Fakeouts : default is true. Uncheck to deactivate fakeout on chart /!\ will also deactivate fakeout alerts
Alerts (Automated trading alerts : SMS, email, etc.) that you can create :
Buy : a buy signal that will trigger on a bull reversal or a bear fakeout. No more than one buy/sell signal in a row (You will not get multiple buy signals or multiple sell signals in a row)
Sell : a sell signal that will trigger on a bearreversal or a bullfakeout. No more than one buy/sell signal in a row (You will not get multiple buy signals or multiple sell signals in a row)
Buy (Bull Reversal) : a buy signal that will trigger on each bull reversal.
Buy (Bear Fakeout) : a buy signal that will trigger on each bear fakeout.
Sell (Bear Reversal) : a sell signal that will trigger on each bear reversal.
Sell (Bull Fakeout) : a sell signal that will trigger on each bull fakeout.
If you like, leave a comment, thanks! If you find any bug, thanks for telling me!
-----------------------------------------------------------------------------------------------------------------
I am selling access to private scripts and backtests that can be found on my website .
I am also open to commissions : TradingView's PineScript development, reverse engineering.
Thanks.
BitMEX Volatility AlertsAlert conditions and bar colors for each of the three volatility indices from BitMEX.
Price: 0.002 BTC / 35 Ripples / 1 NEO

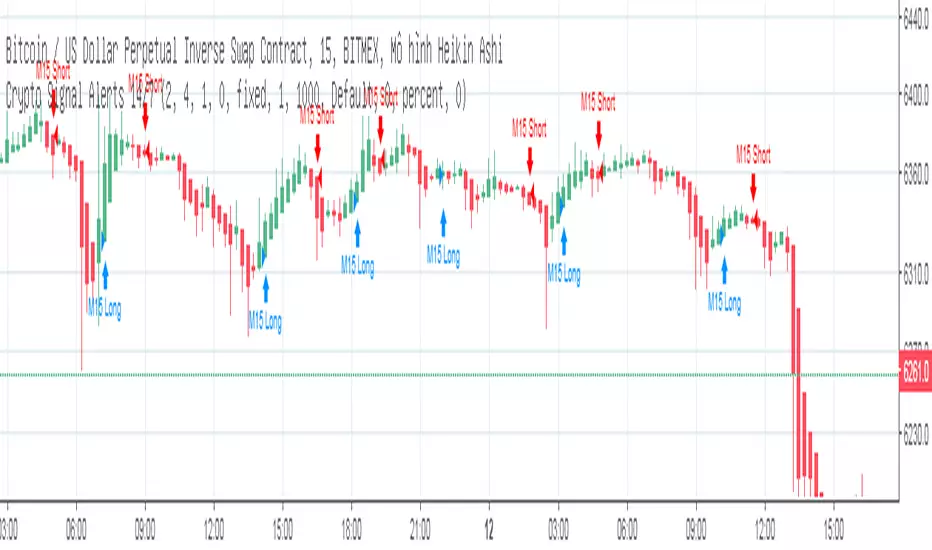
Crypto Signal Alerts ( Margin/Exchange )Crypto Signal Alert is an intuitive and easy-to-use graphing buying tool that helps traders save time and maximize profits ^$$$^
- Features:
+ Optimized trading methods for multiple time frames 5M 15M 1H 4H (including Margin and Exchange Trading).
+ Build the rule of Stoploss / Takeprofit according to the risk management method according to the trader's strategy.
+ Real-time push alert system + Email + Popup on your desktop, laptop, tablet and smartphone => have time to enjoy trading live.
+ Our system runs 24/7.
*** Sign up for a 3-day trial here : goo.gl
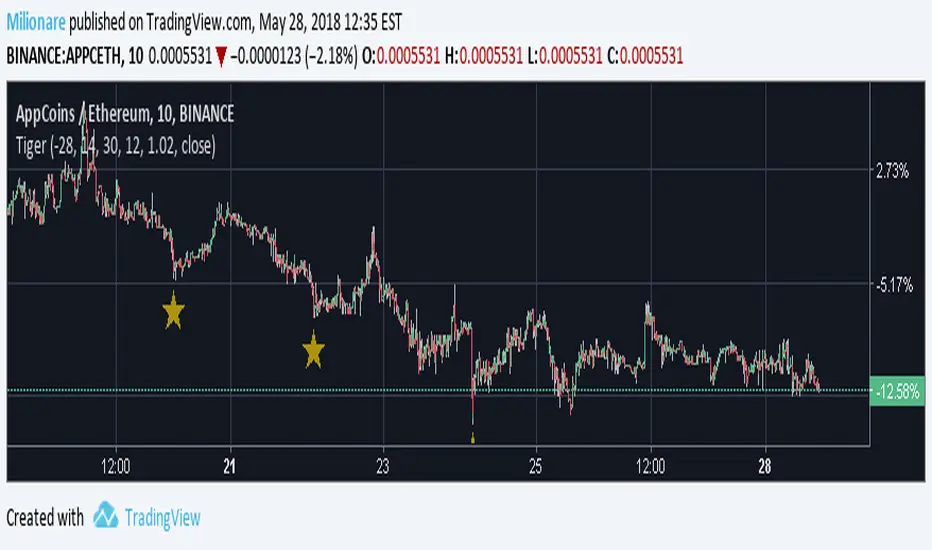
TIGER Pro - buy alert script - finders bottomScript with many trending oscillators and trend filter. It can be set to all tradable coins. Perfectly works for 5-30 min.Script has a Alert for purchase built in. Autoview is used for purchase and the sale is controlled via PT. It is important to use stop loss and sales strategy .Using these signals is at your own risk.
An invitation is up to 200 people. This is a test version.
example alert for Binance : e=binance s=APPCETH b=buy u=currency q=0.017 t=limit p=0.1%
e=binance s=APPCETH b=buy delay=150 c=order
Option alert:Buy
:Once Per Bar Close
For more info PM
Big Snapper Alerts R2.0 by JustUncleLThis is a diversified Binary Option or Scalping Alert indicator originally designed for lower Time Frame Trend or Swing trading. Although you will find it a useful tool for higher time frames as well.
The Alerts are generated by the changing direction of the ColouredMA (HullMA by default), you then have the choice of selecting the Directional filtering on these signals or a Bollinger swing reversal filter.
The filters include:
Type 1 - The three MAs (EMAs 21,55,89 by default) in various combinations or by themselves. When only one directional MA selected then direction filter is given by ColouredMA above(up)/below(down) selected MA. If more than one MA selected the direction is given by MAs being in correct order for trend direction.
Type 2 - The SuperTrend direction is used to filter ColouredMA signals.
Type 3 - Bollinger Band Outside In is used to filter ColouredMA for swing reversals.
Type 4 - No directional filtering, all signals from the ColouredMA are shown.
Notes:
Each Type can be combined with another type to form more complex filtration.
Alerts can also be disabled completely if you just want one indicator with one colouredMA and/or 3xMAs and/or Bollinger Bands and/or SuperTrend painted on the chart.
Warning:
Be aware that combining Bollinger OutsideIn swing filter and a directional filter can be counter productive as they are opposites. So careful consideration is needed when combining Bollinger OutsideIn with any of the directional filters.
Hints:
For Binary Options try ColouredMA = HullMA(13) or HullMA(8) with Type 2 or 3 Filter.
When using Trend filters SuperTrend and/or 3xMA Trend, you will find if price reverses and breaks back through the Big Fat Signal line, then this can be a good reversal trade.
Some explanation about the what Hull Moving average and ideas of how the generated in Big Snapper can be used:
tradingsim.com
forextradingstrategies4u.com
Inspiration from @vdubus
Big Snapper's Bollinger OutsideIn Swing filter in Action:

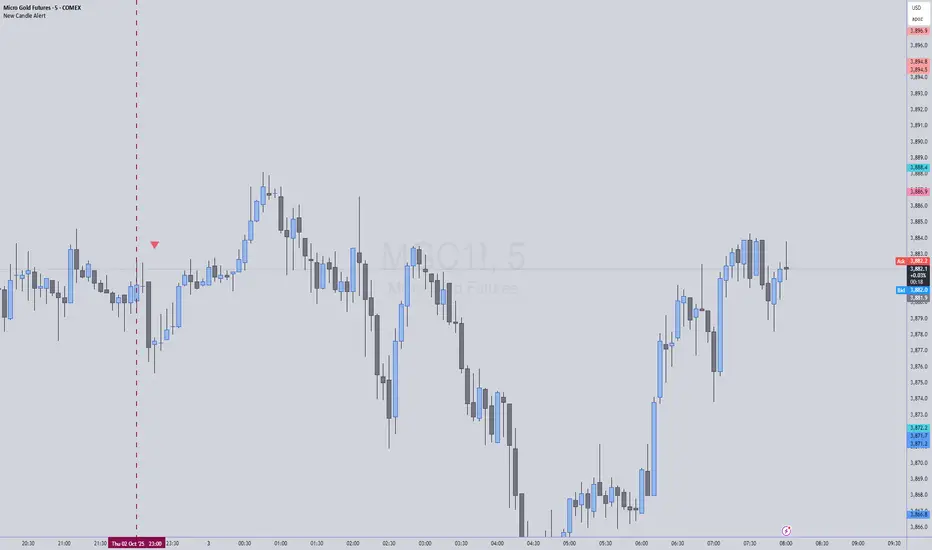
New Candle Alert with Time WindowJust needed a way to specify a time window on a timeframe and get alerts for each new candle
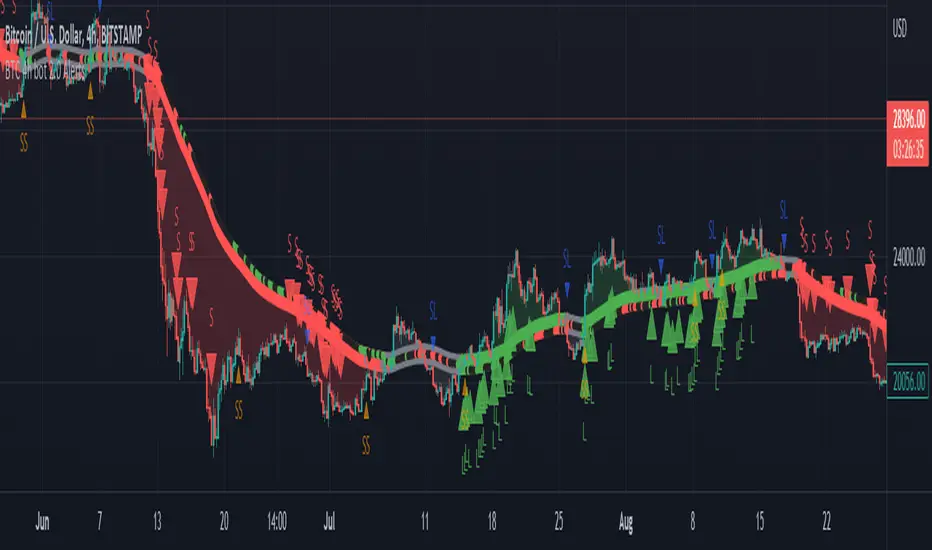
BTC 4h bot 2.0 AlertsThis is Alert version of BTC 4h bot 2.0.
Optimized for pairs BTC vs stablecoins, 4h timeframe.
HOW IT WORKS:
Script is based on the fact that there are certain phases of the market when there is a greater probability that BTC will go to one side or the other. To evaluate which phase we are in, the script uses "Main trend" and "Confirmation signals".
Main trend
- Is composed of a combination of several supertrends and moving averages. A Supertrend is a trend following indicator that helps in identifying whether we are in an uptrend or a downtrend. A higher factor is used to capture the main trend and not just small movements. In case the market goes sideways, the Supertrend does not work well, so it is a combination of multiple supertrends along with moving averages to differentiate a real strong trend from a range.
- It can be seen on the graph as a thick solid line.
- In an uptrend is green, in a downtrend red, gray represents the neutral zone.
Confirmation signals
- Are several script-evaluated indicators such as RSI , MACD , ADX and others, which serve to confirm the trend. In this case, it is the opposite way to the Main trend. Confirmation signals are used here to detect small movements. They are trying to capture bullish and bearish price momentum.
- On the graph they are seen as dashed lines above or below the Main trend (in the gray zone they are in the middle).
- It indicates only two signals, green for buy and red for sell.
HOW TO USE IT:
if the Main trend and Confirmation signals are of the same color, it will send a buy or sell signal, depending on which phase of the trend it is in. If the Main trend is e.g. in an uptrend and the market is going up, Confirmation signals should generate a lot of signals. But if the market starts to go in the opposite direction, Confirmation signals should generate fewer signals or none at all, thus reducing the number of wrong trades. In the gray zone of the Main trend it does not open positions.
To close position is possible to use stop loss and take profit or alternative could be to set very high TP value, thereby letting the script close the positions by itself by Stop Long or Stop Short.
The recommended setting is:
TP: 3.9%
SL: 4.7%.
In this case, it is a Alert version, where can be seen all the signals, which the script generates.
Green triangels indicate open Long.
Red triangels indicate open Short.
Small blue triangels indicate Stop Long position.
Small orange triangels indicate Stop Short position.
Signal is valid after bar is closed, so do not open a position before.
Script works well on Bitstamp, but also other exchanges with pair BTC/USD or BTC/stablecoins.
The script works consistently well over a long period of time, using past probabilities, but this does not guarantee future results.
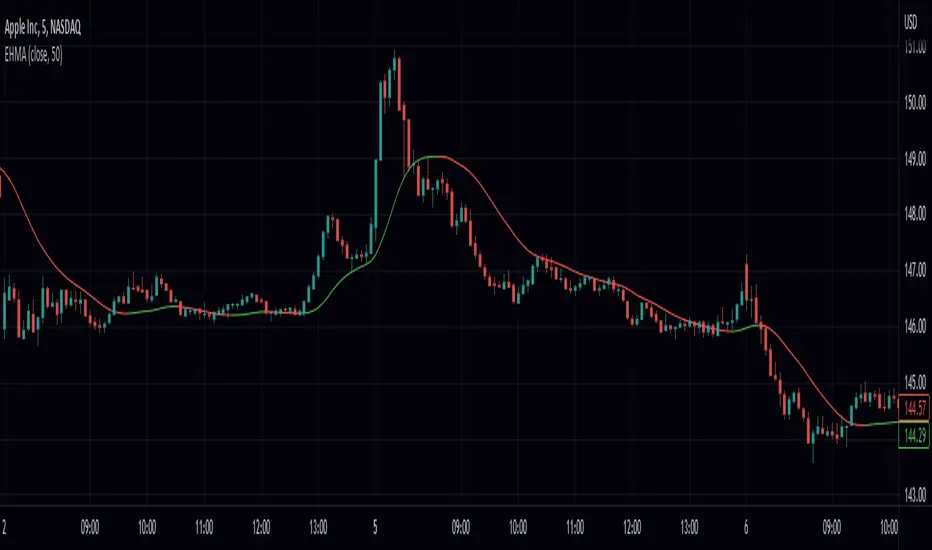
Exponential Hull Moving Average With Alerts (EHMA)Hello! This is simply HMA calculated with EMA's instead of WMA! I have added alerts for the direction of the average.
Heres a recap the traditional HMA:
The Hull Moving Average ( HMA ) attempts to minimize the lag of a traditional moving average while retaining the smoothness of the moving average line. Developed by Alan Hull in 2005, this indicator makes use of weighted moving averages to prioritize more recent values and greatly reduce lag.
MACD Multiple AlertsThis script help traders to catch bullish and bearish momentum. It creates an alert for 40 altcoins based on the MACD cross over and cross under.
The MACD input are adjustable in the settings and you can choose your favorite assets.
Simply add this indicator to the chart wait that if finish to load and then create an alert on the time frame of your choice.
Enjoy your trading
F_rank_01

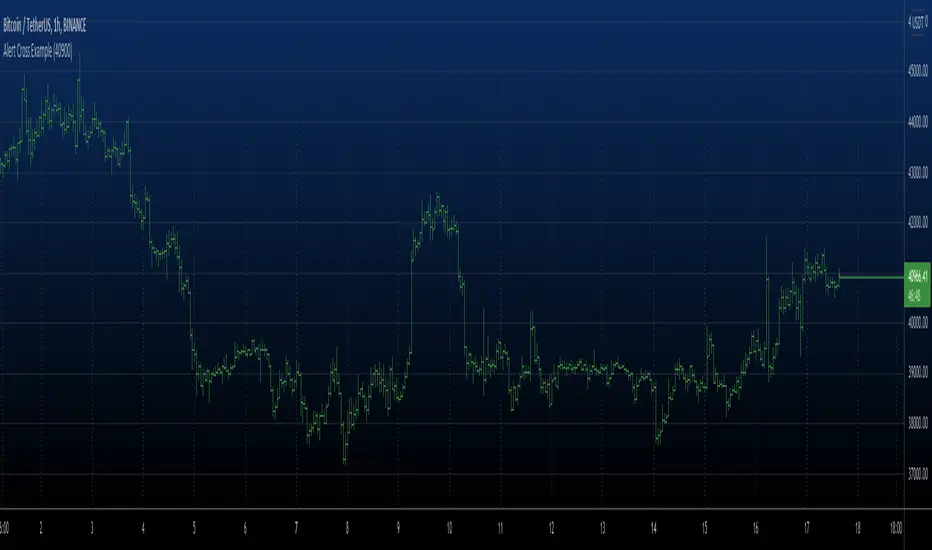
Alert Cross Example Alert example with set level.
Set level price in the input dialog and it will send
cross alerts
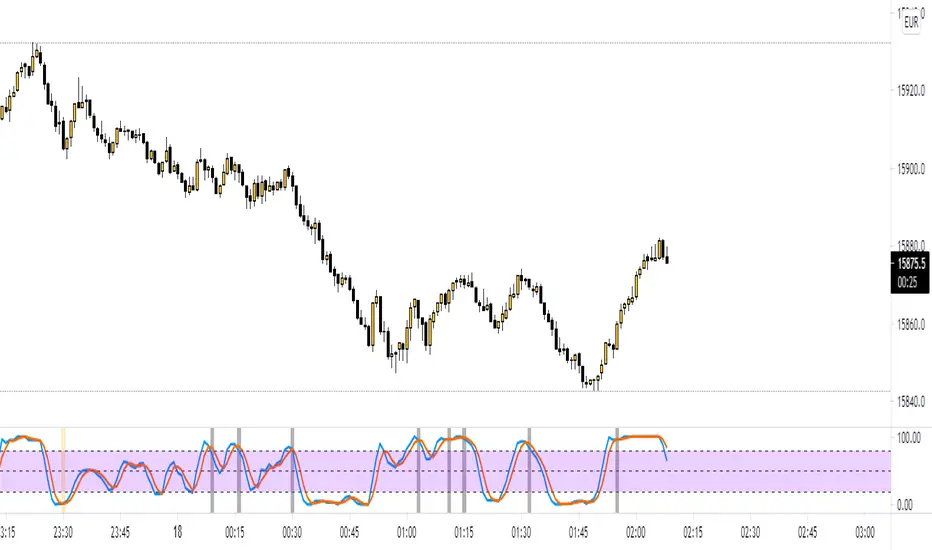
Stochastic RSI w/ Crossover Alerts (by WJ)NOTE:
// STOCH RSI CODE TAKEN FROM DEFAULT INDICATOR
// I HAVE ONLY MADE SOME ADJUSTMENTS FOR VISUAL AID
// I MADE THIS FOR MY OWN USE BUT HAVE DECIDED TO PUBLISH AND SHARE IN CASE ANYBODY WANTS TO USE IT
This is the normal default built-in Stochastic RSI indicator which I have added some stuff for visual aid:
Added middle line (50)
Stoch RSI background turns green when K line crosses D line UPWARDS, K line is below the 50 level, and price is above 200 EMA
Stoch RSI background turns red when K line crosses D line DOWNWARDS, K line is above the 50 level, and price is below 200 EMA
Alert notification on the crossover candle with background colour change conditions met
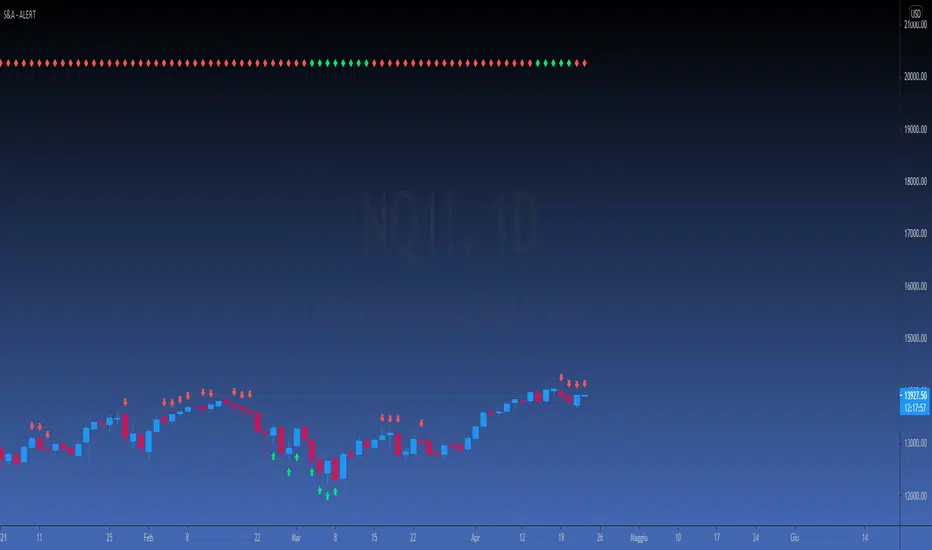
[FP] STOCH & ADX EASY ALERTENG DESCRIPTION
This script is a simple request from user, that want to have an allert when ADX and Stochastic has certain contidion.
Also this indicator show when ADX is > or < than 40 when with red and green diamonds on top.
It's used to validate a weakly setup to trade FUTURES.
DESCRIZIONE IN ITALIANO
Questo script è una semplice richiesta da parte di un utente, il quale richiedeva un alert quando lo Stocastico e l'ADX raggiungono determinate condizioni.
Inoltre l'indicatore mostra quando l'ADX è maggiore o minore di 40 plottando dei diamanti in alto sul grafico.
MTF CCI with timeframe control function and signal/alertJapanese below. / 日本語説明は下記
Summary
This indicator shows CCI of the current timeframe and another CCI from upper timeframe as MTF CCI with ability to show signals and set alerts when crossing upper/bottom bands.
For general use of CCI, please refer to the link below(by TradingView)
jp.tradingview.com
How is it different from other MTF CCI indicators?
Problems with other MTF CCI indicators are;
-If you set higher timeframe CCI(MTF CCI), it will also be shown on further higher time frames.
i.e. If you set 4hour chart’s CCI on 1 hour or lower time frame charts, it will also appear on daily and weekly chart, which is not necessary.
To tackle these problems, this indicator has incorporated functions below.
-To be able to control timeframes where MTF CCI is displayed to eliminate unnecessary information when you open higher time frame’s charts.
For example, if you select daily timeframe for MTF CCI, the CCI will be shown only on 4 hour or lower timeframes.
These are the values added on this indicator.
Specifications
-This indicator shows one CCI from the current timeframe and another CCI from another timeframe(MTF).
-For MTF CCI, you can select upper timeframe from monthly, weekly, daily, 4hour, 1hour, 30mins, 15mins, 5mins.
Again, if you select weekly for MTF, for instance, then MTF CCI will be displayed on daily or lower timeframes. Other timeframes work same.
-For both CCI(current timeframe) and CCI(MTF), signals will be shown when they cross over/under upper band and lower band, which you can control display on style tab of the indicator.
-Alert can be set same as signal conditions.
Please see the sample chart below.
Brown triangle is signal for CCI(current timeframe) and maroon signal is for MTF CCI.
--------------------------------------------------------------------------------------------------
現在時間軸のCCIと上位足のCCIを表示するマルチタイムフレームCCI(MTF CCI)インジケーターです。アッパーバンド、ロワーバンドと交差した時にシグナルを表示するとともに、アラートの設定も可能です。
CCIの一般的な使い方は以下のリンク(TradingView)を参照ください。
jp.tradingview.com
他のマルチタイムフレームCCIとの違い
他のマルチタイムフレームCCIのインジケーターでは、以下の問題に直面します。
・上位足のCCIを表示すると、さらに上位足でもそのCCIが表示され見にくくなる。
例: 4時間足のCCIを下位足で表示可能な様に設定すると、日足や週足でも表示され、チャートがノイズだらけに・・・
この問題に対して、このインジケーターでは、
・上位足のCCIを表示する時間軸を制御することで上位足で不必要な情報を表示させない。
という機能を加えることでこれらの問題を解決しています。
機能概要
・このインジケーターでは現在の時間軸のCCIと上位足から一つのCCIを表示します。
・上位足は月足、週足、日足、4時間足、1時間足、30分足、15分足、5分足から選択することが可能です。
・上位足のCCIは選択した時間軸未満の時間軸に表示されます。
例:
日足のCCI : 4時間足、1時間足、30分足、15分足、5分足、1分足チャートにのみ表示
4時間足のCCI : 1時間足、30分足、15分足、5分足、1分足チャートにのみ表示
・上位足のCCIは選択した時間軸未満の時間軸に表示されます。
・現在時間軸のCCI、MTF CCIともに、アッパーバンド/ロワーバンドと交差したタイミングでシグナルを表示することができます。(アッパーバンド/ロワーバンドそれぞれに対して上に交差、下に交差のタイミングで表示されます。不要なものはスタイル設定画面で非表示とすることができます。)
・シグナルは設定画面で表示・非表示の切り替えができます。
・シグナルと同じ条件でアラート通知の設定が可能です。
サンプルチャート
1時間足に4時間足のCCIを表示したものです。茶色の三角が現在時間軸のCCIのシグナル。赤の三角がMTF CCIのシグナルです。

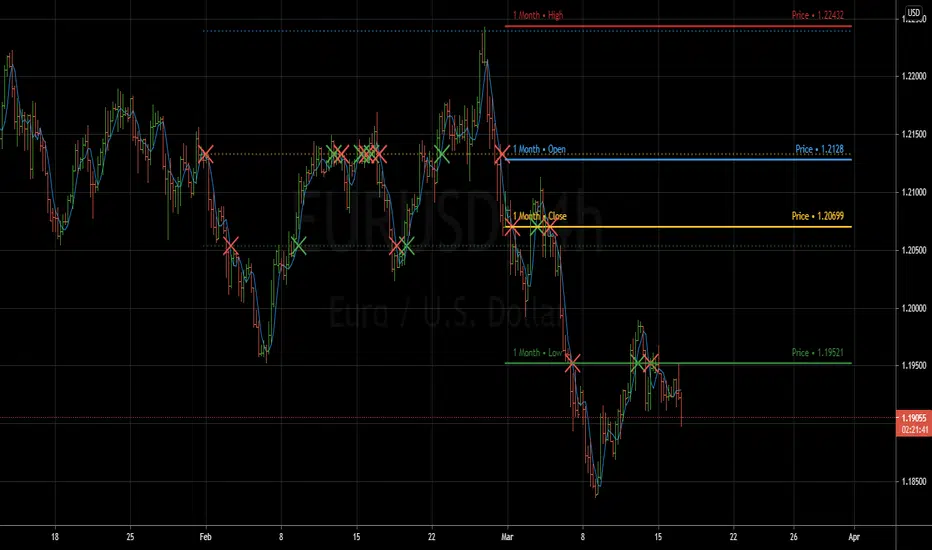
Previous Period Levels - X Alerts====== ABOUT THIS INDICATOR
- A simple but highly customisable display of previous higher time-frame
OHLC values, drawn using line.new and label.new. Nothing fancy but...
- Customised resolution input which excludes time frames lower than 1 hour
while extending the common higher reference inputs to include:
• 6, and 12 Hour
• 5 Day
• 3, and 6 Month
• 1 Year
- Alert conditions using an adjustable SMA to help reduce false positive
spam.
- Full visual customisation options for (almost) every aspect, so it can be
tuned to suit most individual preferences.
- In line with the miriad visual customisation options is the ability to
change the display format of the Labels, to show more or less information,
or disable them altogether.
====== REASON FOR STUDY
- To practice advanced user input option handling to allow for a full visual
customisation experience without stepping outside of, or interfering with,
the intended function of the indicator.
- Provide reasonably clear code commenting and structure in order to be
useful as a potential learning aid for others, and future reference for
myself.
====== DISCLAIMER
Any trade decisions you make are entirely your own responsibility.
I've made an effort to squash all the bugs, but you never know!
Simple Study for Sean (threshold-triggered alert)This script illustrates how to create simple alerts, triggered by a share price moving above (or below) an arbitrary threshold.

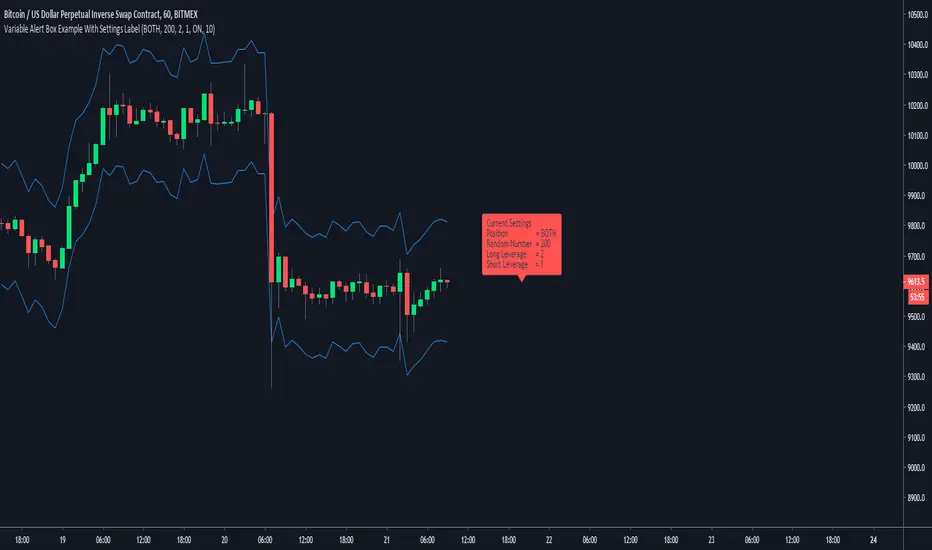
Variable Alert Box Examplejust publishing to share to novice pine coders like myself
any feedback on layout/structure/shortcuts will always be appreciated, not that this is a long script with much that can go wrong
short little what ever to show variable alert message
needs to draw the number from a plotted number like line 18 and 19, and cant be gettin the numbers from line 14 and 16
MACDTraderPro for BTC with LONG & SHORT AlertsMostly based on MACD analysis this trend indicator accurately shows you when main trend changes.
It has LONG and SHORT labels and you can use it with tradingview alerts to be in touch and for automated trading bots.
You can use it both with margin(bitmex, bitfinex, etc) and main exchanges (binance and more) with bitcoin for now and soon for alts also.


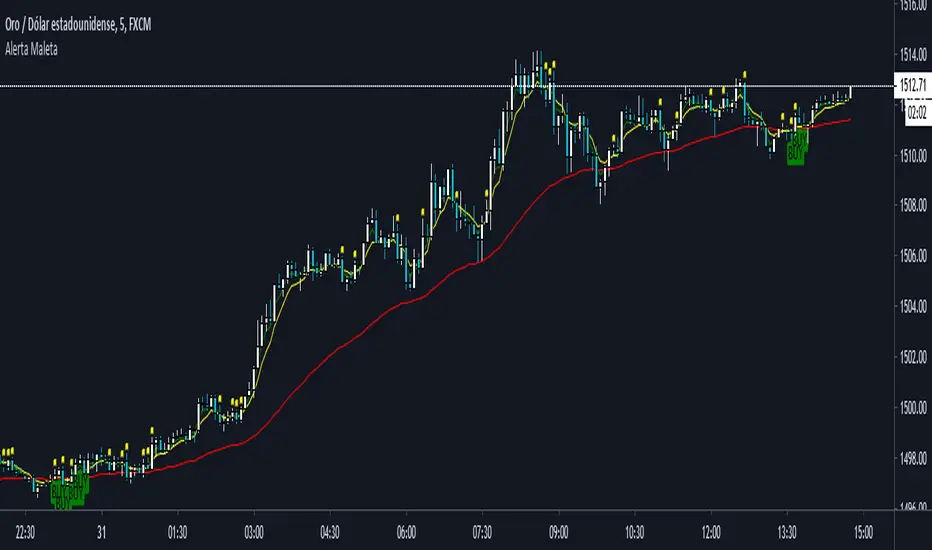
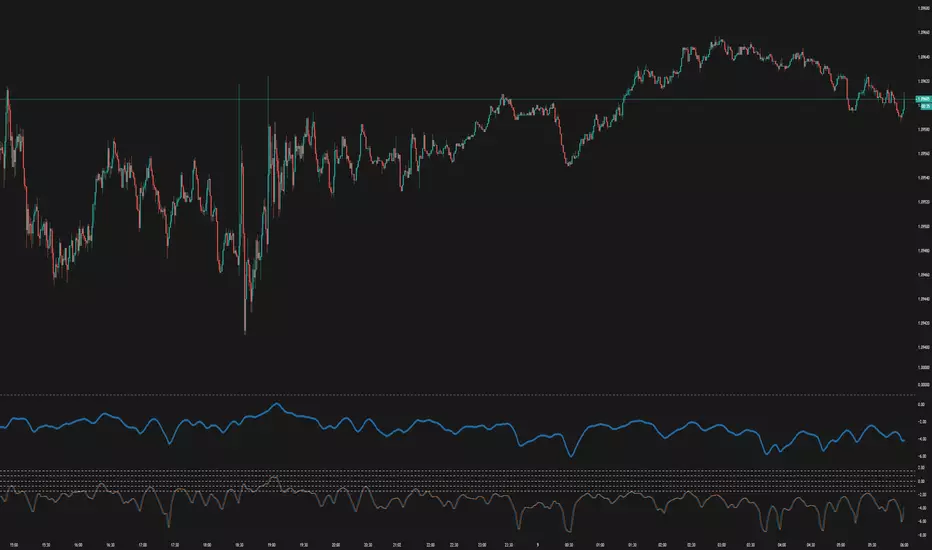
EURUSD Binary Strategy Indicator ALERTS!Good afternoon traders!
The EURUSD Binary Strategy Indicator ALERT, is a continuation of the " EURUSD Binary Strategy 73% Win Ratio " strategy made by my self. This indicator allows you to add alerts in order for you not to miss a trade! Furthermore, for the purchase of the " EURUSD Binary Strategy 73% Win Ratio " strategy, this indicator is also included.
A FREE 5 DAY VERSION of the " EURUSD Binary Strategy 73% Win Ratio " Strategy is available! Go try it now!
Best regards!
Contact:
emilianomesauribe2000@live.com

Data Source Crement AlertsSet DIfferent sources of the data you want
Set the levels for the alert
Sell is Crossing down on the higher and buy is crossing over the lower level