AsianRange&Midnight 2.2### Midnight Setup: Trading Strategy
#### **Bias Definition (Trend Identification)**
- The Daily (D) bias is defined the previous day and validated on the line chart.
- On the Daily chart, identify the nearest V-shaped formation that has broken close to the current price. This formation determines the Daily bias direction.
#### **H4 Bias Analysis (Trend Confirmation)**
- Switch to an H4 chart to refine the analysis.
- Identify a similar V-shaped formation that has broken in the H4 timeframe.
- If the Daily and H4 biases are aligned, the setup is valid.
#### **Entry Strategy (Position Entries)**
- **Bearish Bias (D and H4 identical):**
- Short entry at the high level of the Midnight range.
- **Bullish Bias (D and H4 identical):**
- Long entry at the low level of the Midnight range.
#### **Bias Divergence (Context Adaptation)**
- If the H4 bias is opposite to the Daily bias, this indicates an H4 retracement of the Daily bias.
- Enter a counter-trend trade with reduced risk.
- No TP target beyond 50% of the extension validating the Daily break. It is also not recommended to enter against this divergence beyond 50%.
#### **Divergence Scenarios (Reactions to Divergences)**
- **Daily Bearish Bias, H4 Bullish Bias:**
- Long entry at the Midnight Low.
- **Daily Bullish Bias, H4 Bearish Bias:**
- Short entry at the Midnight High.
#### **Daily Bias Resumption (Trend Alignment)**
- As soon as the H4 bias resumes the Daily bias direction, follow this trend and adjust the position accordingly.
#### **Instructions for Divergent Bias (Managing Divergence)**
- When holding a position with a divergent bias, it is crucial to manage it carefully.
- Exit counter-trend trades as soon as the H4 bias realigns with the Daily bias.
- Limit the duration of counter-trend trades per session and adjust the H4 bias for the next session if needed.
#### **SL/TP Management (Profit Taking and Protection Optimization)**
- **Take Profit (TP):**
- Entry in M15 with a minimum RR of 3.
- TP at 5H NYE, or RR 5, or 15H NYE.
- **Stop Loss (SL):**
- Minimum 15 pips, placed just above the nearest swing to the entry point to protect capital.
- **Red Announcement Days:**
- Either abstain from trading or set a 40-pip SL to limit volatility impact.
- **At 6H/7H NYE:**
- Manage the trade based on its progress: exit, set to BE (Break Even), or keep the SL in place.
- Any SL adjustment outside these rules can only be made if supported by data or backtests.
#### **Risk Management (Capital Protection)**
- Maximum risk of **1% of capital per trade** (allowing for **10 consecutive losses** without significantly affecting capital).
- In case of a loss, **reduce risk by 50% on the next trade** until the loss is recovered.
#### **Efficiency Conditions (When This Setup Works Best)**
- This setup is particularly effective in **strong trends**, where the market has a clear direction.
- It is **less effective in ranging markets**, where prices move within a narrow range without a clear trend.
Setup Midnight : Stratégie de Trading
在脚本中搜索"backtest"

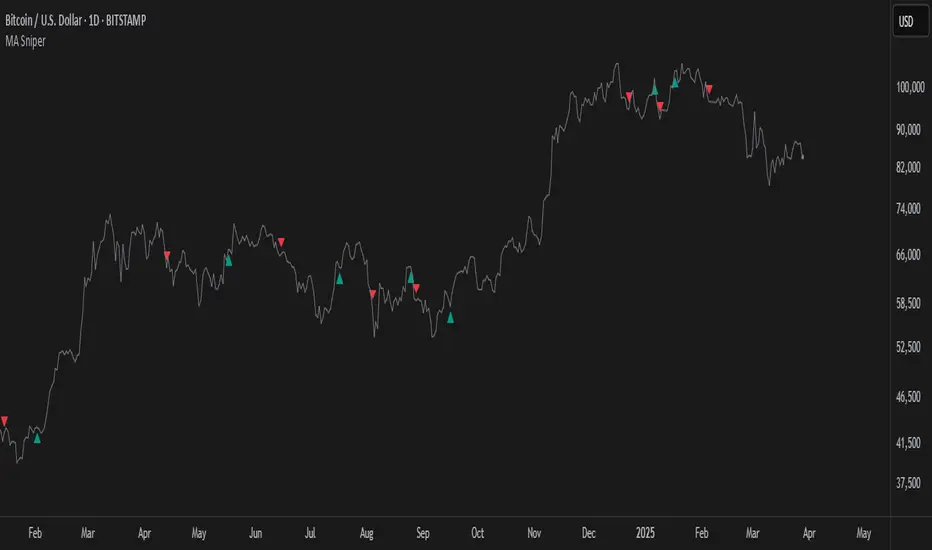
MA SniperThis indicator automatically finds the most effective moving average to use in a price crossover strategy—so you can focus on trading, not testing. It continuously evaluates a wide range of moving average periods, ranks them based on real-time market performance, and selects the one delivering the highest quality signals. The result? A smarter, adaptive tool that shows you exactly when price crosses its optimal moving average—bullish signals in green, bearish in red.
What makes it unique is the way it thinks.
Under the hood, the script doesn’t just pick a random MA or let you choose one manually. Instead, it backtests a large panel of moving average lengths for the current asset and timeframe. It evaluates each one by calculating its **Profit Factor**—a key performance metric used by pros to measure the quality of a strategy. Then, it assigns each MA a score and ranks them in a clean, built-in table so you can see, at a glance, which ones are currently most effective.
From that list, it picks the top-performing MA and uses it to generate live crossover signals on your chart. That MA is plotted automatically, and the signals adapt in real-time. This isn’t a static setup—it’s a dynamic system that evolves as the market evolves.
Even better: the indicator detects the type of instrument you’re trading (forex, stocks, etc.) and adjusts its internal calculations accordingly, including how many bars per day to consider. That means it remains highly accurate whether you’re trading EURUSD, SPX500, or TSLA.
You also get a real-time dashboard (via the table) that acts as a transparent scorecard. Want to see how other MAs are doing? You can. Want to understand why a certain MA was selected? The data is right there.
This tool is for traders who love crossover strategies but want something smarter, faster, and more precise—without spending hours manually testing. Whether you're scalping or swing trading, it offers a data-driven edge that’s hard to ignore.
Give it a try—you’ll quickly see how powerful it can be when your MA does the thinking for you.
This tool is for informational and educational purposes only. Trading involves risk, and past performance does not guarantee future results. Use responsibly.
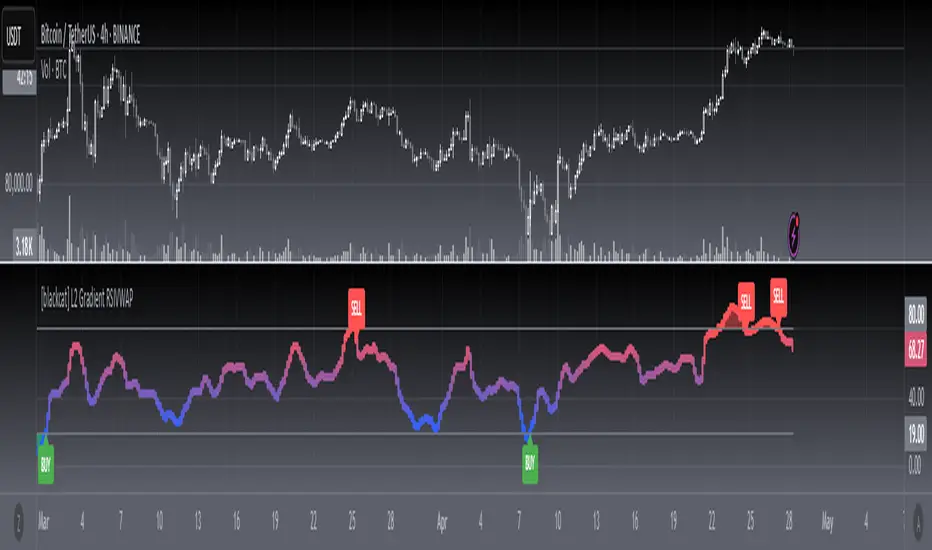
[blackcat] L2 Gradient RSIVWAPOVERVIEW
The L2 Gradient RSIVWAP indicator offers traders a powerful tool for assessing market conditions by combining Relative Strength Index (RSI) with Volume Weighted Average Price (VWAP). It features dynamic coloring and clear buy/sell signals to enhance decision-making.
Customizable Inputs: Adjust key parameters such as RSI-VWAP length, oversold/overbought levels, and smoothing period.
Gradient Color Visualization: Provides intuitive gradient coloring to represent RSI-VWAP values.
Buy/Sell Indicators: On-chart labels highlight potential buying and selling opportunities.
Transparent Fills: Visually distinguishes overbought and oversold zones without obscuring other data.
Access the TradingView platform and select the chart where you wish to implement the indicator.
Go to “Indicators” in the toolbar and search for “ L2 Gradient RSIVWAP.”
Click “Add to Chart” to integrate the indicator into your chart.
Customize settings via the input options:
Toggle between standard RSI and RSI-based VWAP.
Set preferred lengths and thresholds for RSI-VWAP calculations.
Configure the smoothing period for ALMA.
Performance can vary based on asset characteristics like liquidity and volatility.
Historical backtests do not predict future market behavior accurately.
The ALMA function, developed by Arnaud Legoux, enhances response times relative to simple moving averages.
Buy and sell signals are derived from RSI-VWAP crossovers; consider additional factors before making trades.
Special thanks to Arnaud Legoux for creating the ALMA function.
Momentum Based RSIThe Momentum Based RSI is an enhancement to the RSI. it incorporates 2 sections:
MA Ratio (Fast/Slow)
RSI
at the end both of those are multiplied to create a more responsive RSI which reacts fast to market moves while still providing a whip ressistant tool.
Momentum Calculation
The "MA Ratio" as i like to call it results from comparing 2 MAs (both can be set to whatever type you like) against eachother, which, in the end, provides a Ratio that visualizes the difference. It is simple yet effective
RSI
An Old yet popular tool which dates back to 1978. In and out of itself it is a great tool, however it still can be enhanced.
The Combination
The RSI and the MARatio are multiplied together, which results in an RSI that is ampliefied by the speed of the market movements.
This proves highly effective, since the MA Ratio is hovering around at the same level. However during trends, it picks up speed in either of both directions which marginally increases the RSI's response the said movement.
Why its Creative, New and Good
While it is a super simple concept, it still holds a lot of power relative to its sophistication. Traders may use it like they used the Vanilla RSI (e.g Trend following, Mean-reversion or other).
Unlike RSI with momentum overlays, this indicator actively uses an MA Ratio multiplier for simplicity and responsiveness.
At last, Its primary goal is to detect trends faster while not creating more noise & false signals.
What not to do
if youre using this indicator, please do NOT change the Fast MA to be slower than to Slow MA or vice versa, since you'll be getting broken & noise induced signals which may not align with your goals.
Great inventions require great Care
As with anything, you should not use this tool without any other confluence. As great as the backtests may be, you dont know what the future holds, be careful!
This indicator is not a guaranteed predicition tool. If youre going to use it for investment decisions, please use it in coherence with other tools.
Thank you for reading!

[F.B]_ZLEMA MACD ZLEMA MACD – A Zero-Lag Variant of the Classic MACD
Introduction & Motivation
The Moving Average Convergence Divergence (MACD) is a standard indicator for measuring trend strength and momentum. However, it suffers from the latency of traditional Exponential Moving Averages (EMAs).
This variant replaces EMAs with Zero Lag Exponential Moving Averages (ZLEMA), reducing delay and increasing the indicator’s responsiveness. This can potentially lead to earlier trend change detection, especially in highly volatile markets.
Calculation Methodology
2.1 Zero-Lag Exponential Moving Average (ZLEMA)
The classic EMA formula is extended with a correction factor:
ZLEMA_t = EMA(2 * P_t - EMA(P_t, L), L)
where:
P_t is the closing price,
L is the smoothing period length.
2.2 MACD Calculation Using ZLEMA
MACD_t = ZLEMA_short,t - ZLEMA_long,t
with standard parameters of 12 and 26 periods.
2.3 Signal Line with Adaptive Methodology
The signal line can be calculated using ZLEMA, EMA, or SMA:
Signal_t = f(MACD, S)
where f is the chosen smoothing function and S is the period length.
2.4 Histogram as a Measure of Momentum Changes
Histogram_t = MACD_t - Signal_t
An increasing histogram indicates a relative acceleration in trend strength.
Potential Applications in Data Analysis
Since the indicator is based solely on price time series, its effectiveness as a standalone trading signal is limited. However, in quantitative models, it can be used as a feature for trend quantification or for filtering market phases with strong trend dynamics.
Potential use cases include:
Trend Classification: Segmenting market phases into "trend" vs. "mean reversion."
Momentum Regime Identification: Analyzing histogram dynamics to detect increasing or decreasing trend strength.
Signal Smoothing: An alternative to classic EMA smoothing in more complex multi-factor models.
Important: Using this as a standalone trading indicator without additional confirmation mechanisms is not recommended, as it does not demonstrate statistical superiority over other momentum indicators.
Evaluation & Limitations
✅ Advantages:
Reduced lag compared to the classic MACD.
Customizable signal line smoothing for different applications.
Easy integration into existing analytical pipelines.
⚠️ Limitations:
Not a standalone trading system: Like any moving average, this indicator is susceptible to noise and false signals in sideways markets.
Parameter sensitivity: Small changes in period lengths can lead to significant signal deviations, requiring robust optimization.
Conclusion
The ZLEMA MACD is a variant of the classic MACD with reduced latency, making it particularly useful for analytical purposes where faster adaptation to price movements is required.
Its application in trading strategies should be limited to multi-factor models with rigorous evaluation. Backtests and out-of-sample analyses are essential to avoid overfitting to past market data.
Disclaimer: This indicator is provided for informational and educational purposes only and does not constitute financial advice. The author assumes no responsibility for any trading decisions made based on this indicator. Trading involves significant risk, and past performance is not indicative of future results.

Multi-Indicator Signals with Selectable Options by DiGetMulti-Indicator Signals with Selectable Options
Script Overview
This Pine Script is a multi-indicator trading strategy designed to generate buy/sell signals based on combinations of popular technical indicators: RSI (Relative Strength Index) , CCI (Commodity Channel Index) , and Stochastic Oscillator . The script allows you to select which combination of signals to display, making it highly customizable and adaptable to different trading styles.
The primary goal of this script is to provide clear and actionable entry/exit points by visualizing buy/sell signals with arrows , labels , and vertical lines directly on the chart. It also includes input validation, dynamic signal plotting, and clutter-free line management to ensure a clean and professional user experience.
Key Features
1. Customizable Signal Types
You can choose from five signal types:
RSI & CCI : Combines RSI and CCI signals for confirmation.
RSI & Stochastic : Combines RSI and Stochastic signals.
CCI & Stochastic : Combines CCI and Stochastic signals.
RSI & CCI & Stochastic : Requires all three indicators to align for a signal.
All Signals : Displays individual signals from each indicator separately.
This flexibility allows you to test and use the combination that works best for your trading strategy.
2. Clear Buy/Sell Indicators
Arrows : Buy signals are marked with upward arrows (green/lime/yellow) below the candles, while sell signals are marked with downward arrows (red/fuchsia/gray) above the candles.
Labels : Each signal is accompanied by a label ("BUY" or "SELL") near the arrow for clarity.
Vertical Lines : A vertical line is drawn at the exact bar where the signal occurs, extending from the low to the high of the candle. This ensures you can pinpoint the exact entry point without ambiguity.
3. Dynamic Overbought/Oversold Levels
You can customize the overbought and oversold levels for each indicator:
RSI: Default values are 70 (overbought) and 30 (oversold).
CCI: Default values are +100 (overbought) and -100 (oversold).
Stochastic: Default values are 80 (overbought) and 20 (oversold).
These levels can be adjusted to suit your trading preferences or market conditions.
4. Input Validation
The script includes built-in validation to ensure that oversold levels are always lower than overbought levels for each indicator. If the inputs are invalid, an error message will appear, preventing incorrect configurations.
5. Clean Chart Design
To avoid clutter, the script dynamically manages vertical lines:
Only the most recent 50 buy/sell lines are displayed. Older lines are automatically deleted to keep the chart clean.
Labels and arrows are placed strategically to avoid overlapping with candles.
6. ATR-Based Offset
The vertical lines and labels are offset using the Average True Range (ATR) to ensure they don’t overlap with the price action. This makes the signals easier to see, especially during volatile market conditions.
7. Scalable and Professional
The script uses arrays to manage multiple vertical lines, ensuring scalability and performance even when many signals are generated.
It adheres to Pine Script v6 standards, ensuring compatibility and reliability.
How It Works
Indicator Calculations :
The script calculates the values of RSI, CCI, and Stochastic Oscillator based on user-defined lengths and smoothing parameters.
It then checks for crossover/crossunder conditions relative to the overbought/oversold levels to generate individual signals.
Combined Signals :
Depending on the selected signal type, the script combines the individual signals logically:
For example, a "RSI & CCI" buy signal requires both RSI and CCI to cross into their respective oversold zones simultaneously.
Signal Plotting :
When a signal is generated, the script:
Plots an arrow (upward for buy, downward for sell) at the corresponding bar.
Adds a label ("BUY" or "SELL") near the arrow for clarity.
Draws a vertical line extending from the low to the high of the candle to mark the exact entry point.
Line Management :
To prevent clutter, the script stores up to 50 vertical lines in arrays (buy_lines and sell_lines). Older lines are automatically deleted when the limit is exceeded.
Why Use This Script?
Versatility : Whether you're a scalper, swing trader, or long-term investor, this script can be tailored to your needs by selecting the appropriate signal type and adjusting the indicator parameters.
Clarity : The combination of arrows, labels, and vertical lines ensures that signals are easy to spot and interpret, even in fast-moving markets.
Customization : With adjustable overbought/oversold levels and multiple signal options, you can fine-tune the script to match your trading strategy.
Professional Design : The script avoids clutter by limiting the number of lines displayed and using ATR-based offsets for better visibility.
How to Use This Script
Add the Script to Your Chart :
Copy and paste the script into the Pine Editor in TradingView.
Save and add it to your chart.
Select Signal Type :
Use the "Signal Type" dropdown menu to choose the combination of indicators you want to use.
Adjust Parameters :
Customize the lengths of RSI, CCI, and Stochastic, as well as their overbought/oversold levels, to match your trading preferences.
Interpret Signals :
Look for green arrows and "BUY" labels for buy signals, and red arrows and "SELL" labels for sell signals.
Vertical lines will help you identify the exact bar where the signal occurred.
Tips for Traders
Backtest Thoroughly : Before using this script in live trading, backtest it on historical data to ensure it aligns with your strategy.
Combine with Other Tools : While this script provides reliable signals, consider combining it with other tools like support/resistance levels or volume analysis for additional confirmation.
Avoid Overloading the Chart : If you notice too many signals, try tightening the overbought/oversold levels or switching to a combined signal type (e.g., "RSI & CCI & Stochastic") for fewer but higher-confidence signals.

Forward Curve Visualization ToolProvide the spot symbol and the futures product root, and the script automatically scans all relevant contracts for you—no more tedious manual searches. The result is a clean, intuitive chart showing the live forward curve in real time.
It also detects contango or backwardation conditions (based on spot < F1 < F2 < F3).
Future Features:
Plot historical snapshots of the curve (1 day, 1 week, or 1 month ago) to understand market trends over time.
Display additional metrics such as annualized basis, cost of carry (CoC), and even volume or open interest for deeper insights.
If you trade futures and watch the forward curve, this script will give you the actionable data you need and get more ideas or features you’d like to see. Let’s build them together!
Disclaimer
Please remember that past performance may not be indicative of future results.
Due to various factors, including changing market conditions, the strategy may no longer perform as well as in historical backtesting.
This post and the script don’t provide any financial advice.

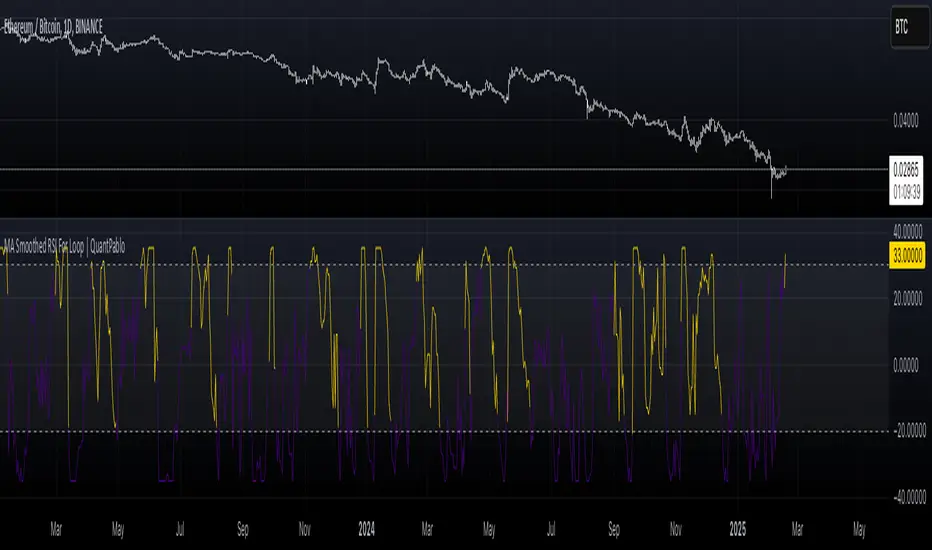
MA Smoothed RSI For Loop | QuantPabloMA Smoothed Source For RSI Loop | Crypto_Mercenary_
Conceptual Foundation and Innovation
The "MA Smoothed Source For RSI Loop" indicator developed by Crypto_Mercenary_ innovates by smoothing the source data used for RSI calculation with various moving averages before feeding it into a for-loop scoring system. Rather than smoothing the RSI itself, this approach focuses on pre-processing the price data to reduce noise, thereby providing a cleaner input for RSI computation. The for-loop then evaluates this smoothed RSI to generate momentum signals, offering traders a refined method for detecting market trends and potential reversals.
Technical Composition and Calculation
The indicator's functionality is divided into two main parts:
Source Smoothing: Before calculating RSI, the source data (typically close price) is smoothed using one of several moving averages (EMA, SMA, WMA, VWMA, HMA, RMA, DEMA, or none) as selected by the user. This smoothing aims to filter out short-term volatility, providing a more consistent base for RSI calculation.
RSI Calculation and For-Loop Scoring:
RSI: Calculated using the smoothed source data over a user-defined length.
For-Loop Mechanism: A loop runs from a to b, comparing the current RSI value with past values of this smoothed RSI. A score (counter) is generated, which increases or decreases based on whether the current RSI exceeds or falls below past values. If the weighted option is activated, this comparison gives more weight to recent data points, adjusting the score accordingly.
The final score is then potentially normalized for better interpretation, compared against thresholds to determine market momentum signals.
Features and User Inputs
This indicator is highly customizable, allowing traders to tailor its behavior:
Weighted Calculation: Option to adjust scoring to favor recent price action.
RSI Length: Sets the period for RSI calculation.
Source: The price data to be smoothed before RSI calculation, default is close.
MA Type: Choice from various moving averages to smooth the source data.
Smooth Length: Length of the moving average used for smoothing.
For Loop Range: Defines the historical range (a to b) for the scoring loop.
Thresholds: Custom thresholds to define when signals for uptrends or downtrends are generated.
Practical Applications
This indicator is particularly beneficial for:
Identifying Momentum Shifts: The scoring system helps in detecting potential changes in market momentum.
Noise Reduction: By smoothing the source data, it aims to provide more reliable RSI signals in volatile markets.
Trend Analysis: Assists in confirming or challenging the current market trend based on the smoothed RSI's performance.
Advantages and Strategic Value
The "MA Smoothed Source For RSI Loop" offers an advantage by focusing on cleaning the input data for RSI, which can lead to more accurate momentum readings. Its flexibility in configuration allows traders to adapt the indicator to different market conditions or asset volatilities, enhancing its strategic value in trading decisions.
Alerts and Visual Cues
Visual Signals: The indicator plots the loop score, with colors indicating uptrends (gold) or downtrends (blue). Horizontal lines at thresholds and shaded areas between them provide visual aids for trend analysis.
**No explicit alerts in the script, but users can set up custom alerts based on the signals.
Summary and Usage Tips
The "MA Smoothed Source For RSI Loop | Crypto_Mercenary_" provides a nuanced approach to RSI by smoothing the price data before its calculation, resulting in potentially more reliable signals. Traders can use this indicator to gain a clearer picture of market momentum, adjusting parameters to fit different market behaviors or trading strategies. Remember, the effectiveness of this tool largely depends on its customization to the specific market context.
Note: Backtests are based on past results and do not guarantee future performance.
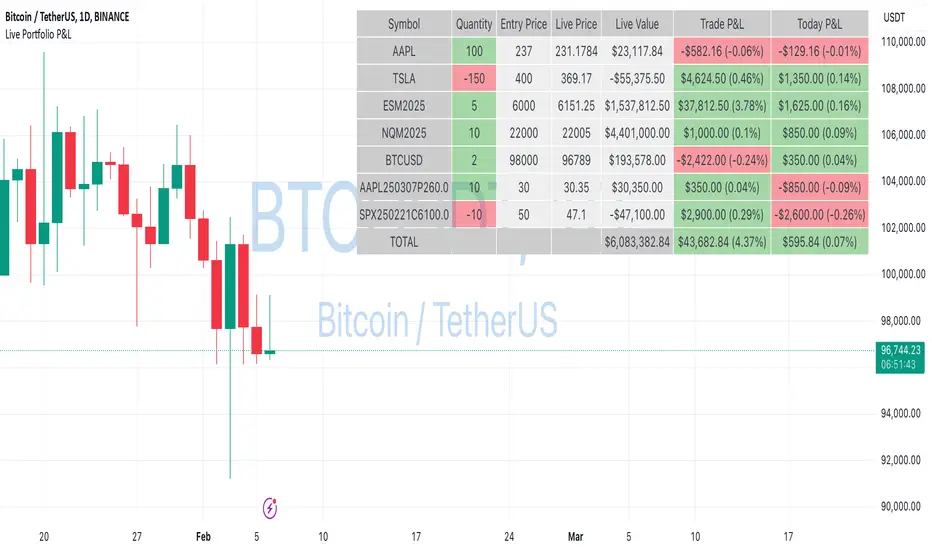
Live Portfolio P<his script calculates live P&L (Profit & Loss) for up to 40 instruments — stocks, ETFs, options, futures, and Forex pairs supported by TradingView. Instead of juggling numerous inputs, you paste your portfolio in CSV format into a single text field, and the script handles the rest. It parses each position and displays a comprehensive table showing the symbol, current price, position value, total P&L, and today’s P&L—all updated in real time.
Key Features
CSV Portfolio Input – Effortlessly import all your positions at once without filling in multiple fields. You can export the position from your broker, save it in the required format, and paste it into this script.
Supports Various Asset Classes – Works with any instrument that TradingView provides data for, including futures, options, and Forex.
Up to 40 Instruments – Track a broad and diverse set of holdings in one place.
Real-Time Updates – Get immediate feedback on live price changes, total value, and current P&L.
Today’s P&L – Monitor your daily performance to gauge short-term trends.
CSV is consumed in the following format:
Symbol (supported TradingView instruments)
Entry Price
Quantity (negative for short position)
Lot Size (for futures/options, it might not be one)
For example:
AAPL,237,100,1
TSLA,400,-150,1
ESM2025,6000,5,50
Planned Enhancements
Multi-Currency Support – Automatically convert and display your positions’ values in different currencies.
Advanced Metrics – Get deeper insights with calculations for drawdown, Sharpe ratio, and more.
Risk Management Tools – Set stop-loss and take-profit levels and receive alerts when thresholds are hit.
Option Greeks & Margin Calculations – Manage complex option strategies and track margin requirements.
Questions for You
What additional features would you like to see?
Are there any specific metrics or analytics you’d find especially valuable?
How might this script fit into your current trading workflow?
Feel free to share your thoughts and suggestions. Your feedback will help shape future updates and make this tool even more helpful for traders like you!
Disclaimer
Please remember that past performance may not be indicative of future results.
Due to various factors, including changing market conditions, the strategy may no longer perform as well as in historical backtesting.
This post and the script don’t provide any financial advice.
hector mena Breakout Trading with ATR, RSI and MA CrossTitle: Breakout Trading Strategy with ATR, RSI, and Moving Average Cross
Description (English):
This script combines key technical indicators—ATR (Average True Range), RSI (Relative Strength Index), and Moving Averages—to provide a comprehensive breakout trading strategy. It is designed to help traders identify significant breakout levels and confirm signals with momentum and trend analysis.
How It Works:
ATR for Breakout Levels:
The ATR is used to calculate dynamic breakout levels by adjusting the highest resistance and lowest support levels with a customizable multiplier. This ensures that breakout levels adapt to market volatility.
RSI for Momentum Confirmation:
The RSI identifies overbought and oversold conditions, providing an additional layer of confirmation for breakouts. A breakout accompanied by an RSI signal can indicate stronger momentum.
Moving Average Cross for Trend Validation:
Two simple moving averages (short-term and long-term) are included to validate the trend. A crossover suggests a potential change in trend, aligning with breakout signals.
Why Combine These Indicators?
The ATR ensures breakout levels are realistic and volatility-adjusted.
The RSI avoids false signals by confirming if the price has momentum during a breakout.
Moving Average crossovers add trend-following confirmation, helping traders align with market direction.
The combination provides a robust framework to filter out false signals and improve the reliability of trading decisions.
Key Features:
Breakout Levels: Upper and lower breakout levels dynamically calculated using ATR.
RSI Confirmation: Visual overbought (70) and oversold (30) levels and RSI plot.
Trend Validation: Short and long-term moving averages plotted on the chart with crossover signals.
Visual Alerts: Clear "BUY" and "SELL" labels for actionable signals.
Custom Alerts: Configurable alerts for breakouts and moving average crossovers.
How to Use It:
Adjust the parameters (ATR length, multiplier, RSI length, and moving averages) based on your trading strategy.
Look for "BUY" signals when:
Price breaks above the resistance level, and RSI indicates oversold conditions.
Moving averages cross bullishly.
Look for "SELL" signals when:
Price breaks below the support level, and RSI indicates overbought conditions.
Moving averages cross bearishly.
Use alerts for automated notifications about potential trades.
Notes:
This script is intended for educational purposes. Use it alongside proper risk management techniques and backtesting.
Always test in demo mode before applying it to live trading.

Bollinger Bands Reversal Strategy Analyzer█ OVERVIEW
The Bollinger Bands Reversal Overlay is a versatile trading tool designed to help traders identify potential reversal opportunities using Bollinger Bands. It provides visual signals, performance metrics, and a detailed table to analyze the effectiveness of reversal-based strategies over a user-defined lookback period.
█ KEY FEATURES
Bollinger Bands Calculation
The indicator calculates the standard Bollinger Bands, consisting of:
A middle band (basis) as the Simple Moving Average (SMA) of the closing price.
An upper band as the basis plus a multiple of the standard deviation.
A lower band as the basis minus a multiple of the standard deviation.
Users can customize the length of the Bollinger Bands and the multiplier for the standard deviation.
Reversal Signals
The indicator identifies potential reversal signals based on the interaction between the price and the Bollinger Bands.
Two entry strategies are available:
Revert Cross: Waits for the price to close back above the lower band (for longs) or below the upper band (for shorts) after crossing it.
Cross Threshold: Triggers a signal as soon as the price crosses the lower band (for longs) or the upper band (for shorts).
Trade Direction
Users can select a trade bias:
Long: Focuses on bullish reversal signals.
Short: Focuses on bearish reversal signals.
Performance Metrics
The indicator calculates and displays the performance of trades over a user-defined lookback period ( barLookback ).
Metrics include:
Win Rate: The percentage of trades that were profitable.
Mean Return: The average return across all trades.
Median Return: The median return across all trades.
These metrics are calculated for each bar in the lookback period, providing insights into the strategy's performance over time.
Visual Signals
The indicator plots buy and sell signals on the chart:
Buy Signals: Displayed as green triangles below the price bars.
Sell Signals: Displayed as red triangles above the price bars.
Performance Table
A customizable table is displayed on the chart, showing the performance metrics for each bar in the lookback period.
The table includes:
Win Rate: Highlighted with gradient colors (green for high win rates, red for low win rates).
Mean Return: Colored based on profitability (green for positive returns, red for negative returns).
Median Return: Colored similarly to the mean return.
Time Filtering
Users can define a specific time window for the indicator to analyze trades, ensuring that performance metrics are calculated only for the desired period.
Customizable Display
The table's font size can be adjusted to suit the user's preference, with options for "Auto," "Small," "Normal," and "Large."
█ PURPOSE
The Bollinger Bands Reversal Overlay is designed to:
Help traders identify high-probability reversal opportunities using Bollinger Bands.
Provide actionable insights into the performance of reversal-based strategies.
Enable users to backtest and optimize their trading strategies by analyzing historical performance metrics.
█ IDEAL USERS
Swing Traders: Looking for reversal opportunities within a trend.
Mean Reversion Traders: Interested in trading price reversals to the mean.
Strategy Developers: Seeking to backtest and refine Bollinger Bands-based strategies.
Performance Analysts: Wanting to evaluate the effectiveness of reversal signals over time.

[blackcat] L2 Waveband Trading█ OVERVIEW
The Waveband Trading script calculates trading signals based on a modified Relative Strength Index (RSI)-like system combined with specific price action criteria. It plots two lines representing different smoothed RSI-like indicators and marks potential buying opportunities labeled as "S" for stronger trends and "B" for weaker but still favorable ones.
█ LOGICAL FRAMEWORK
The script begins by defining the waveband_trading_signals function which computes RSI-like metrics and determines buy signals under certain conditions. The main sections include input parameter definitions, function calls, data processing within the function, and plot commands for visual representation. Data flows from historical OHLCV data to various technical computations like EMAs and SMAs before being evaluated against user-defined thresholds to generate trade signals.
█ CUSTOM FUNCTIONS
Waveband Trading Signals:
• Purpose: Computes waveband trading signals using a customized version of the RSI indicator.
• Parameters:
— overboughtLevel: Threshold level indicating market overbought condition.
— oversoldLevel: Threshold level indicating market oversold condition.
— strongHoldLevel: Strong hold condition threshold between neutral and overbought states.
— moderateHoldLevel: Moderate hold condition threshold below strong hold level.
• [b>Returns: A tuple containing:
— k: Smoothed RSI-like metric.
— d: Further smoothed version of 'k'.
— buySignalStrong: Boolean indicating a strong trend buy signal.
— buySignalWeak: Boolean indicating a weak but promising buy signal.
█ KEY POINTS AND TECHNIQUES
• Utilizes EMA and SMA functions to smooth out price variations effectively.
• Employs crossover logic between fast ('k') and slow ('d') indicators to identify entry points.
• Incorporates volume checks ensuring increasing interest in trades aligns with upwards momentum.
• Leverages predefined threshold levels allowing flexibility to adapt to varying market conditions.
• Uses the new labeling feature ( label.new ) introduced in Pine Script v5 for marking significant chart events visually.
█ EXTENDED KNOWLEDGE AND APPLICATIONS
Potential enhancements could involve incorporating additional filters such as MACD crossovers or Fibonacci retracement levels alongside optimizing current conditions via backtesting. This technique might also prove useful in other strategies requiring robust confirmation methods beyond simple price action; alternatively, adapting it into a more automated form for execution on exchanges offering API access. Understanding key functionalities like relative strength assessment, smoothed averaging techniques, and conditional buy/sell rules enriches one’s toolkit when developing complex trading algorithms tailored specifically toward personal investment philosophies.

HMA Buy Sell Signals - Profit ManagerNote : Settings should be adjusted according to the selected time frame. Try to find the best setting according to the profitability rate
Overall Functionality
This script combines several trading tools to create a comprehensive system for trend analysis, trade execution, and performance tracking. Users can identify market trends using specific moving averages and RSI indicators while managing profit and loss levels automatically.
Trend Detection and Trade Signals
Hull Moving Averages (HMA):
Two HMAs (a faster one and a slower one) are used to determine the market trend.
A buy signal is generated when the faster HMA crosses above the slower HMA.
Conversely, a sell signal is triggered when the faster HMA crosses below the slower one.
Visual Feedback:
Trend lines on the chart change color to reflect the trend direction (e.g., green for upward trends and red for downward trends).
Trade Levels and Management
Entry, Take-Profit, and Stop-Loss Levels:
When the trend shifts upwards, the script calculates entry, take-profit, and stop-loss levels based on the opening price.
Similarly, for downward trends, these levels are determined for short trades.
Commission Tracking:
Each trade includes a commission cost, which is factored into net profit and loss calculations.
Dynamic Labels:
Entry, take-profit, and stop-loss levels are visually marked on the chart for easier tracking.
Performance Tracking
Profit and Loss Tracking:
The script keeps a running total of profits, losses, and commissions for both long and short trades.
It also calculates the net profit after all costs are considered.
Performance Table:
A table is displayed on the chart summarizing:
The number of trades.
Total profit and loss for long and short positions.
Commission costs.
Net profit.
Fractal Support and Resistance
Dynamic Lines:
The script identifies the most recent significant highs and lows using fractals.
It draws support and resistance lines that automatically update as new fractals form.
Simplified Visuals:
The chart always shows the last two support and resistance lines, keeping the visualization clean and focused.
RSI-Based Signals
Overbought and Oversold Levels:
RSI is used to identify overbought (above 80) and oversold (below 20) conditions.
The script generates buy signals at oversold levels and sell signals at overbought levels.
Chart Indicators:
Arrows and labels appear on the chart to highlight these RSI-based opportunities.
Customization
The script allows users to customize key parameters such as:
Moving average lengths for trend detection.
Take-profit and stop-loss percentages.
Timeframes for backtesting.
Starting capital and commission rates.
Conclusion
This script is a versatile tool for traders, combining trend detection, automated trade management, and visual feedback. It simplifies decision-making by providing clear signals and tracking performance metrics, making it suitable for both beginners and experienced traders.
* The most recently drawn fractals represent potential support and resistance levels. If the price aligns with these levels at the time of entering a trade, it may indicate a likelihood of reversal. In such cases, it’s advisable to either avoid entering the trade altogether or proceed with increased caution.

MERCURY-PRO by DrAbhiramSivprasd“MERCURYPRO”
The MERCURYPRO indicator is a custom technical analysis tool designed to provide dynamic trend signals based on a combination of the Chande Momentum Oscillator (CMO) and Standard Deviation (StDev). This indicator helps traders identify trend reversals or continuation based on the behavior of the price and momentum.
Key Features:
• Source Input: The indicator works with any price data, with the default set to close, which represents the closing price of each bar.
• Length Input: A period (default value 9) is used to determine the calculation window for the Chande Momentum Oscillator and Standard Deviation.
• Fixed CMO Length Option: Users can choose whether to use a fixed CMO length of 9 or adjust the length to the user-defined pds value.
• Calculation Method: The indicator allows switching between using the Chande Momentum Oscillator (CMO) or Standard Deviation (StDev) for the momentum calculation.
• Alpha: The smoothing factor used in the calculation of the MERCURYPRO value, which is based on the length of the period input (pds).
Core Calculation:
1. Momentum Calculation: The script calculates the momentum by determining the change in the source price (e.g., close) from one period to the next.
2. Chande Momentum Oscillator (CMO): The positive and negative momentum components are calculated and then summed over the specified period. This value is normalized to a percentage to determine the momentum strength.
3. K Value Calculation: The script selects either the CMO or Standard Deviation (depending on the user setting) to calculate the k value, which represents the dynamic price momentum.
4. MERCURYPRO Line: The final output of the indicator, MERCURYPRO, is computed using a weighted average of the k value and the previous MERCURYPRO value. The line is smoothed using the Alpha parameter.
Plot and Signal Generation:
• Color Coding: The line is color-coded based on the direction of MERCURYPRO:
• Blue: The trend is bullish (MERCURYPRO is rising).
• Maroon: The trend is bearish (MERCURYPRO is falling).
• Default Blue: Neutral or sideways market conditions.
• Plotting: The MERCURYPRO line is plotted with varying colors depending on the trend direction.
Alerts:
• Color Change Alert: The indicator has an alert condition based on when the MERCURYPRO line crosses its previous value. This helps traders stay informed about potential trend reversals or continuation signals.
Use Case:
• Trend Confirmation: Traders can use the MERCURYPRO indicator to identify whether the market is in a strong trend or not.
• Signal for Entries/Exits: The color change and crossovers of the MERCURYPRO line can be used as entry or exit signals, depending on the trader’s strategy.
Overall Purpose:
The MERCURYPRO indicator combines momentum analysis with smoothing techniques to offer a dynamic, responsive tool for identifying market trends and potential reversals. It is particularly useful in conjunction with other technical indicators to provide confirmation for trade setups.
How to Use the MERCURYPRO Indicator:
The MERCURYPRO indicator is designed to help traders identify trend reversals and market conditions. Here are a few ways you can use it:
1. Trend Confirmation (Bullish or Bearish)
• Bullish Trend: When the MERCURYPRO line is colored Blue, it indicates a rising trend, suggesting that the market is bullish.
• Action: You can consider entering long positions when the line turns blue, or holding your existing positions if you’re already long.
• Bearish Trend: When the MERCURYPRO line is colored Maroon, it signals a downward trend, indicating a bearish market.
• Action: You may consider entering short positions or closing any long positions when the line turns maroon.
2. Trend Reversal Alerts
• Color Change: The MERCURYPRO indicator changes color when there’s a trend reversal. The alert condition triggers when the MERCURYPRO crosses above or below its previous value, signaling a potential shift in the trend.
• Action: You can use this alert as a signal to monitor potential entry or exit points for trades. For example, a crossover from maroon to blue could indicate a potential buying opportunity, while a crossover from blue to maroon could suggest a selling opportunity.
3. Use with Other Indicators for Confirmation
• While the MERCURYPRO provides valuable trend insights, it’s often more effective when used in combination with other indicators like RSI (Relative Strength Index), MACD, or moving averages to confirm signals.
• Example: If MERCURYPRO turns blue and RSI is above 50, it may signal a strong bullish trend, enhancing the confidence to enter a long trade.
4. Divergence
• Watch for divergence between the MERCURYPRO line and the price chart:
• Bullish Divergence: If the price makes new lows while MERCURYPRO is showing higher lows, it suggests a potential bullish reversal.
• Bearish Divergence: If the price makes new highs while MERCURYPRO is showing lower highs, it suggests a potential bearish reversal.
Example of Use:
• Example 1: If the MERCURYPRO line changes from maroon to blue, you might enter a long position. After the MERCURYPRO line turns blue, use an alert to monitor the price action. If other indicators (like RSI) also suggest strength, your confidence in the trade will increase.
• Example 2: If the MERCURYPRO line shifts from blue to maroon, it could be a signal to close long positions and consider shorting the market if other conditions align (e.g., moving averages also turn bearish).
Warning for Using the MERCURYPRO Indicator:
1. Lagging Indicator:
• The MERCURYPRO is a lagging indicator, meaning it responds to price changes after they have occurred. This may delay entry and exit signals, and it’s crucial to combine it with other leading indicators to get timely information.
2. False Signals in Range-bound Markets:
• In choppy or sideways markets, the MERCURYPRO line can produce false signals, flipping between blue and maroon frequently without showing a clear trend. It’s important to avoid trading based on these false signals when the market is not trending.
3. Overreliance on One Indicator:
• Relying solely on MERCURYPRO can be risky. Always confirm signals with additional tools like volume analysis, price action, or other indicators to increase the accuracy of your trades.
4. Market Conditions Matter:
• The indicator may work well in trending markets, but in highly volatile or news-driven environments, it may provide misleading signals. Ensure that you take market fundamentals and external news events into consideration before acting on the indicator’s signals.
5. Risk Management:
• As with any technical indicator, MERCURYPRO is not infallible. Always use appropriate risk management techniques such as stop-loss orders to protect your capital. Never risk more than you can afford to lose on a trade.
6. Backtest First:
• Before implementing MERCURYPRO in live trading, make sure to backtest it on historical data. Test the strategy with various market conditions to assess its effectiveness and identify any potential weaknesses.
By considering these guidelines and warnings, you can use the MERCURYPRO indicator more effectively and mitigate potential risks in your trading strategy.

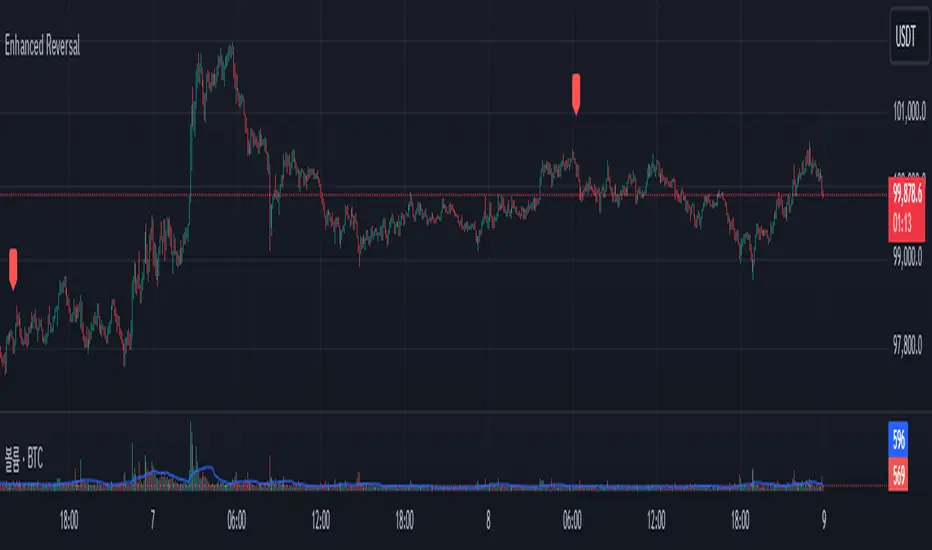
Enhanced Reversal DetectorEnhanced Reversal Detector - Script Description
Overview:
The Enhanced Reversal Detector is a highly refined indicator designed to identify precise trend reversals in financial markets. It improves upon the original reversal detection logic by incorporating additional filters for trend confirmation (using EMA), volume spikes, and candle patterns. These enhancements significantly increase the reliability and accuracy of reversal signals, making it an excellent tool for both short-term and long-term traders.
Key Features
Candle Lookback Logic:
The indicator evaluates historical price action over a user-defined lookback period to detect potential reversal zones.
Bullish reversal conditions are met when price consistently tests lows, and bearish reversal conditions are met when price tests highs.
Trend Confirmation (EMA Filter):
To ensure that reversal signals align with the broader market trend, the indicator incorporates an Exponential Moving Average (EMA) filter.
Bullish signals are only triggered when the price is above the EMA, while bearish signals are only triggered when the price is below the EMA.
Volume Spike Filter:
The indicator checks for significant increases in trading volume to confirm that the reversal is supported by strong market activity.
Volume spikes are calculated as trading volume exceeding a multiple of the 20-bar average volume (default: 1.5x).
Confirmation Period:
Users can define a confirmation window within which reversal signals must be validated.
This reduces false positives and ensures only strong reversals are considered.
Non-Repainting Mode:
Offers a non-repainting option, where signals are based on confirmed conditions from previous bars, ensuring reliability for backtesting.
Visual and Alert Features:
Clear visual markers on the chart indicate bullish (green triangle) and bearish (red triangle) reversal points.
Alert notifications can be enabled for both bullish and bearish reversals, keeping traders informed in real-time.
Inputs
Candle Lookback: Number of candles to evaluate for reversal conditions.
Confirm Within: Number of candles within which a reversal must be validated.
Non-Repainting Mode: Option to enable or disable repainting for signals.
EMA Length: The length of the Exponential Moving Average used for trend confirmation.
Volume Spike Multiplier: Multiplier for identifying significant increases in trading volume.
How It Works
Reversal Detection:
Bullish signals are triggered when:
Price consistently tests recent lows (lookback period).
Price closes above the EMA.
A significant volume spike occurs.
Bearish signals are triggered under opposite conditions (price testing highs, closing below EMA, and volume spike).
Signal Filtering:
Incorporates EMA and volume-based filters to eliminate false positives and focus on high-confidence reversal signals.
Alert Notifications:
Alerts notify users of bullish or bearish reversal opportunities as soon as they are detected.
Use Cases
Scalping and Day Trading:
Ideal for identifying reversals on lower timeframes (e.g., 1-minute or 5-minute charts).
Swing Trading:
Works effectively on higher timeframes (e.g., 1-hour or daily charts) for capturing significant
trend reversals.
Volatile Markets:
Particularly useful in high-volatility markets like cryptocurrencies or forex.
Customization Tips
Adjust the lookback period to fine-tune the sensitivity of the reversal detection.
Increase the volume spike multiplier for markets with irregular trading volumes to focus on significant moves.
Experiment with the EMA length to align signals with your trading strategy's preferred trend duration.
Conclusion
The Enhanced Reversal Detector combines advanced price action analysis, trend confirmation, and market participation filters to deliver high-accuracy reversal signals. With its customizable settings and robust filtering mechanisms, this indicator is an invaluable tool for identifying profitable trading opportunities while minimizing noise and false signals.
Volume-Adjusted Schaff Trend Cycle (VASTC)Volume-Adjusted Schaff Trend Cycle (VASTC)
The VASTC is a fairly fast-moving oscillator designed to identify trends early and signal when trends may be nearing their end. While it can be used for both trend-following and mean-reversion strategies , it shines in trend-following setups. It’s particularly useful for catching the start of a trend and giving early warnings that a trend might end soon, making it a valuable addition to a multi-indicator system.
How It Works:
The VASTC adapts the traditional Schaff Trend Cycle by adjusting the MACD component with volume data. This volume-adjusted MACD is run through two stochastic processes , applying exponential smoothing to enhance responsiveness. Volume sensitivity allows the VASTC to adapt dynamically to periods of high or low trading activity, providing more reliable trend signals.
Recommended Use:
Use VASTC in confluence with other indicators to confirm trend entries and exits. It’s best for identifying early trend setups rather than sustaining prolonged trend trades. When used alongside other indicators, especially those with a longer-term outlook or momentum based trend indicators, you’ll gain a clearer signal for potential exits or entries. Always backtest the VASTC on your chosen assets to determine the most effective input parameters, as the defaults may not suit all markets or assets. Different assets behave differently, and adjustments in parameters can improve its ability to analyze the assets you're looking at.
Parameters:
Length : Sets the primary smoothing length.
Fast/Slow Length : Adjust the speed of the volume-adjusted MACD component.
Factor : Controls the final smoothing applied to the STC.
Overbought/Oversold Levels : Defines overbought/oversold levels.
Experiment with these settings to customize the VASTC to your trading strategy and asset.
Disclaimer : This indicator is a tool to complement your trading analysis and should not be used in isolation. Always backtest and use other confluence signals for best results. The assets I looked at when making this indicator are almost certainly different than what you're looking at.

CAPE / Shiller PE RatioThe CAPE (Cyclically Adjusted Price-to-Earnings) or Shiller PE ratio is a popular valuation measure used by investors to assess whether a stock or index is over or undervalued relative to its historical earnings. Unlike the traditional P/E ratio, the CAPE ratio smooths earnings over ten years, adjusting for inflation and providing a more stable and long-term view of valuation.
This indicator lets you quickly calculate and visualize the CAPE ratio for any stock on TradingView, helping you make informed decisions about the sustainability of current price levels. With its clear presentation and intuitive setup, you can compare historical CAPE levels and identify potential opportunities for long-term investments or avoid overvalued markets.
Advantages of the CAPE Ratio:
Long-Term Focus : Smooth earnings over ten years, reducing the impact of short-term volatility.
Inflation-Adjusted : Provides a more precise, inflation-adjusted valuation measure over time.
Historical Comparison : Allows for benchmarking against long-term historical averages.
Market Sentiment Indicator : Can highlight overvalued or undervalued markets for long-term investors.
Reduces Noise : Filters out short-term earnings fluctuations, offering a more stable view.
Disadvantages of the CAPE Ratio:
Ignores Recent Earnings : Misses short-term earnings changes, which can affect current valuations.
Outdated Data : Relies on old earnings data that may not reflect recent company performance.
Less Effective for Growth Stocks : May undervalue high-growth stocks focused on future earnings.
Sector Limitations : Works best for broad markets, less so for fast-changing industries.
Debated Predictive Power : It’s unreliable for timing short-term market movements.
In short, the CAPE ratio is excellent for long-term valuation but has limitations for short-term or growth-focused investing.
Disclaimer
Please remember that past performance may not be indicative of future results.
Due to various factors, including changing market conditions, the strategy may no longer perform as well as in historical backtesting.
This post and the script don’t provide any financial advice.

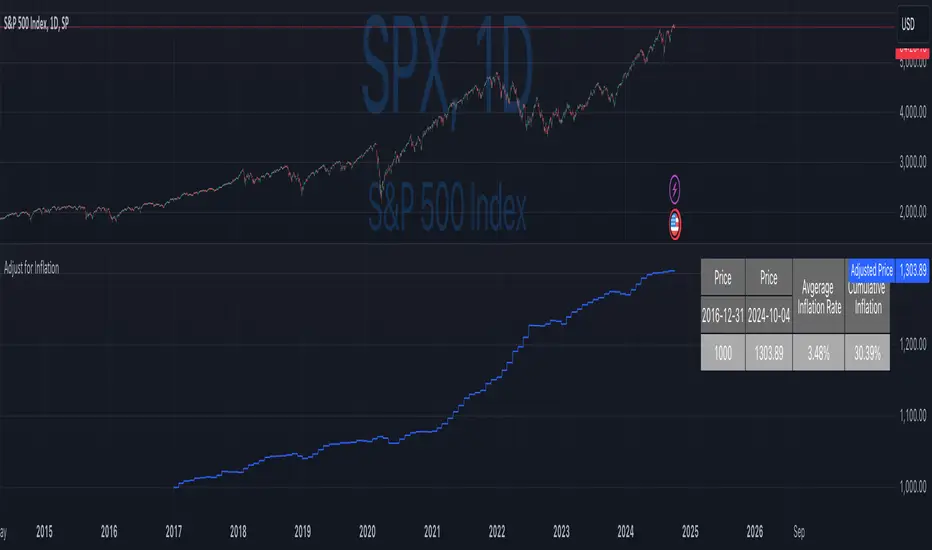
Inflation-Adjusted Price IndicatorThis indicator allows traders to adjust historical prices for inflation using customizable CPI data. The script computes the adjusted price by selecting a reference date, the original price, and the CPI source (US CPI or custom input) and plots it as a line on the chart. Additionally, a table summarizes the adjusted price values and average and total inflation rates.
While the indicator serves as a standalone tool to understand inflation's impact on prices, it is a supportive element in more advanced trading strategies requiring accurate analysis of inflation-adjusted data.
Disclaimer
Please remember that past performance may not be indicative of future results.
Due to various factors, including changing market conditions, the strategy may no longer perform as well as in historical backtesting.
This post and the script don’t provide any financial advice.
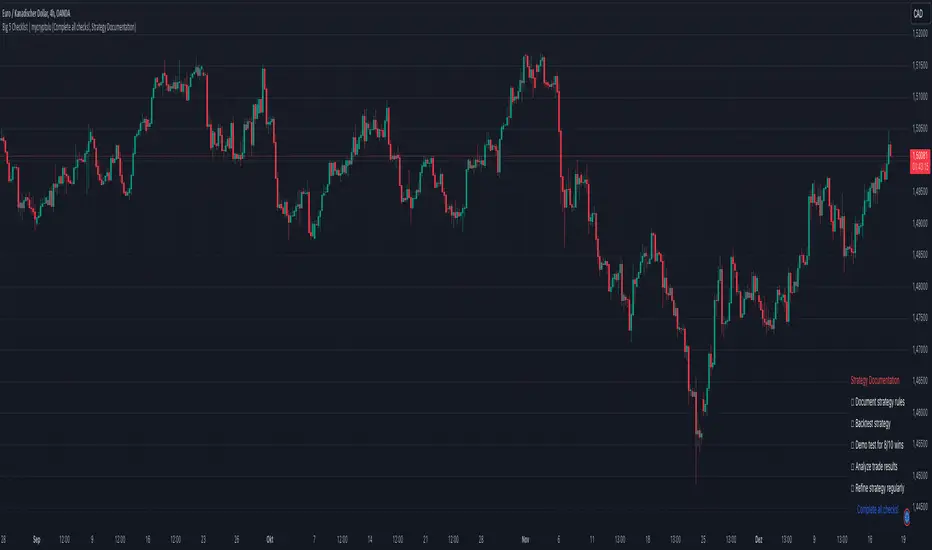
Big 5 Checklist | XEONEDIAThe Big 5 Checklist | XEONEDIA indicator is a powerful trading tool designed to help traders prepare their trading decisions in a structured and effective manner. The indicator encompasses five key areas:
Strategy Documentation :
✅ Ensure that the trading strategy is clearly defined and documented.
✅ Conduct backtesting.
✅ Perform demo testing with an 80% success rate.
✅ Analyze trading results.
✅ Regularly refine the strategy.
Risk Management :
✅ Minimize financial losses and ensure responsible trading.
✅ Set a risk limit of 1-2%.
✅ Use stop-loss orders.
✅ Ensure a risk-reward ratio of at least 2:1.
✅ Adjust position sizes.
Technical Analysis :
✅ Evaluate charts and indicators to identify trading opportunities.
✅ Identify support and resistance levels.
✅ Use technical indicators (e.g., RSI).
✅ Set entry and exit points.
✅ Establish alerts for specific market conditions.
Market Conditions :
✅ Consider external factors that may influence trading.
✅ Monitor the economic calendar.
✅ Apply fundamental analysis.
✅ Observe market volatility.
✅ Analyze global trends.
Psychological Management :
✅ Control emotions and mindset during trading.
✅ Adhere to the trading plan.
✅ Manage emotions while trading.
✅ Set realistic expectations.
✅ Take regular mental breaks.
Mastercheck
The Mastercheck provides a digital checklist where traders can track their progress live. Users can make their own notes and view their checklist on any TradingView device, ensuring they stay informed about their trading readiness and can make adjustments in real-time. ✅
Overall, the Big 5 Checklist | XEONEDIA indicator helps minimize risks and maximize the chances of successful trades by promoting systematic and comprehensive trading preparation.
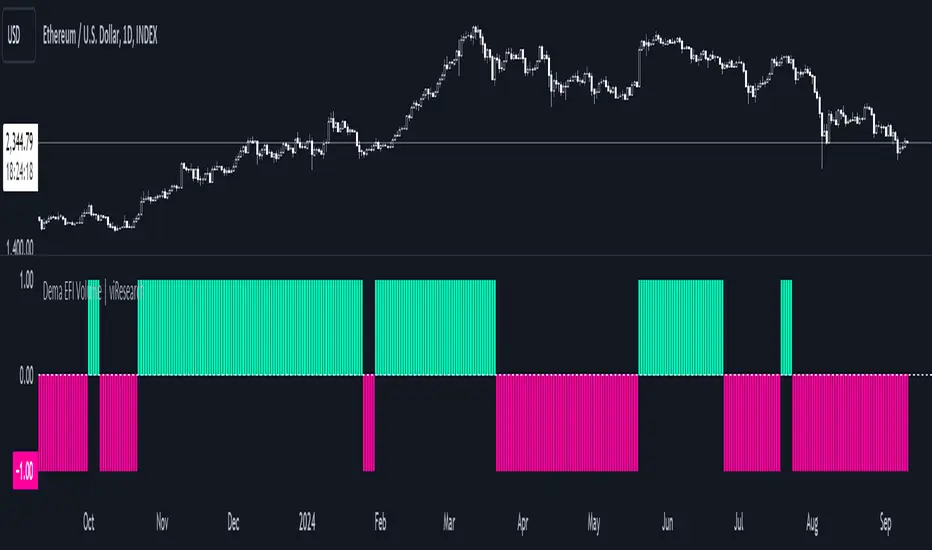
Dema EFI Volume | viResearchDema EFI Volume | viResearch
Conceptual Foundation and Innovation
The "Dema EFI Volume" indicator from viResearch integrates the Double Exponential Moving Average (DEMA) with the Elder Force Index (EFI), providing a dynamic approach to analyzing both price trends and volume strength. The DEMA is applied to smooth out price fluctuations while minimizing lag, which enhances the ability to detect trend direction. The EFI, developed by Dr. Alexander Elder, measures the power behind price movements by incorporating both price change and volume. This indicator, when combined with DEMA smoothing, gives traders a more accurate understanding of whether the current price movements are supported by significant volume, helping them make more informed trading decisions. The combination of DEMA and EFI allows traders to track trend strength while assessing the market’s volume dynamics, offering a more reliable method for identifying potential trend continuations or reversals.
Technical Composition and Calculation
The "Dema EFI Volume" script consists of two key components: the Double Exponential Moving Average (DEMA) and the Elder Force Index (EFI). The DEMA is applied to the selected source price over a user-defined length, providing a smoothed representation of price movements while reducing the noise that can occur with traditional moving averages. The EFI is calculated by multiplying the change in the DEMA by the volume over a user-defined period, which indicates whether the price movement is being driven by strong or weak volume. The script monitors the EFI values and volume data to generate trend signals. If the EFI is positive and volume increases, this indicates bullish pressure, while a negative EFI with decreasing volume suggests bearish conditions. The combination of these signals helps traders determine whether a price move is backed by sufficient volume, making it easier to identify trend continuations or potential reversals.
Features and User Inputs
The "Dema EFI Volume" script offers several customizable inputs, allowing traders to adapt the indicator to their specific strategies. The DEMA Length controls the smoothing applied to the price data, while the EFI Length defines the period over which the force index is calculated. Additionally, traders can set alert conditions for when a bullish or bearish EFI signal occurs, enabling them to react quickly to changing market conditions.
Practical Applications
The "Dema EFI Volume" indicator is designed for traders who want to combine price trend analysis with volume dynamics in a single tool. This makes it particularly effective for identifying trend continuations, as rising volume alongside a positive EFI suggests that the market move is supported by strong momentum. Conversely, decreasing volume and a negative EFI may indicate a weakening trend, giving traders early warning of potential reversals. The combination of DEMA and EFI also makes this indicator valuable for detecting trend strength by measuring whether price movements are backed by strong volume, confirming trend reversals by comparing price changes with volume activity, and improving trade entries and exits by analyzing both price and volume for more robust signals.
Advantages and Strategic Value
The "Dema EFI Volume" script offers significant advantages by combining the DEMA’s smoothing power with the EFI’s volume analysis. This integration allows traders to filter out noise in price data while ensuring that trend signals are backed by meaningful volume. The result is a more reliable tool for trend-following and reversal detection, making it easier for traders to stay aligned with strong market moves while avoiding false signals caused by low-volume fluctuations. The dual focus on price and volume makes the "Dema EFI Volume" an ideal tool for traders who value a comprehensive approach to market analysis.
Alerts and Visual Cues
The script includes alert conditions that notify traders when a significant EFI signal occurs. The "EFI Volume Long" alert is triggered when the EFI is positive and volume increases, indicating a potential upward trend. The "EFI Volume Short" alert signals a possible downward trend when the EFI turns negative and volume decreases. Visual cues, such as the color and direction of the plotted EFI line, help traders quickly identify trend shifts and make timely decisions.
Summary and Usage Tips
The "Dema EFI Volume | viResearch" indicator provides traders with a powerful tool for analyzing both price trends and volume strength. By incorporating this script into your trading strategy, you can improve your ability to detect trend continuations and reversals, making more informed decisions based on a combination of price movement and volume dynamics. Whether you are focused on identifying trend strength or looking for early reversal signals, the "Dema EFI Volume" offers a reliable and customizable solution for traders of all levels.
Note: Backtests are based on past results and are not indicative of future performance.
Sinc Bollinger BandsKaiser Windowed Sinc Bollinger Bands Indicator
The Kaiser Windowed Sinc Bollinger Bands indicator combines the advanced filtering capabilities of the Kaiser Windowed Sinc Moving Average with the volatility measurement of Bollinger Bands. This indicator represents a sophisticated approach to trend identification and volatility analysis in financial markets.
Core Components
At the heart of this indicator is the Kaiser Windowed Sinc Moving Average, which utilizes the sinc function as an ideal low-pass filter, windowed by the Kaiser function. This combination allows for precise control over the frequency response of the moving average, effectively separating trend from noise in price data.
The sinc function, representing an ideal low-pass filter, provides the foundation for the moving average calculation. By using the sinc function, analysts can independently control two critical parameters: the cutoff frequency and the number of samples used. The cutoff frequency determines which price movements are considered significant (low frequency) and which are treated as noise (high frequency). The number of samples influences the filter's accuracy and steepness, allowing for a more precise approximation of the ideal low-pass filter without altering its fundamental frequency response characteristics.
The Kaiser window is applied to the sinc function to create a practical, finite-length filter while minimizing unwanted oscillations in the frequency domain. The alpha parameter of the Kaiser window allows users to fine-tune the trade-off between the main-lobe width and side-lobe levels in the frequency response.
Bollinger Bands Implementation
Building upon the Kaiser Windowed Sinc Moving Average, this indicator adds Bollinger Bands to provide a measure of price volatility. The bands are calculated by adding and subtracting a multiple of the standard deviation from the moving average.
Advanced Centered Standard Deviation Calculation
A unique feature of this indicator is its specialized standard deviation calculation for the centered mode. This method employs the Kaiser window to create a smooth deviation that serves as an highly effective envelope, even though it's always based on past data.
The centered standard deviation calculation works as follows:
It determines the effective sample size of the Kaiser window.
The window size is then adjusted to reflect the target sample size.
The source data is offset in the calculation to allow for proper centering.
This approach results in a highly accurate and smooth volatility estimation. The centered standard deviation provides a more refined and responsive measure of price volatility compared to traditional methods, particularly useful for historical analysis and backtesting.
Operational Modes
The indicator offers two operational modes:
Non-Centered (Real-time) Mode: Uses half of the windowed sinc function and a traditional standard deviation calculation. This mode is suitable for real-time analysis and current market conditions.
Centered Mode: Utilizes the full windowed sinc function and the specialized Kaiser window-based standard deviation calculation. While this mode introduces a delay, it offers the most accurate trend and volatility identification for historical analysis.
Customizable Parameters
The Kaiser Windowed Sinc Bollinger Bands indicator provides several key parameters for customization:
Cutoff: Controls the filter's cutoff frequency, determining the divide between trends and noise.
Number of Samples: Sets the number of samples used in the FIR filter calculation, affecting the filter's accuracy and computational complexity.
Alpha: Influences the shape of the Kaiser window, allowing for fine-tuning of the filter's frequency response characteristics.
Standard Deviation Length: Determines the period over which volatility is calculated.
Multiplier: Sets the number of standard deviations used for the Bollinger Bands.
Centered Alpha: Specific to the centered mode, this parameter affects the Kaiser window used in the specialized standard deviation calculation.
Visualization Features
To enhance the analytical value of the indicator, several visualization options are included:
Gradient Coloring: Offers a range of color schemes to represent trend direction and strength for the moving average line.
Glow Effect: An optional visual enhancement for improved line visibility.
Background Fill: Highlights the area between the Bollinger Bands, aiding in volatility visualization.
Applications in Technical Analysis
The Kaiser Windowed Sinc Bollinger Bands indicator is particularly useful for:
Precise trend identification with reduced noise influence
Advanced volatility analysis, especially in the centered mode
Identifying potential overbought and oversold conditions
Recognizing periods of price consolidation and potential breakouts
Compared to traditional Bollinger Bands, this indicator offers superior frequency response characteristics in its moving average and a more refined volatility measurement, especially in centered mode. These features allow for a more nuanced analysis of price trends and volatility patterns across various market conditions and timeframes.
Conclusion
The Kaiser Windowed Sinc Bollinger Bands indicator represents a significant advancement in technical analysis tools. By combining the ideal low-pass filter characteristics of the sinc function, the practical benefits of Kaiser windowing, and an innovative approach to volatility measurement, this indicator provides traders and analysts with a sophisticated instrument for examining price trends and market volatility.
Its implementation in Pine Script contributes to the TradingView community by making advanced signal processing and statistical techniques accessible for experimentation and further development in technical analysis. This indicator serves not only as a practical tool for market analysis but also as an educational resource for those interested in the intersection of signal processing, statistics, and financial markets.
Related:
Sma Standard Deviation | viResearchSma Standard Deviation | viResearch
Conceptual Foundation and Innovation
The "Sma Standard Deviation" indicator from viResearch combines the benefits of Simple Moving Average (SMA) smoothing with Standard Deviation (SD) analysis, offering traders a powerful tool for understanding price trends and volatility. The SMA provides a straightforward approach to trend detection by calculating the average price over a defined period, while the SD component adds insight into the market's volatility by measuring the variation of prices around the SMA. This combination helps traders identify whether the price is moving within a typical range or deviating significantly, which can signal potential trend shifts or periods of increased volatility. By using both SMA and SD together, this indicator enhances the trader's ability to detect not only the trend direction but also how strongly the market is deviating from that trend, offering more informed decision-making.
Technical Composition and Calculation
The "Sma Standard Deviation" script uses two key elements: the Simple Moving Average (SMA) and Standard Deviation (SD). The SMA is calculated over a user-defined length and represents the smoothed average price over this period. The script also incorporates DEMA smoothing applied to different price sources, providing further refinement to the trend analysis. The SD is calculated by measuring the deviation of the price from the SMA over a separate user-defined length, showing how volatile the price is relative to its average. The script generates upper and lower SD boundaries by adding and subtracting the SD from the SMA, creating a volatility-adjusted range for the price. This allows traders to visualize whether the price is moving within expected bounds or breaking out of its typical range. The script monitors crossovers between the DEMA, SMA, and SD boundaries, generating trend signals based on these interactions.
Features and User Inputs
The "Sma Standard Deviation" script offers several customizable inputs, allowing traders to adjust the indicator to their specific strategies. The SMA Length controls the period for which the moving average is calculated, while the SD Length defines how long the period is for measuring price deviation. Additionally, the DEMA smoothing length can be adjusted for both the trend and standard deviation calculations, giving traders control over how responsive or smooth they want the indicator to be. The script also includes alert conditions that notify traders when trend shifts occur, either to the upside or downside.
Practical Applications
The "Sma Standard Deviation" indicator is designed for traders who want to analyze both market trends and volatility in a unified tool. The combination of the SMA and SD helps traders identify potential trend reversals, as large deviations from the SMA can indicate periods of increased volatility that precede significant price moves. This makes the indicator particularly effective for identifying trend reversals, managing volatility, and improving trend-following strategies. By analyzing when the price moves outside the volatility-adjusted range defined by the SD, traders can detect early signals of potential trend reversals. The SD component helps traders understand how volatile the market is relative to its average price, allowing for more informed decisions in both trending and volatile market conditions. The dual use of DEMA and SMA smoothing allows for a clearer trend signal, helping traders stay aligned with the prevailing market direction while managing the noise caused by short-term volatility.
Advantages and Strategic Value
The "Sma Standard Deviation" script offers significant value by integrating both trend detection and volatility analysis into a single tool. The use of SMA for smoothing price trends, combined with the SD for assessing price volatility, provides a more comprehensive view of the market. This dual approach helps traders filter out false signals caused by short-term fluctuations while identifying potential trend changes driven by increased volatility. This makes the "Sma Standard Deviation" indicator ideal for traders seeking a balance between trend-following and volatility management.
Alerts and Visual Cues
The script includes alert conditions that notify traders when significant trend shifts occur based on price crossovers with the SMA and SD boundaries. The "Sma Standard Deviation Long" alert is triggered when the price crosses above the upper volatility boundary, indicating a potential upward trend. Conversely, the "Sma Standard Deviation Short" alert signals a possible downward trend when the price crosses below the lower boundary. Visual cues, such as changes in the color of the SMA line, help traders quickly identify trend shifts and act accordingly.
Summary and Usage Tips
The "Sma Standard Deviation | viResearch" indicator provides traders with a robust tool for analyzing market trends and volatility. By combining the benefits of SMA smoothing with SD analysis, this script offers a comprehensive approach to detecting trend changes and managing risk. Incorporating this indicator into your trading strategy can help improve your ability to spot trend reversals, understand market volatility, and stay aligned with the broader market direction. The "Sma Standard Deviation" is a reliable and customizable solution for traders looking to enhance their technical analysis in both trending and volatile markets.
Note: Backtests are based on past results and are not indicative of future performance.

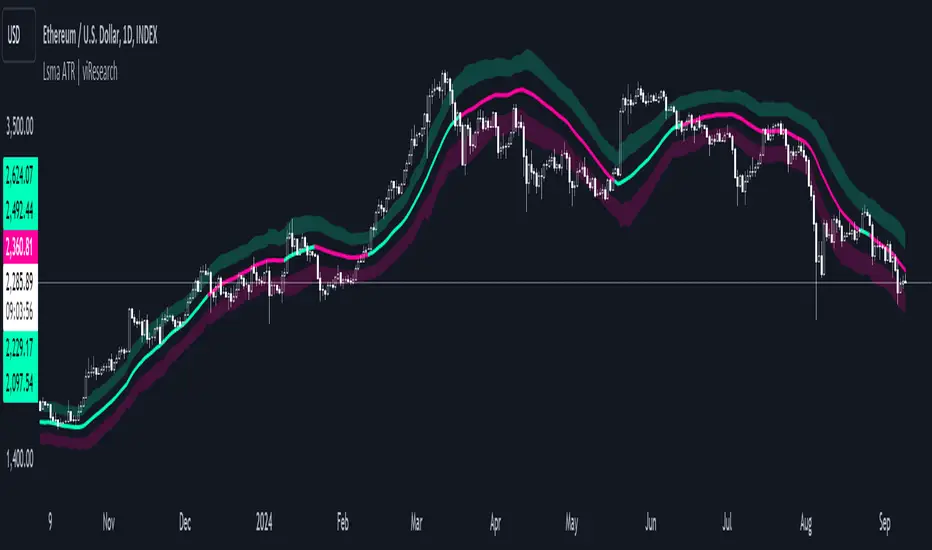
Lsma ATR | viResearchLsma ATR | viResearch
Conceptual Foundation and Innovation
The "Lsma ATR" indicator from viResearch combines the power of the Least Squares Moving Average (LSMA) with the Average True Range (ATR) to offer traders a dynamic approach to trend analysis and volatility management. The LSMA is highly regarded for its ability to fit a linear regression line to price data, providing a smooth and precise trend line with minimal lag. When paired with the ATR, which measures market volatility, this indicator not only tracks trend direction but also adapts to changes in volatility. The integration of both elements allows traders to identify potential trend reversals and assess the strength of trends in the context of market volatility. This combination makes the "Lsma ATR" a versatile tool for following trends while managing risk, as it responds quickly to changes in price direction while accounting for shifts in market volatility.
Technical Composition and Calculation
The "Lsma ATR" script consists of two primary components: the Least Squares Moving Average (LSMA) and the Average True Range (ATR). The LSMA is calculated over a user-defined length, providing a smoothed representation of the market trend based on linear regression. The ATR, also user-defined, is used to measure market volatility by calculating the average range between high and low prices over a specified period. By adding and subtracting the ATR from the LSMA, the indicator creates upper and lower boundaries that help define the market's current volatility-adjusted range. The script monitors for price crossovers with these boundaries to generate trend signals. When the price crosses above the upper boundary, it signals a potential upward trend. Conversely, when the price crosses below the lower boundary, it signals a possible downward trend. These boundaries dynamically adjust based on volatility, providing more accurate signals as market conditions change.
Features and User Inputs
The "Lsma ATR" script offers several customizable inputs, allowing traders to fine-tune the indicator to their trading preferences. The LSMA Length controls the lookback period for the LSMA, determining how smooth or responsive the trend line is. The ATR Length defines the period used for calculating the average volatility, affecting the width of the volatility-adjusted range. Additionally, the indicator includes alert conditions that notify traders when a trend shift occurs, either to the upside or downside.
Practical Applications
The "Lsma ATR" indicator is designed for traders who want to follow market trends while accounting for changes in volatility. The LSMA provides a clear, smoothed trend line that helps identify the direction of the market, while the ATR adjusts the boundaries based on the current volatility level. This combination makes the indicator particularly effective for detecting trend reversals, as the LSMA tracks the overall trend direction and price crossovers with the ATR boundaries provide early signals of potential trend changes. It also helps manage risk by understanding market volatility, allowing traders to adjust their strategies based on the strength of price movements. The indicator improves trend-following strategies by combining LSMA’s trend detection with ATR’s volatility adjustment, offering a nuanced approach in various market conditions.
Advantages and Strategic Value
The "Lsma ATR" script offers significant value by integrating the precision of the LSMA with the adaptability of the ATR. This dual approach allows traders to reduce noise in price data while responding to changes in volatility, leading to more accurate trend signals. The volatility-adjusted boundaries provide a dynamic range that helps traders avoid false signals and stay aligned with stronger trends. This makes the "Lsma ATR" an ideal tool for traders seeking to enhance their trend-following strategies while accounting for market volatility.
Alerts and Visual Cues
The script includes alert conditions that notify traders when the price crosses the ATR boundaries, signaling a potential trend change. The "Lsma ATR Long" alert is triggered when the price crosses above the upper boundary, indicating a potential upward trend, while the "Lsma ATR Short" alert signals a possible downward trend when the price crosses below the lower boundary. Visual cues, such as changes in the color of the LSMA line and shaded areas between the ATR boundaries, help traders quickly identify these trend shifts.
Summary and Usage Tips
The "Lsma ATR | viResearch" indicator combines the smoothing benefits of the LSMA with the volatility sensitivity of the ATR, providing traders with a robust tool for trend detection and volatility management. By incorporating this script into your trading strategy, you can improve your ability to detect trend reversals, confirm trend direction, and manage risk by adjusting to market volatility. The "Lsma ATR" offers a reliable and customizable solution for traders looking to enhance their technical analysis in both trending and volatile market environments.
Note: Backtests are based on past results and are not indicative of future performance.