Last Available Bar InfoLibrary "Last_Available_Bar_Info"
getLastBarTimeStamp()
getAvailableBars()
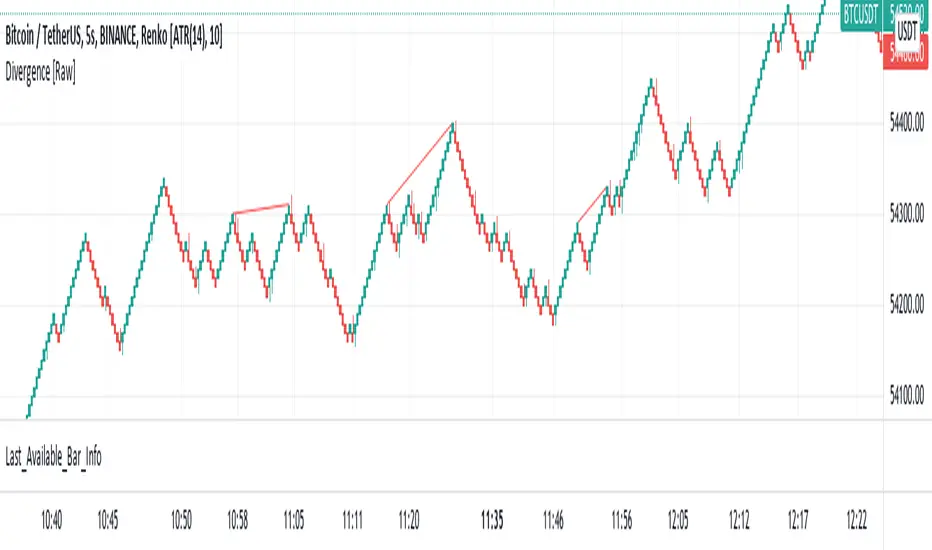
This simple library is built with an aim of getting the last available bar information for the chart. This returns a constant value that doesn't change on bar change.
For backtesting with accurate results on non standard charts, it will be helpful. (Especially if you are using non standard charts like Renko Chart).
Methods
getLastBarTimeStamp()
: Returns Timestamp of the last available bar (Constant)
getAvailableBars()
:Returns Number of Available Bars on the chart (Constant)
Example
import paragjyoti2012/Last_Available_Bar_Info/v1 as LastBarInfo
last_bar_timestamp=LastBarInfo.getLastBarTimeStamp()
no_of_bars=LastBarInfo.getAvailableBars()
If you are using Renko Charts, for backtesting, it's necesary to filter out the historical bars that are not of this timeframe.
In Renko charts, once the available bars of the current timeframe (based on your Tradingview active plan) are exhausted,
previous bars are filled in with historical bars of higher timeframe. Which is detrimental for backtesting, and it leads to unrealistic results.
To get the actual number of bars available of that timeframe, you should use this security function to get the timestamp for the last (real) bar available.
tf=timeframe.period
real_available_bars = request.security(syminfo.ticker, tf , LastBarInfo.getAvailableBars() , lookahead = barmerge.lookahead_off)
last_available_bar_timestamp = request.security(syminfo.ticker, tf , LastBarInfo.getLastBarTimeStamp() , lookahead = barmerge.lookahead_off)
在脚本中搜索"bar"
3-Bar and 4-Bar PlaysThis indicator helps identify 3-bar and 4-bar plays, which are price action patterns consisting of a wide ranging bar that breaks above or below resistance or support, followed by one or two collecting/consolidating bars, then a continuation bar in the direction of the new trend. The 3 and 4-bar play is taught by Jared Wesley and Anmol Singh at Live Traders.
The indicator works by looking for a wide ranging bar breaking out of an offset donchian channel, followed by one or two consolidating bars, then a continuation in the direction of the move. The script will place a label on the chart when it spots the pattern and alerts can be set up. Enjoy!

Bar TimeBar Time is a simple utility for traders who rely on backtesting, Bar Replay, and detailed price action analysis. It solves a common but frustrating problem: knowing the exact time of the bar you are looking at.
While most time indicators show your computer's live clock time, this tool displays the bar's own timestamp, perfectly synchronized with your chart's data and timezone.
Why Is This Important?
When you are deep in a Bar Replay session or analyzing a historical setup, the live clock is irrelevant. You need to know when that critical breakout or reversal candle actually happened. Was it during the pre-market? At the London open? In the last five minutes of the US session? This indicator provides that vital context instantly, without you needing to squint at the small print on the x-axis.
Key Use Cases
1. Mastering Bar Replay
As you click through bars in Replay mode, the displayed time updates with each new bar. This allows you to simulate a live trading session with full awareness of the time of day, helping you train your decision-making under more realistic conditions.
2. Analyzing Screener Signals
This is one of the most powerful uses. Imagine your screener finds a "BUY" signal on a stock from two bars ago. You switch to that stock's chart to investigate. Instead of hunting for the exact bar, this tool instantly shows you the date and time of the bar you are currently hovering over. It dramatically speeds up the workflow of moving from a screener alert to actionable analysis.
3. Detailed Price Action Study
Quickly identify key session timings, see how price reacts to news events at a specific time, or analyze intraday volume patterns with complete temporal clarity.
Features & Customization
The tool is designed to be lightweight, efficient, and fully customizable to match your charting environment.
Timezone-Aware Accuracy: Automatically detects your chart's timezone for a perfect match between the label and the x-axis.
Fully Customizable Position: Place the time display in any of nine screen positions (e.g., Top Left, Bottom Center) using a simple dropdown menu.
Custom Colors: Easily set the background and text colors to blend seamlessly with your chart's theme.
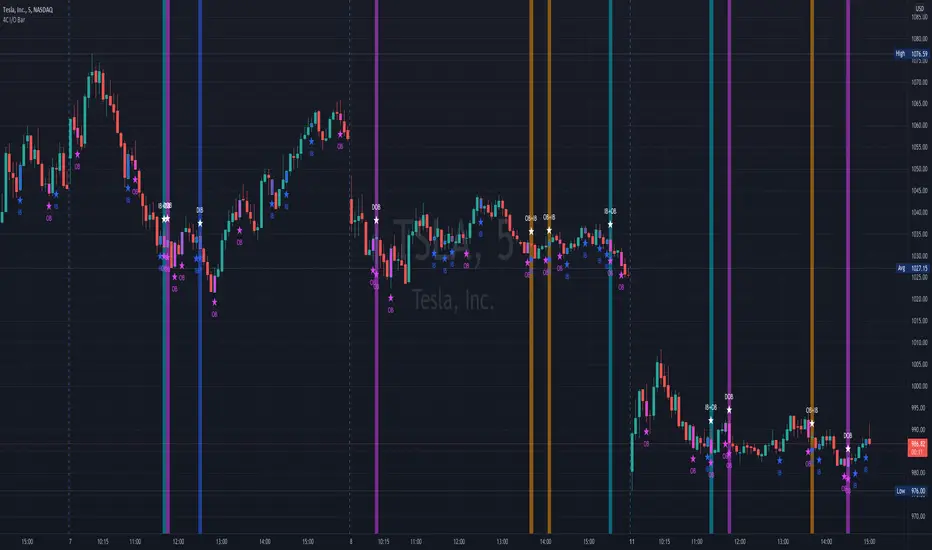
Bill Williams Divergent BarsBill William Bull/Bear divergent bars
See: Book, Trading Chaos by Bill Williams
Coded by polyclick
A bullish (green) divergent bar, signals a trend switch from bear -> bull
-> The current bar has a lower low than the previous bar, but closes in the upper half of the candle.
-> This means the bulls are pushing from below and are trying to take over, potentially resulting in a trend switch to bullish.
-> We also check if this bar is below the three alligator lines to avoid false positives.
A bearish (red) divergent bar, signals a trend switch from bull -> bear
-> The current bar has a higher high than the previous bar, but closes in the lower half of the candle.
-> This means the bears are pushing the price down and are taking over, potentially resulting in a trend switch to bearish.
-> We also check if this bar is above the three alligator lines to avoid false positives.
Best used in combination with the Bill Williams Alligator indicator.

StO Price Action - Daily Outside BarShort Summary
- Outside Bar indicator with multiple range calculation algorithms
- Highlights where the current range fully engulfs the previous
- Works with Daily candles in Daily, H4, and H1 timeframes only
- Highlights the current bar when it engulfs the previous bar according to the selected method
Full Description
Overview
- Identifies bars where the current period's range fully engulfs the prior period's range
- Offers three algorithms for defining the engulfing range:
- High/Low: uses absolute high and low values
- Open/Close: considers candle direction (bull/bear) and compares opens and closes
- Open/Close II: stricter version with exclusive inequalities for engulfing
- Engulfing behavior is detected automatically and highlighted for easy recognition
- Works on multiple markets but restricted to D, H4, and H1 charts for accuracy
Controls
- Year lookback (YLB) configurable to filter older bars
- Custom background color for highlighting Outside Bars
- Simple toggle interface with minimal chart clutter
Visual Representation
- Highlights engulfing bars with configurable background color
- Color transparency adjustable for clarity
Usage
- Use to identify strong market momentum or potential reversals
- Helps spot high-probability setups based on engulfing price action
Notes
- Only compatible with Daily, H4, and H1 timeframes
- Non-repainting: once an Outside Bar is drawn, it will not adjust retroactively
- Best used as a market structure reference not a direct trade signal

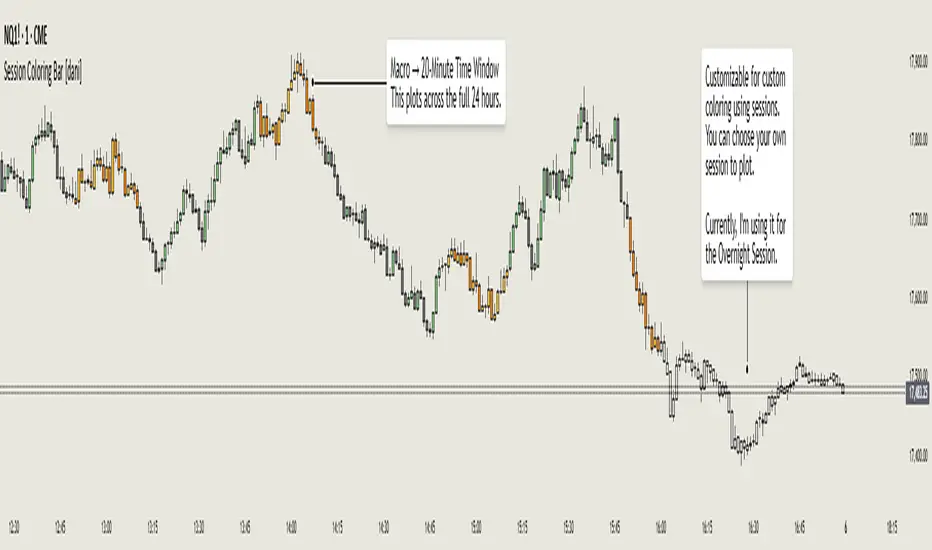
Session Coloring Bar with ICT Macro [dani]The Session Coloring Bar is customizable Pine Script indicator designed to visually enhance your charts by applying unique colors to specific trading sessions or timeframes. This tool allows traders to easily identify and differentiate between macro sessions (e.g., 24-hour cycles) and custom-defined sessions (e.g., Session A, Session B), making it ideal for analyzing market activity during specific periods.
In the context of trading, the term "ICT Macro" , as discussed by Michael J. Huddleston (ICT), refers to specific timeframes or "windows" where market behavior often follows predictable patterns. Traders typically focus on the last 10 minutes of an hour and the first 10 minutes of the next hour (e.g., 0150-0210 , 0050-0110 , or 0950-1010 ) to identify key price movements, liquidity shifts, or market inefficiencies.
This script highlights these macro timeframes, enabling traders to visually analyze price action during these critical periods. Use this tool to support your strategy, but always combine it with your own analysis and risk management.
With this indicator, you can:
Highlight Macro Sessions : Automatically color bars based on predefined 24-hour macro sessions.
Customize Session Settings : Define up to three custom sessions (A & B) with individual start/end times, visibility toggles, and unique bar colors.
Timeframe Filtering : Hide session coloring above a specified timeframe to avoid clutter on higher timeframes.
Personal Notes : Add comments to each session for better organization and quick reference.
Dynamic Color Logic : Bars are colored based on their direction (up, down, or neutral) within the active session.
How to Use:
Enable/Disable Sessions :
Use the Show Coloring toggle to enable or disable session coloring for Macro, Session A, Session B, or Session C.
Set Session Times :
Define the start and end times for each session in the format HHMM-HHMM (e.g., 1600-0930 for an overnight session).
Choose Colors :
Assign unique colors for upward (Bar Up) and downward (Bar Down) bars within each session.
Adjust Timeframe Visibility :
Use the Hide above this TF input to specify the maximum timeframe where session coloring will be visible.
Add Notes :
Use the Comment field to add personal notes or labels for each session.
Example Use Cases:
Overnight Sessions :
Highlight overnight trading hours (e.g., 1600-0930) to analyze price action during low liquidity periods.
Asian/European/US Sessions : Define separate sessions for major trading regions to track regional market behavior.
Macro Analysis : Use the predefined 24-hour macro sessions to study hourly price movements across a full trading day.
Disclaimer:
The Session Coloring Bar is not a trading signal generator and does not predict market direction or provide buy/sell signals. Instead, it is a visualization tool designed to help you identify and analyze specific trading sessions or timeframes on your chart. By highlighting key sessions and their corresponding price movements, this indicator enables you to focus on periods of interest and make more informed trading decisions.
Thank you for choosing this indicator! I hope it becomes a valuable part of your trading toolkit. Remember, trading is a journey, and having the right tools can make all the difference. Whether you're a seasoned trader or just starting out, this indicator is designed to help you stay organized and focused on what matters most—price action. Happy trading, and may your charts be ever in your favor! 😊
Lost Bar Locator v1 [Yaphott]Lost Bar Locator v1 helps you locate missing data on your chart.
It does this by looking for consecutive bars that have a delta time greater than the current interval.
Two lines are drawn for each group of one or more missing bars:
Bar before the missing bar(s).
Bar after the missing bar(s).

Bar Statistics - DELTA/OI/TOTAL/BUY/SELL/LONGS/SHORTSBar Statistics - Advanced Volume & Open Interest Analysis
Overview
The Bar Statistics indicator is a comprehensive analytical tool designed to provide traders with detailed insights into market microstructure through advanced volume analysis, open interest tracking, and market flow detection. This indicator transforms complex market data into easily digestible visual information, displaying six key metrics in customizable colored boxes that update in real-time.
Unlike traditional volume indicators that only show basic volume data, this indicator combines multiple data sources to reveal the underlying forces driving price movement, including volume delta calculations from lower timeframes, open interest changes, and estimated market positioning.
What Makes This Indicator Unique
1. Multi-Timeframe Volume Delta Precision
The indicator utilizes lower timeframe data (default 1-second) to calculate highly accurate volume delta measurements, providing much more precise buy/sell pressure analysis than standard timeframe-based calculations. This approach captures intraday volume dynamics that are often missed by conventional indicators.
2. Real-Time Updates
Unlike many indicators that only update on bar completion, this tool provides live updates for the developing candle, allowing traders to see evolving market conditions as they happen.
3. Market Flow Analysis
The unique "L/S" (Long/Short) metric combines open interest changes with price/volume direction to estimate net market positioning, helping identify when participants are accumulating or distributing positions.
4. Adaptive Visual Intensity
The gradient color system automatically adjusts based on historical context, making it easy to identify when current values are significant relative to recent market activity.
5. Complete Customization
Every aspect of the display can be customized, from the order of metrics to individual color schemes, allowing traders to adapt the tool to their specific analysis needs.
6.All In One Solution
6 Metrics in one indicator no more using 5 different indicators.
Core Features Explained
DELTA (Volume Delta)
What it shows: Net difference between aggressive buy volume and aggressive sell volume
Calculation: Uses lower timeframe data to determine whether each trade was initiated by buyers or sellers
Interpretation:
Positive values indicate aggressive buying pressure
Negative values indicate aggressive selling pressure
Magnitude indicates the strength of directional pressure
OI Δ (Open Interest Change)
What it shows: Change in open interest from the previous bar
Data source: Fetches open interest data using the "_OI" symbol suffix
Interpretation:
Positive values indicate new positions entering the market
Negative values indicate positions being closed
Combined with price direction, reveals market participant behavior
L/S (Net Long/Short Bias)
What it shows: Estimated net change in long vs short market positions
Calculation method: Combines open interest changes with price/volume direction using configurable logic
Scenarios analyzed:
New Longs: Rising OI + Rising Price/Volume = Long position accumulation
Liquidated Longs: Falling OI + Falling Price/Volume = Long position exits
New Shorts: Rising OI + Falling Price/Volume = Short position accumulation
Covered Shorts: Falling OI + Rising Price/Volume = Short position exits
Result: Net bias toward long (positive) or short (negative) market sentiment
TOTAL (Total Volume)
What it shows: Standard volume for the current bar
Purpose: Provides context for other metrics and baseline activity measurement
Enhanced display: Uses gradient intensity based on recent volume history
BUY (Estimated Buy Volume)
What it shows: Estimated aggressive buy volume
Calculation: (Total Volume + Delta) / 2
Use case: Helps quantify the actual buying pressure in monetary/contract terms
SELL (Estimated Sell Volume)
What it shows: Estimated aggressive sell volume
Calculation: (Total Volume - Delta) / 2
Use case: Helps quantify the actual selling pressure in monetary/contract terms
Configuration Options
Timeframe Settings
Custom Timeframe Toggle: Enable/disable custom lower timeframe selection
Timeframe Selection: Choose the precision level for volume delta calculations
Auto-Selection Logic: Automatically selects optimal timeframe based on chart timeframe
Net Positions Calculation
Direction Method: Choose between Price-based or Volume Delta-based direction determination
Value Method: Select between Open Interest Change or Volume for position size calculations
Display Customization
Row Order: Completely customize which metrics appear and in what order (6 positions available)
Color Schemes: Individual color selection for positive/negative values of each metric
Gradient Intensity: Configurable lookback period (10-200 bars) for relative intensity calculations
Visual Elements
Box Format: Clean, professional box display with clear labels
Color Coding: Intuitive color schemes with customizable transparency gradients
Real-time Updates: Live updating for developing candles with historical stability
How to Use This Indicator
For Day Traders
Volume Confirmation: Use DELTA to confirm breakout validity - strong directional moves should show corresponding volume delta
Entry Timing: Watch for volume delta divergences at key levels to time entries
Exit Signals: Monitor when aggressive volume shifts against your position
For Swing Traders
Market Flow: Focus on the L/S metric to identify when participants are accumulating or distributing
Open Interest Analysis: Use OI Δ to confirm whether moves are backed by new money or position adjustments
Trend Validation: Combine multiple metrics to validate trend strength and sustainability
For Scalpers
Real-time Edge: Utilize the live updates to see developing imbalances before bar completion
Quick Decision Making: Focus on DELTA and BUY/SELL for immediate market pressure assessment
Volume Profile: Use TOTAL volume context for optimal entry/exit sizing
Setup Recommendations
Futures Markets: Enable OI tracking and use Volume Delta direction method
Crypto Markets: Focus on DELTA and volume metrics; OI may not be available
Stock Markets: Use Price direction method with volume value calculations
High-Frequency Analysis: Set lower timeframe to 1S for maximum precision
Technical Implementation
Data Accuracy
Utilizes TradingView's ta.requestVolumeDelta() function for precise buy/sell classification
Implements error checking for data availability
Handles missing data gracefully with fallback calculations
Performance Optimization
Efficient array management with configurable lookback periods
Smart box creation and deletion to prevent memory issues
Optimized real-time updates without historical data corruption
Compatibility
Works on all timeframes from seconds to daily
Compatible with futures, forex, crypto, and stock markets
Automatically adjusts calculation methods based on available data
Risk Disclaimers
This indicator is designed for educational and analytical purposes. It provides statistical analysis of market data but does not guarantee trading success. Users should:
Combine with other forms of analysis
Practice proper risk management
Understand that past performance doesn't predict future results
Be aware that volume delta and open interest data quality varies by market and data provider
Conclusion
The Bar Statistics indicator represents a significant advancement in retail trader access to professional-grade market analysis tools. By combining multiple data sources into a single, customizable display, it provides the depth of analysis needed for comprehensive market microstructure understanding while maintaining the simplicity required for effective decision-making.

Bar Painting [iFarsheed]
Bar Painting
Overview:
The "Bar Painting " indicator is designed for traders who follow price action strategies inspired by Al Brooks.
This tool colors candles on your chart, making it easy to identify different candle types like trend bars, dojis, and pin bars without complex calculations. By simply observing the colors, you can quickly understand market dynamics.
Features:
Candle Coloring:
Bullish (up) and bearish (down) trend bars are highlighted in distinct colors for easy recognition.
Candles that do not fit these patterns appear in the default chart color, indicating they do not represent significant moves.
Visual Clarity:
The color coding provides a quick visual reference, allowing you to grasp market conditions at a glance.
No Calculations Required:
You don’t need to perform any calculations; just look at the colors to understand the strength of the market.
How to Use:
Customize Settings:
Adjust the colors of trend bars to ensure they contrast well with your chart background for improved visibility.
Use the settings to choose which candle types you want to highlight based on your trading preferences.
Analyze Candle Patterns:
Look at the colored candles to quickly identify trend bars, dojis, and pin bars that may signal potential market movements.
Informed Decision Making:
Use the highlighted candle patterns to assist in making trading decisions, such as identifying possible entry and exit points.
Important Note:
This coloring scheme is optimized for light mode charts. In dark mode, the colors may not display correctly.
To ensure proper color display, please set the visual order of the indicator to "Bring to Front."
Future Updates:
This indicator is an initial version, and more features will be added in the future.
If you have any suggestions or feedback, please feel free to share your thoughts in the comments section of the indicator.
Good luck with your trading!
-iFarsheed-

Bars Above/Below Donchian Channel [ScalpTradr]"Bars Above/Below Donchian Channel" provides a visualization of the Donchian Channel and measures the number of bars above and below the middle line of the channel.
The Donchian Channel is a trading indicator that outlines the highest high and the lowest low over a defined number of periods, in this case set by the variable "length". This indicator script specifically also calculates the 'basis', which is the average of the upper and lower channels of the Donchian Channel.
When the closing price of a bar is above the 'basis', the script increases a counter for "aboveCount" and adds a label on the chart to show how many bars have closed above the 'basis'. This label is green and it's always placed at the high price of the bar. Conversely, when the closing price is below the 'basis', it increases a counter for "belowCount" and adds a red label on the chart to show how many bars have closed below the 'basis'. This label is placed at the lower_channel level.
This script can be useful for traders who use the Donchian Channel as a part of their trading strategy. The number of bars closing above or below the 'basis' can provide insights into the ongoing trend. A higher count of bars closing above the 'basis' can be interpreted as a bullish signal, suggesting an upward trend. Similarly, a higher count of bars closing below the 'basis' can be interpreted as a bearish signal, suggesting a downward trend
I hope you find this indicator useful.
Enjoy.

Abnormal bar % v.1This script helps you find abnormal bars on the charts.
An abnormal bar is a bar that is larger than the adjacent bar by at least 50 percent.
The script can search for bars on any time frame.
The search for an abnormal bar, is possible in two ways:
- on the absolute value, for example - all that is higher than 0.5% is considered an abnormal bar, on different timeframes it is necessary to change the percentage values;
- on the basis of the ATR, in my opinion it is a more objective result.
In the settings available:
- choice of color to display percentages on the screen;
- choice of calculation method;
- Selecting the value - what is considered an abnormal bar.
======
Данный скрипт помогает найти на графиках аномальные бары.
Аномальный бар - это бар который, больше рядом стоящего бара как минимум на 50 процентов.
Скрипт может искать бары на любом тайм-фрейма.
Поиск аномального бара, возможен в двух вариантах:
- по абсолютному значению, например - всё что выше 0.5%, считается аномальным баром, на разных тайм-фреймах нужно менять значения процентов;
- на основание ATR, на мой взгляд это более объективный результат.
В настройках доступно:
- выбор цвета для отображения процентов на экране;
- выбор способа поиска;
- выбор значения - что считаем аномальным баром.
==

HG Scalpius - Previous Bar HighlightHG Scalpius - Previous Bar Highlight
This indicator highlights the 20th bar from the current bar and has the below applications for trading the HG Scalpius system:
- Determining if trend mode off switch is triggered, failing to set a new higher (lower) close in the trend with 20 bars
- Determining the highest (lowest) bar in the previous range to decide if a trade is high & tight
bars_back = input(defval=20, minval=0, title="Bars Back")
bgcolor(#9C27B0, offset=-bars_back, show_last=1)
If you come across or think of any other useful scripts for the HG Scalpius system please comment below!
Happy trading!

shadow barThis indicator shows a new formation of retrospective candlestick bars of one period (n) of time.
In this way the trader can see how the traditional bars are part of a larger formation that can show a trend or a range.
The new shadow bars are drawn with a degree of transparency that makes it possible to distinguish traditional candlesticks;
and where shadow candles can be seen as support or resistance to traditional candlesticks.
When the traditional candlesticks are the same size as the shadow candlesticks, it can be expected that we are forming a compression or range that will result in a strong move.
In addition to the shadow bars, there is a ribbon created from the new candlestick data that is formed as a line from the linear regression function and another that is the previous line smoothed by its exponential moving average. This tape allows you to see the trend more clearly and at the crossovers of the lines that form possible reversals or continuations of the trend. The indicator has the timeframe field active, which allows the indicator to be displayed in other temporalities.
*The closing price of the new bars is the same as that of the traditional bars.
* The tape is turned off by defa

Chonky ATR Bars - Colored1. Compares visible bars to specified ATR inputs.
2. Colors bars if the bar is less than or greater than the specified ATR multiples.
Ex: if the bar has a range of 1/2 half the Daily ATR or less, color blue. if the bar has a range of triple the 4h ATR or greater, color orange.
_______________________________________________
DM me interesting ideas, filters, knowledge, etc. to gain access.
Teach me something idgaf.

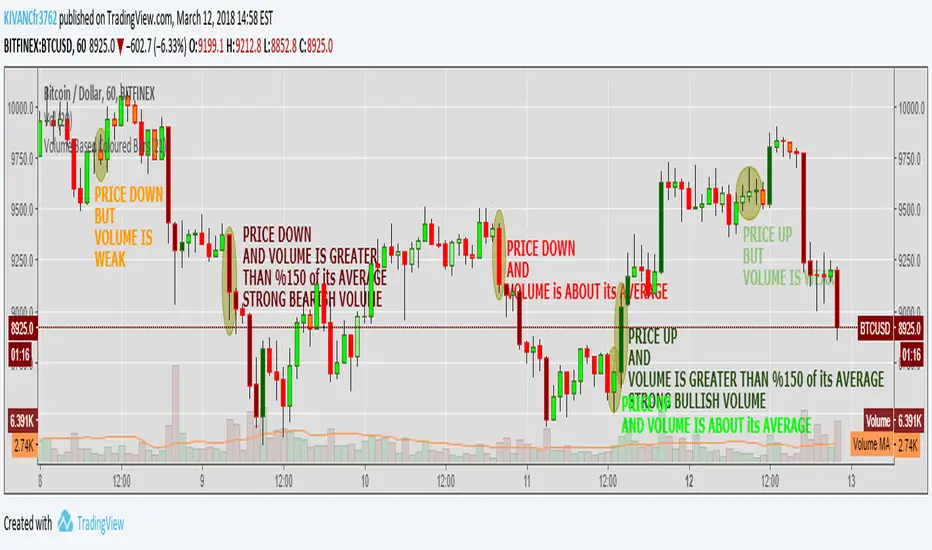
Volume Based Coloured BarsVolume Based Coloured Bars:
Most of the time traders are confused about if the price movements were supported by VOLUME .
This indicator colors the bars into volume weighted signals...
When prices go down bars are red and contraversely when up, bars are green. Additionally we have two more colors for each
situation:
PRICE BARS ARE:
DARK RED when prices go down and VOLUME is bigger than 150% of its (default 21 day) average, that indicates us price action is supported by a strong BEARISH VOLUME
RED when prices go down and VOLUME is BETWEEN 50% AND 150% of its (default 21 day) average, at this situation we can think that volume is neither strong nor weak
ORANGE when prices go down and VOLUME is just less than 50% of its (default 21 day) average, so the volume is weak and doesn't support the price action much
DARK GREEN when prices go UP and VOLUME bigger than 150% of its (default 21 day) average, that indicates us price action is supported by a strong BULLISH VOLUME
GREEN when prices go UP and VOLUME is BETWEEN 50% AND 150% of its (default 21 day) average, at this situation we can think that volume is neither strong nor weak
LIGHT GREEN when prices go UP and VOLUME is just less than 50% of its (default 21 day) average, so the volume is weak and doesn't support the price action much
21 day Simple Moving Average used as default value which can be changed in the settings menu,
21 day is considered as a month for STOCK Markets, it would be more accurate to set the value to 30 for CRYPTO CURRENCIES
Whale Momentum BarsWhale Momentum Bars is a custom Visual Range Volume Profile (VRVP) for the last N bars that shows total volume only (no POC/VA/VAL). It builds a 55-row volume-by-price histogram (fully adjustable) using a more accurate method: each candle’s volume is distributed across price bins based on the candle’s high/low overlap.
The key idea is filtering: every row’s bar width is normalized to the highest-volume bin in the range. Only bins that reach a user-defined threshold (e.g. 33% or 50% of the max bin) are drawn. Low-volume areas vanish, high-volume nodes stay, and gaps are preserved—so the heavy-volume “whale zones” pop instantly.
You can draw the profile inside the selected range, choose left or right, control the max width (in bars) and offset, and customize color, transparency, and borders.
Optional labels mark the price levels of the top N local peaks (true volume nodes), so you see the most important high-volume levels without labeling adjacent “peak neighbor” bins.

Brooks 18 Bars [KintsugiTrading]Brooks 18 Bars
Overview:
This indicator allows traders to specify a time frame within each trading day and plots lines at the highest and lowest prices recorded during that period. It is particularly useful for identifying key levels of support and resistance within a specified time range.
Features:
User-Defined Time Frame: Traders can input their desired start and end times in a 24-hour format, allowing flexibility to analyze different market sessions.
High and Low Price Levels: The indicator plots lines representing the highest and lowest prices observed within the specified time frame each day.
Clear Visual Representation: The high and low lines are color-coded for easy identification, with the high & low prices in Kintsugi Trading Gold.
How to Use:
Set the Time Frame:
Adjust the "Start Time Hour" and "Start Time Minute" to define the beginning of your desired time frame.
Adjust the "End Time Hour" and "End Time Minute" to define the end of your desired time frame.
Analyze Key Levels:
Al Brooks popularized the following idea and basis for creating this indicator:
On a 5-minute chart, Bar 1 has a 20-30% chance of being the High or Low of the day.
Bar 12 has a 50% chance.
Bar 18 has an 80-90% chance.
Use the plotted lines to identify significant support and resistance levels within your specified time frame. These levels can help inform your trading decisions, such as entry and exit points.
Good luck with your trading!

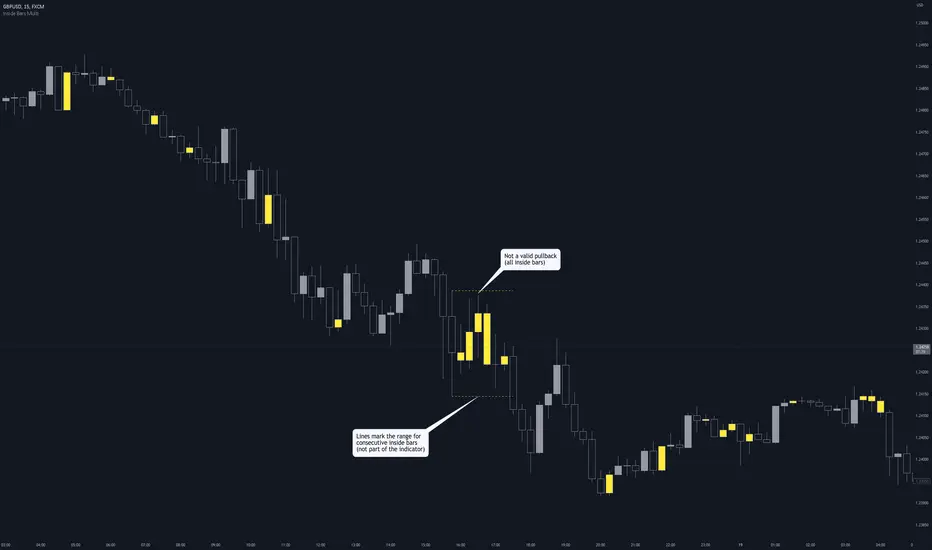
Inside Bars (Multiple / Consecutive)Description
When an inside bar is found, the indicator remembers the high and low (= range) of the candle before the inside bar.
As long as price moves within the range, every bar is highlighted as an inside bar to the range.
Purpose
The indicator can assist when identifying valid pullbacks and buy-side liquidity (BSL) / sell-side liquidity (SSL).
Volume BarsVolume Sato's Bar / Satos Bar / Raio X Preditivo
This is an experimental code based on Satos Bar by Raio X Preditivo
It's a way to check expressive volume in one bar, and it's can give you an idea of a important Zones to make decisions.
Example:

Backward Number of BarsThis indicator was written in order to apply bar limit in strategies and it was published as open code so that everyone can use it. When backtesting with stock market api data, we determine how many bars should be, not from which date the data will be drawn. For example, we can draw 1000 bar data from stock exchange and perform the backtest on this data. You can plan your strategy by checking the number of bars you test with the window () == 1 parameter here while checking through Tradingview to check that the test we performed gives correct results.

Median Speed BarThe "Median Speed Bar" is a custom trading indicator designed to classify market candlesticks based on their volatility relative to historical price ranges. It calculates two median price ranges: a short-term median using a customizable period and a long-term median over a much larger timeframe. These medians are based on either the difference between the opening and closing prices or the high and low prices of the candlesticks, depending on user input. The percentage ratio of the short-term median to the long-term median is used to categorize the current candlestick into one of four types: EXTREME, FAST, NORMAL, or SLOW. Each category is linked to customizable thresholds, which are set by the user as percentages.
The script then displays the classification of the current bar in a table at the bottom right corner of the chart, offering an easily readable overview of current market conditions. If the bar's percentage exceeds the extreme threshold, it's classified as "EXTREME" and highlighted in red. Other categories—FAST, NORMAL, and SLOW—are visually distinguished by different colors (orange, green, and blue, respectively). This allows traders to quickly assess volatility and make informed decisions based on how the current price action compares to historical medians.

4C Inside/Outside BarThis indicator colors the candle body based on whether it closed as an Inside Bar (IB) or an Outside Bar (OB).
Inside and outside bars can be powerful triggers to enter or exit trades from, when price breaks above or below the candle.
The coloring of only the body and not the border of the candle makes it possible to still know whether the candle was bullish/bearish.
This indicator has the unique ability to add/hide labels for each IB and OB.
Small labels are printed on the chart directly below the candle. (See below)
It also has the unique ability to paint the chart background when an IB forms directly after an OB.
This is a special combination of the two, and can also be a powerful signal.
This feature can be turned on/off. (See below)
Thanks to Craig Stine, as some parts of this indicator were adapted from Custom Candle color Inside/Outside candles, Highwave, Star Patt. by Craig_Stine
Percentage Or Point Bar CalculatorHello Everyone This Indicator Base on Bar (Candle)
How to work its indicator?
➤This indicator calculating Every Bar Percentage Or Point with any Time Frame For eg: if you want to 50 Percentage above or below bar
Indicator Feature
➤ Long Signal with Alert
➤ Short Signal with Alert
➤ You can add Custom Point
➤ You can add Custom Percentage
Coming soon Feature
Take Profit
Stop Lose
Trailing Stoplose
Important: This Indicator we are using for Automation Trading if You Want This Indicator Access, Please Contact me PM on Tradingview
