Session Breakout/Sweep with alertsThis indicator is based on popular London breakout strategy. but as I noticed that it don't work good with breakouts so I made it to be used as reversal entries as well. By default the timing is set for asian session but you can change it according to your need.
Use as breakout
Use as liquidity sweep
Note:
On some pairs the timing changes automatically (I don't know why), if you face this issue , go to settings and set the timing accordingly and save it as templet so that you don't have to change it every time you load the chart with timing issue.
I hope you guys find it useful. Do share your though and feedback in comments.
在脚本中搜索"breakout"

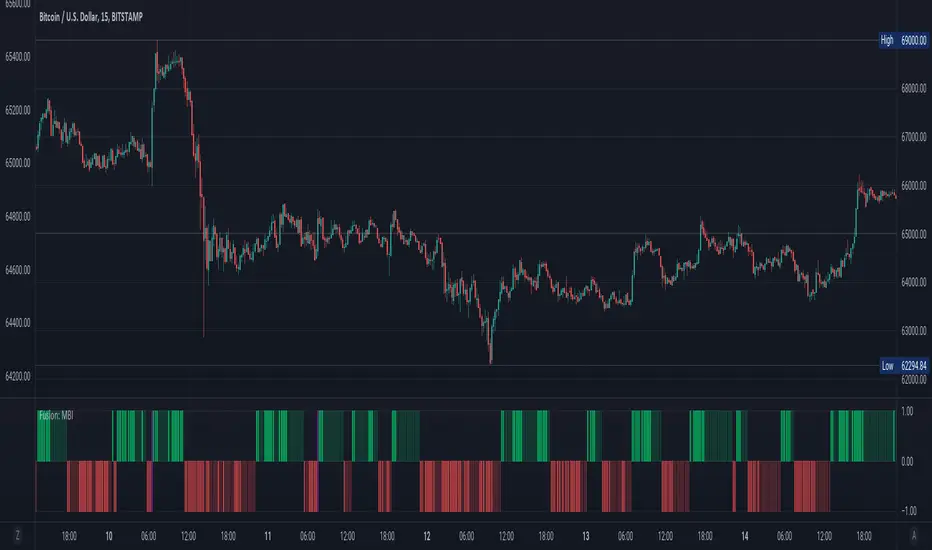
Fusion: Monster Breakout IndexThis indicator is designed to display on both the main chart and a separate chart area. If you want to display it on the main chart then flip the 4 display options. Well... you might want to:
Disable it first
Move it
Flip the display options
and then show it so the move doesn't look ugly.
Display options:
On a separate chart it will display red and lime bars showning potential breakouts.
On the main chart it will show a channel.
Personally like to see it both ways so I generally have two copies of it with one on the main chart.
The " Bar back marker " option is a tiny down arrow at the top of the chart showing where the length of the lookback starts from the current bar. So, if you set the length to 10 then this will be 10 bars back from the current bar. You can show it on or off the main chart but it's not all that visually tasteful off the main chart.
The length is certainly not some optimized setting so set to whatever suits your needs.
The source I set at hl2 which makes more sense to me than the default most people use of close so again, don't assume the settings are correct for your environment... play with it.
Credit:
Modified from the "Monster Breakout Index" by racer8 under the licence of: This source code is subject to the terms of the Mozilla Public License 2.0 at mozilla.org
The code is structured to easily drop into a bigger system so use it as a lone indicator or add the code to some bigger project you are creating. If you do, send me a note, it would be nice to know it's being well used.
Finally, if you find value please do make a comment, give a thumbs up etc.
Enjoy and good luck!
BEST Long Term Levels Breakout ScreenerHello traders
Continuing deeper and stronger with the screeners' educational serie one more time (#daft #punk #private #joke)
We don't have to wait for TradingView to allow screener based on custom indicator - we can build our own ^^
I - Long Terms concept
I had the idea from @scarff.
I think it's genius and I use this long terms level in my trading across all assets.
The screener, in particular, analyzes whenever the price breaks out a weekly/monthly/quarterly/yearly level on candle close .
Triggering events on candle close = we get rid of the REPAINTING = we remove the fake signals (in that case the fake breakouts).
The candle close is based on the close of the current chart => if the chart displays candlesticks on the weekly timeframe, then the considered close will be the weekly close.
If in daily timeframe, the close will be .............................. 4h (#wrong)..... kidding :) .............. DAILY obviously
II - How did I set the screener
The visual signals are as follow:
- square: breakout of a high/low weekly level
- circle: breakout of a high/low monthly level
- diamond: breakout of a high/low quarterly level
- flag: breakout of a high/low yearly level
- dash: none of the above
Then the colors are:
- green when bullish
- red when bearish
- orange/dash when none of the above
Cool Hacks
"But sir... what can we do with only 3 instruments for a screener?" I agree not much but...
As said previously... you can add multiple times the same indicator on a chart :)
Wishing you all the BEST trading and.... wait for it... BEST weekend
Dave

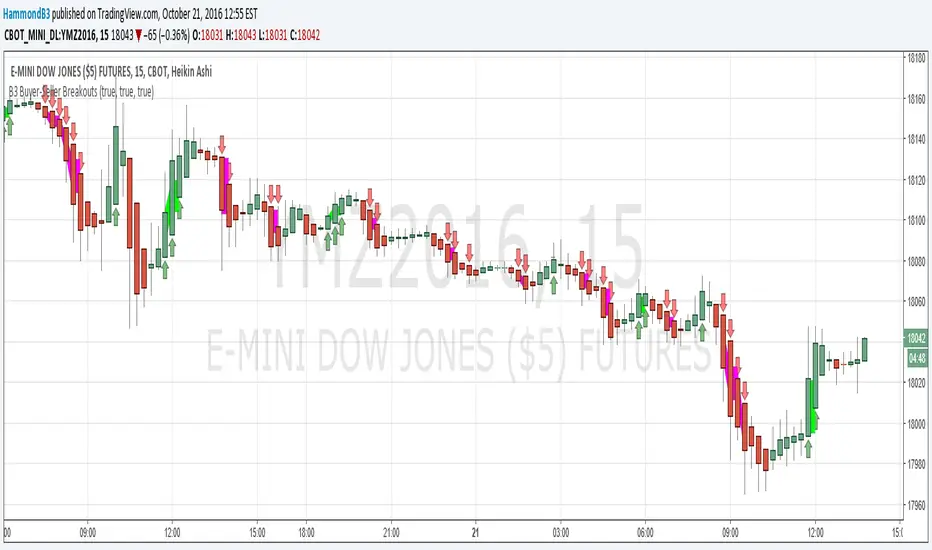
B3 Buyer-Seller BreakoutsB3 Buyer-Seller Breakouts = If a bar is showing that it is moving in a direction with highs lows and close, all of which are >respectively< moving against the open from the bar before, then it prints indicating buyers or sellers bringing momentum. The arrows and cloud carry into the next bar to give lots of awareness of the micro-term momentum. The cloud represents the better price range from which to add to a position.
This study repaints within the bar, most of my indicators do not, but this one is about timing to get an edge on adding to your already in play position, becoming part of the needed momentum to hit profit targets faster. Also, this theory helps you add to winners, and if you never add to losers, you now have statistical odds in your favor. I got the idea for the study reading about turtle trader method and how that statistical edge is really why it works, always adding on every breakout. Keep in mind that I never buy or sell breakouts to initiate trades, only to scale in.
~Cheers!~ ~B3
ORB Breakouts with alerts"ORB Breakouts with Alerts" is a utility indicator that highlights an Opening Range Breakout (ORB) setup during a user-defined intraday time window. It allows traders to visualize price consolidation ranges and receive alerts when price breaks above or below the session high/low.
🔧 Features:
*Customizable session time (start and end), adjustable to local time using a timezone offset.
*Automatically plots:
*A shaded box around the session's high and low.
*Horizontal lines at session high and low levels.
*Optional "BUY"/"SELL" labels to mark breakout directions.
*Visual breakout signals when price crosses above or below the session range.
*Built-in alerts to notify when breakouts occur.
*Configurable styling options including box color, highlight color, and label placement.
⚙️ How It Works:
*During the defined time range, the script tracks the highest high and lowest low.
*After the session ends:
*A box is drawn to represent the opening range.
*Breakouts above the high or below the low trigger visual markers and optional alerts.
*Alerts are limited to one per direction per day to reduce noise.
⚠️ This indicator is a technical analysis tool only and does not provide financial advice or trade recommendations. Always use with proper risk management and in conjunction with your trading plan.

AI Breakout Bands (Zeiierman)█ Overview
AI Breakout Bands (Zeiierman) is an adaptive trend and breakout detection system that combines Kalman filtering with advanced K-Nearest Neighbor (KNN) smoothing. The result is a smart, self-adjusting band structure that adapts to dynamic market behavior, identifying breakout conditions with precision and visual clarity.
At its core, this indicator estimates price behavior using a two-dimensional Kalman filter (position + velocity), then enhances the smoothing process with a nonlinear, similarity-based KNN filter. This unique blend enables it to handle noisy markets and directional shifts with both speed and stability — providing breakout traders and trend followers a reliable framework to act on.
Whether you're identifying volatility expansions, capturing trend continuations, or spotting early breakout conditions, AI Breakout Bands gives you a mathematically grounded, visually adaptive roadmap of real-time market structure.
█ How It Works
⚪ Kalman Filter Engine
The Kalman filter models price movement as a state system with two components:
Position (price)
Velocity (trend direction)
It recursively updates predictions using real-time price as a noisy observation, balancing responsiveness with smoothness.
Process Noise (Position) controls sensitivity to sudden moves.
Process Noise (Velocity) controls smoothing of directional flow.
Measurement Noise (R) defines how much the filter "trusts" live price data.
This component alone creates a responsive yet stable estimate of the market’s center of gravity.
⚪ Advanced K-Neighbor Smoothing
After the Kalman estimate is computed, the script applies a custom K-Nearest Neighbor (KNN) smoother.
Rather than averaging raw values, this method:
Finds K most similar past Kalman values
Weighs them by similarity (inverse of absolute distance)
Produces a smoother that emphasizes structural similarity
This nonlinear approach gives the indicator an AI feature — reacting fast when needed, yet staying calm in consolidation.
█ How to Use
⚪ Trend Recognition
The line color shifts dynamically based on slope direction and breakout confirmation.
Bullish conditions: price above the mid band with positive slope
Bearish conditions: price below the mid band with negative slope
⚪ Breakout Signals
Price breaking above or below the bands may signal momentum acceleration.
Combine with your own volume or momentum confirmation for stronger entries.
Bands adapt to market noise, helping filter out low-quality whipsaws.
█ Settings
Process Noise (Position): Controls Kalman filter’s sensitivity to price changes.
Process Noise (Velocity): Controls smoothing of directional component.
Measurement Noise (R): Defines how much trust is placed in price data.
K-Neighbor Length: Number of historical Kalman values considered for smoothing.
Slope Calculation Window: Number of bars used to compute trend slope of the smoothed Kalman.
Band Lookback (MAE): Rolling period for average absolute error.
Band Multiplier: Multiplies MAE to determine band width.
-----------------
Disclaimer
The content provided in my scripts, indicators, ideas, algorithms, and systems is for educational and informational purposes only. It does not constitute financial advice, investment recommendations, or a solicitation to buy or sell any financial instruments. I will not accept liability for any loss or damage, including without limitation any loss of profit, which may arise directly or indirectly from the use of or reliance on such information.
All investments involve risk, and the past performance of a security, industry, sector, market, financial product, trading strategy, backtest, or individual's trading does not guarantee future results or returns. Investors are fully responsible for any investment decisions they make. Such decisions should be based solely on an evaluation of their financial circumstances, investment objectives, risk tolerance, and liquidity needs.

Live Breakout Zones (No Repaint)The Live Breakout Zones indicator is a non-repainting, real-time breakout detection tool designed to help traders identify critical price breakouts as they happen — without lag and without repainting past signals.
This indicator scans recent price action to determine the highest high and lowest low over a user-defined lookback period. When price closes above the recent high or below the recent low, it immediately plots a breakout zone on the chart and provides a visual confirmation through labels and optional alerts.
🔍 Key Features:
✅ No Repainting – Signals are locked in as soon as a breakout happens; no future bar confirmation is needed.
⏱️ Minimal Lag – Reacts on breakout of recent range highs/lows without waiting for pivots or candle confirmation.
📦 Breakout Zones – Automatically draws colored rectangles showing the breakout level and zone width for clearer analysis.
🔔 Real-Time Alerts – Alerts for both bullish and bearish breakouts help you stay informed without watching the screen.
⚙️ Customizable – Adjustable lookback length, zone width, and color settings to match your strategy or chart style.
📈 Use Cases:
Identify key breakout moments for entry or retest zones.
Confirm breakout-based strategies in trending or consolidating markets.
Use zones for setting risk-reward areas, SL/TP levels, or re-entry planning.
⚙️ Settings:
Lookback Range (High/Low): Defines how many previous bars are checked for breakout levels.
Zone Width: Number of bars to extend the breakout box forward.
Bullish/Bearish Zone Color: Choose custom colors for breakout visualization.
🧠 Trading Tip:
Combine this tool with volume spikes, tail candles, or support/resistance for more reliable breakout setups.

Heatmap Trailing Stop with Breakouts (Zeiierman)█ Overview
Heatmap Trailing Stop with Breakouts (Zeiierman) is a trend and breakout detection tool that combines dynamic trailing stop logic, Fibonacci-based levels, and a real-time market heatmap into a single, intuitive system.
This indicator is designed to help traders visualize pressure zones, manage stop placement, and identify breakout opportunities supported by contextual price–derived heat. Whether you're trailing trends, detecting reversals, or entering on explosive breakouts — this tool keeps you anchored in structure and sentiment.
It projects adaptive trailing stop levels and calculates Fibonacci extensions from swing-based extremes. These levels are then colored by a market heatmap engine that tracks price interaction intensity — showing where the market is "hot" and likely to respond.
On top of that, it includes breakout signals powered by HTF momentum conditions, trend direction, and heatmap validation — giving you signals only when the context is strong.
█ How It Works
⚪ Trailing Stop Engine
At its core, the script uses an ATR-based trailing stop with trend detection:
ATR Length – Defines volatility smoothing using EMA MA of true range.
Multiplier – Expands/retracts the trailing offset depending on market aggression.
Real-Time Extremum Tracking – Uses local highs/lows to define Fibonacci anchors.
⚪ Fibonacci Projection + Heatmap
With each trend shift, Fibonacci levels are projected from the new swing to the current trailing stop. These include:
Fib 61.8, 78.6, 88.6, and 100% (trailing stop) lines
Heatmap Coloring – Each level'slevel's color is determined by how frequently price has interacted with that level in the recent range (defined by ATR).
Strength Score (1–10) – The number of touches per level is normalized and averaged to create a heatmap ""score"" displayed as a colored bar on the chart.
⚪ Breakout Signal System
This engine detects high-confidence breakout signals using a higher timeframe candle structure:
Bullish Breakout – Strong bullish candle + momentum + trend confirmation + heatmap score threshold.
Bearish Breakout – Strong bearish candle + momentum + trend confirmation + heatmap score threshold.
Cooldown Logic – Prevents signals from clustering too frequently during volatile periods.
█ How to Use
⚪ Trend Following & Trail Stops
Use the Trailing Stop line to manage positions or time entries in line with trend direction. Trailing stop flips are highlighted with dot markers.
⚪ Fibonacci Heat Zones
The projected Fibonacci levels serve as price magnets or support/resistance zones. Watch how price reacts at Fib 61.8/78.6/88.6 levels — especially when they're glowing with high heatmap scores (more glow = more historical touches = stronger significance).
⚪ Breakout Signals
Enable breakout signals when you want to trade breakouts only under strong context. Use the "Heatmap Strength Threshold" to require a minimum score (1–10).
█ Settings
Stop Distance ATR Length – ATR period for volatility smoothing
Stop Distance Multiplier – Adjusts the trailing stop'sstop's distance from price
Heatmap Range ATR Length – Defines how far back the heatmap scans for touches
Number of Heat Levels – Total levels used in the heatmap (more = finer resolution)
Minimum Touches per Level – Defines what counts as a ""hot"" level
Heatmap Strength Threshold – Minimum average heat score (1–10) required for breakouts
Timeframe – HTF source used to evaluate breakout momentum structure
-----------------
Disclaimer
The content provided in my scripts, indicators, ideas, algorithms, and systems is for educational and informational purposes only. It does not constitute financial advice, investment recommendations, or a solicitation to buy or sell any financial instruments. I will not accept liability for any loss or damage, including without limitation any loss of profit, which may arise directly or indirectly from the use of or reliance on such information.
All investments involve risk, and the past performance of a security, industry, sector, market, financial product, trading strategy, backtest, or individual's trading does not guarantee future results or returns. Investors are fully responsible for any investment decisions they make. Such decisions should be based solely on an evaluation of their financial circumstances, investment objectives, risk tolerance, and liquidity needs.

False Breakout PRO📌 False Breakout PRO – Enhanced False Breakout Detection Tool
False Breakout PRO is an advanced version of the original "False Breakout (Expo)" indicator by .
This tool is designed to help traders detect bullish and bearish false breakouts with high precision. By offering a more customizable and smarter interface, it helps reduce noise and false signals through various filtering and visualization options.
🔍 How It Works
The script continuously scans for new highs or lows based on a user-defined period.
It identifies false breakouts when price briefly breaks out of a recent high/low but then quickly reverses. These are often seen as market traps, and this indicator aims to highlight them early.
✅ Key Features in the PRO Version
📌 Toggle to display all signals or only the most recent one
💬 Price labels with clean text and optional visibility
📊 Smart summary table for instant signal reference
📈 Auto-extended lines that follow price action
⚡ Lightweight and optimized for speed and real-time responsiveness
🛠 Configurable Settings
False breakout detection period
Signal validity window (how long a signal is considered active)
Smoothing types: Raw (💎), WMA, or HMA
Aggressive mode for early signal generation
Enable or disable:
Price labels
Summary table
Only latest signal mode
⚠️ License Notice
This script is derived from @Zeiierman’s original work and is published under the Creative Commons BY-NC-SA 4.0 license.
🔒 Commercial use is NOT allowed. Attribution to the original author is required.
🇸🇦 False Breakout PRO – أداة متقدمة لكشف الكسر الكاذب
False Breakout PRO هو إصدار مطور من السكريبت الأصلي "False Breakout (Expo)" من تطوير ، وتم تحسينه لتقديم تجربة استخدام أكثر احترافية ومرونة للمستخدمين للكشف عن الكسر الكاذب
🔍 آلية العمل
يقوم السكريبت بمراقبة القمم والقيعان الجديدة بناءً على فترة يتم تحديدها من قبل المستخدم.
ثم يحدد الكسر الكاذب عندما يكسر السعر مستوى مرتفعًا أو منخفضًا ثم يعود بسرعة. هذه الحركة غالبًا ما تكون خداعًا للمضاربين، ويقوم المؤشر بكشفها مبكرًا.
✅ أهم ميزات النسخة PRO
📌 التبديل بين عرض جميع الإشارات أو أحدث إشارة فقط
💬 عرض سعر الإشارة بنص نظيف واختياري
📊 جدول ملخص ذكي لعرض آخر الإشارات بسرعة
📈 تمديد تلقائي للخطوط لمتابعة حركة السعر
⚡ واجهة خفيفة وسريعة ومناسبة للعرض اللحظي
🛠 الإعدادات القابلة للتعديل
فترة تحديد الكسر الكاذب
مدة صلاحية الإشارة
أنواع الفلترة: 💎 خام، WMA، أو HMA
وضع الكشف العدواني (Aggressive)
خيارات العرض:
إظهار أو إخفاء السعر
إظهار أو إخفاء الجدول
عرض آخر إشارة فقط
⚠️ رخصة الاستخدام
تم تطوير هذا السكريبت بالاعتماد على السكريبت الأصلي من @Zeiierman
وهو مرخص بموجب Creative Commons BY-NC-SA 4.0
🔒 الاستخدام التجاري غير مسموح. ويجب نسب الفضل للمطور الأصلي.

Fakeout, Breakout & Trend Switch Detector - TrendPredator FOTrendPredator Fakeout Highlighter (FO)
The TrendPredator Fakeout Highlighter is designed to enhance multi-timeframe trend analysis by identifying key market behaviors that indicate trend strength, weakness, and potential reversals. Inspired by Stacey Burke’s trading approach, this tool focuses on trend-following, momentum shifts, and trader traps, helping traders capitalize on high-probability setups.
At its core, this indicator highlights peak formations—anchor points where price often locks in trapped traders before making decisive moves. These principles align with George Douglas Taylor’s 3-day cycle and Steve Mauro’s BTMM method, making the FO Highlighter a powerful tool for reading market structure. As markets are fractal, this analysis works on any timeframe.
How It Works
The TrendPredator FO highlights key price action signals by coloring candles based on their bias state on the current timeframe.
It tracks four major elements:
Breakout/Breakdown Bars – Did the candle close in a breakout or breakdown relative to the last candle?
Fakeout Bars (Trend Close) – Did the candle break a prior high/low and close back inside, but still in line with the trend?
Fakeout Bars (Counter-Trend Close) – Did the candle break a prior high/low, close back inside, and against the trend?
Switch Bars – Did the candle lose/ reclaim the breakout/down level of the last bar that closed in breakout/down, signalling a possible trend shift?
Reading the Trend with TrendPredator FO
The annotations in this example are added manually for illustration.
- Breakouts → Strong Trend
Multiple candles closing in breakout signal a healthy and strong trend.
- Fakeouts (Trend Close) → First Signs of Weakness
Candles that break out but close back inside suggest a potential slowdown—especially near key levels.
- Fakeouts (Counter-Trend Close) → Stronger Reversal Signal
Closing against the trend strengthens the reversal signal.
- Switch Bars → Momentum Shift
A shift in trend is confirmed when price crosses back through the last closed breakout candles breakout level, trapping traders and fuelling a move in the opposite direction.
- Breakdowns → Trend Reversal Confirmed
Once price breaks away from the peak formation, closing in breakdown, the trend shift is validated.
Customization & Settings
- Toggle individual candle types on/off
- Customize colors for each signal
- Set the number of historical candles displayed
Example Use Cases
1. Weekly Template Analysis
The weekly template is a core concept in Stacey Burke’s trading style. FO highlights individual candle states. With this the state of the trend and the developing weekly template can be evaluated precisely. The analysis is done on the daily timeframe and we are looking especially for overextended situations within a week, after multiple breakouts and for peak formations signalling potential reversals. This is helpful for thesis generation before a session and also for backtesting. The annotations in this example are added manually for illustration.
📈 Example: Weekly Template Analysis snapshot on daily timeframe
2. High Timeframe 5-Star Setup Analysis (Stacey Burke "ain't coming back" ACB Template)
This analysis identifies high-probability trade opportunities when daily breakout or down closes occur near key monthly levels mid-week, signalling overextensions and potentially large parabolic moves. Key signals for this are breakout or down closes occurring on a Wednesday. This is helpful for thesis generation before a session and also for backtesting. The annotations in this example are added manually for illustration. Also an indicator can bee seen on this chart shading every Wednesday to identify the signal.
📉 Example: High Timeframe Setup snapshot
3. Low Timeframe Entry Confirmation
FO helps confirm entry signals after a setup is identified, allowing traders to time their entries and exits more precisely. For this the highlighted Switch and/ or Fakeout bars can be highly valuable.
📊 Example (M15 Entry & Exit): Entry and Exit Confirmation snapshot
📊 Example (M5 Scale-In Strategy): Scaling Entries snapshot
The annotations in this examples are added manually for illustration.
Disclaimer
This indicator is for educational purposes only and does not guarantee profits.
None of the information provided shall be considered financial advice.
Users are fully responsible for their trading decisions and outcomes.

Smart Money Breakouts [iskess 01-02 11:05]This is an big update to the excellent Smart Money Breakout Script published in Oct 2023 by ChartPrime who, to my knowledge, was the original author.
FULL CREDIT GOES TO CHARTPRIME FOR THIS ORIGINAL WORK.
Per the moderator's rules, you will find below a meaningful, detailed self-contained description that does not rely on delegation to the open source code or links to other content. You will find in the description details on what the script does, how it does that, how to use it, and how it is original.
The "Smart Money Breakouts" indicator is designed to identify breakouts based on changes in character (CHOCH) or breaks of structure (BOS) patterns, facilitating automated trading with user-defined Take Profit (TP) level.
The indicator incorporates essential elements such as volume analysis and a data table to assist traders in optimizing their strategies.
🔸Breakout Detection:
The indicator scans price movements for "Change in Character" (CHOCH) and "Break of Structure" (BOS) patterns, signaling potential breakout opportunities in the market.
🔸User-Defined TP/SL :
Traders can customize the Take Profit (TP) and Stop Loss (SL) through the indicator settings, with these levels dynamically calculated based on the Average True Range (ATR). This allows for precise risk management and profit targets that adapt to market volatility. Traders can also select the lookback period for the TP/SL calculations.
🔸Volume Analysis and Trade Direction Specific Analysis:
The indicator includes a volume checker that provides valuable insights into the strength of the breakout, taking into account trade direction.
🔸If the volume label is red and the trade is long, it suggests a higher likelihood of hitting the Stop Loss (SL).
🔸If the volume label is green and the trade is long, it indicates a higher probability of hitting the Take Profit (TP).
🔸For short trades, a red volume label suggests a higher likelihood of hitting TP, while a green label suggests a higher likelihood of hitting SL.
🔸A yellow volume label suggests that the volume is inconclusive, neither favoring bullish nor bearish movements.
🔸Data Table:
The indicator features a data table that keeps track of the number of winning and losing trades for specific timeframes or configurations. It also shows the percentage of profits vs losses, and the overall profit/loss for the selected lookback period.
This table serves as a valuable tool for traders to analyze performance and discover optimal settings and timeframes.
The "Smart Money Breakouts" indicator provides traders with a comprehensive solution for breakout trading, combining technical analysis of changes in character and breaks of structure, volume insights, and performance tracking while dynamically adjusting TP and SL levels based on market volatility through the ATR.
This version of the script is a "significant improvement" from Chart Prime's original work in the following ways:
- A selectable range of candles for the profit/loss calculations to look back on.
- An updated table that includes the percentage of wins/losses, and and overall P&L during the selected lookback range.
- The user can now select only Long trades, Short trades, or both.
- The percentage gain/loss is now indicated for every trade on the chart.
- The user can now select a different multiplier for Stop Loss or Take Profit thresholds.

Opening Range with Breakouts & Targets [LuxAlgo]Opening Range with Breakouts & Targets is based on the long-standing Opening Range Breakout strategy popularized by traders such as Toby Crabel and Mark Fisher.
This indicator measures and displays the price range created from the first period within a new trading session, along with price breakouts from that range and targets associated with the range width.
🔶 USAGE
The Opening Range (OR) can be a powerful tool for making a clear distinction between ranging and trending trading days. Using a rigid structure for drawing a range, provides a consistent basis to make judgments and comparisons that will better assist the user in determining a hypothesis for the day's price action.
NOTE: During a suspected "Range Day", the Opening Range can be used for reversion strategies, typically targeting the opposite extreme of the range or the mean of the range. However, more commonly the Opening Range is used for breakouts on suspected "Trend Days", targeting further upward or downward market movement.
The common Opening Range Breakout Strategy (ORB) outlines a structure to enter and exit positions based on rigid points determined by the Opening Range. This methodology can be adjusted based on markets or trading styles.
Determine Opening Range High & Low: These are the high and low price within a chosen period of time after the market opens. This can be customized to the user's trading style and preference. Common Ranges are from 5-60 mins.
Watch for a Breakout with Volume: A Breakout occurs when price crosses the OR High (ORH) or OR Low (ORL), an increase in volume is typically desired when witnessing these breakouts to confirm a stronger movement.
Manage Risk: Based on user preference and the appropriately determined amount of risk, multiple ways can be determined to manage risk by using Opening Range.
For Example: A stop-loss could be set at OR Mean (ORM) or the opposite side of the range, while a profit target could optionally be set at the first price target generated by the script.
Alternatively, a user might want to use a Moving Average (MA) as an adaptive stop-loss and use price targets to scale out. These are just 2 examples of the possible options, both capable with this tool.
🔹 Signals
Signals will fire based on the break of the opening range, this is indicated by arrows above and below the range boundaries.
Optionally, a bias can be added to these signals to aid in mitigating false signals by using a directional filter based on the current day's OR relative to the previous day's OR.
Regardless of the signal bias being enabled, the Opening Range Zone will always be colored directionally according to this.
If the current day's OR is above the previous day's OR, the Zone will be Green.
If the current day's OR is below the previous day's OR, the Zone will be Red.
By enabling the signal bias, signals in the opposite direction of the daily bias will fire on the cross of the first target in that direction.
🔹 Targets
In this indicator, targets are not limited and will generate infinitely based on a % width of the Opening Range.
Additionally, there are 2 display methods for these targets.
Extended: Extends the targets to the current bar and displays all targets that have been crossed so far within the session.
Adaptive: Extends only the 2 closest targets surrounding price, allowing for a display consisting of fewer lines at one time.
🔶 DETAILS
🔹 Historical Display
This indicator can be utilized in multiple ways, for use in real-time, and for historical analysis to form methods. Because of this, the indicator has an option to display only the current day's data or the entire historical data. This can also help clean up the chart when it is in use.
🔹 Time Period
The specific time period to create the opening range is entirely up to each user's preference, by default it is set to 30 mins; however, this time period can be edited with full control if desired.
Simply toggle on the "Custom Range" and input a range of time to create the range.
🔹 Session Moving Average
The Session Moving Average is a common Moving Average, which resets at the beginning of a new session. This allows for an unbiased MA that was created entirely from the current session's price action.
Note: The start of the session is determined by the start of the Opening Range if using a custom range of time.
🔶 SETTINGS
Show Historical Data: Choose to display only the current session's data or the full history of data.
Opening Range Time Period: Select the time period to form the opening range from. This operates on Session Start, so it will change with the chart.
Custom Range: Opt for a custom Range by enabling this and inputting your range times as well as your needed timezone.
Breakout Signal Bias: Select if the Breakout Signals will use a Daily Directional Bias for firing.
Target % of Range: Sets the % of the Range width that will be used as an increment for the Targets to display in.
Target Cross Source: Choose to use the Close price or High/Low price as the crossing level for Target displays. When this source crosses a target it will generate more targets.
Target Display: Choose which style of display to use for targets.
Session Moving Average: Optionally enable a Moving average of your choice that resets at the beginning of each session (start of opening range).

Smart Money Breakouts [ChartPrime]The " Smart Money Breakouts " indicator is designed to identify breakouts based on changes in character (CHOCH) or breaks of structure (BOS) patterns, facilitating automated trading with user-defined Take Profit (TP) level.
the indicator incorporates essential elements such as volume analysis and a data table to assist traders in optimizing their strategies.
🔸 Breakout Detection:
The indicator scans price movements for "Change in Character" (CHOCH) and "Break of Structure" (BOS) patterns, signaling potential breakout opportunities in the market.
🔸User-Defined TP :
Traders can customize the Take Profit (TP) through the indicator settings, with these levels dynamically calculated based on the Average True Range (ATR). This allows for precise risk management and profit targets that adapt to market volatility.
🔸 Volume Analysis and Trade Direction Specific Analysis:
The indicator includes a volume checker that provides valuable insights into the strength of the breakout, taking into account trade direction.
🔸If the volume label is red and the trade is long, it suggests a higher likelihood of hitting the Stop Loss (SL).
🔸If the volume label is green and the trade is long, it indicates a higher probability of hitting the Take Profit (TP).
🔸For short trades, a red volume label suggests a higher likelihood of hitting TP, while a green label suggests a higher likelihood of hitting SL.
🔸A yellow volume label suggests that the volume is inconclusive, neither favoring bullish nor bearish movements.
🔸Data Table:
The indicator features a data table that keeps track of the number of winning and losing trades for specific timeframes or configurations.
This table serves as a valuable tool for traders to analyze performance and discover optimal settings and timeframes.
The "Smart Money Breakouts" indicator provides traders with a comprehensive solution for breakout trading, combining technical analysis of changes in character and breaks of structure, volume insights, and performance tracking while dynamically adjusting TP and SL levels based on market volatility through the ATR.

Trendline Breakouts With Targets [ChartPrime]The Trendline Breakouts With Targets indicator is meticulously crafted to improve trading decision-making by pinpointing trendline breakouts and breakdowns through pivot point analysis.
Here's a comprehensive look at its primary functionalities:
Upon the occurrence of a breakout or breakdown, a signal is meticulously assessed against a false signal condition/filter, after which the indicator promptly generates a trading signal. Additionally, it conducts precise calculations to determine potential target levels and then exhibits them graphically on the price chart.
🔷 Key Features:
🔸 Trendline Drawing: The indicator automatically plots trendlines based on significant pivot points and wick data, visually representing the prevailing trend.
🔸 Breakout and Breakdown Signals : It triggers trading signals when a breakout (price moves above the trendline) or a breakdown (price moves below the trendline) is detected, helping traders identify potential entry points.
🔸 False Breakout/ Breakdown Filter ✔️: To enhance accuracy, the indicator incorporates a filter to reduce false breakout and breakdown signals, helping traders avoid premature entries.
🔸 Target Calculation: The indicator performs target-level calculations, a critical aspect of trade management.
These calculated target levels are visually displayed on the price chart, helping traders set precise profit targets and make well-informed trading decisions.
🔸 Color-Change Labels: The indicator features label color changes to provide quick visual cues. Labels are initially displayed in orange. When a take profit (TP) level is reached, the label changes to green, indicating a successful trade. Conversely, if a stop-loss (SL) level is hit, the label turns red, signaling a losing trade.
🔸 Settings :
This indicator combines technical analysis, trendline identification, breakout/breakdown signals, and risk management tools to assist traders in making more informed and efficient trading decisions. It can be a valuable addition to any trader's toolkit, helping them identify potential trade opportunities and manage risk effectively.

RSI Trendlines with BreakoutsA pivot-based breakout indicator that attempts to provide traders with a visual aid for finding breakouts on the RSI. Similar to how we use trendlines on our charts, using them on the Relative Strength Index can also give us a sense of direction in the markets.
This script uses its own pivot-based system that checks for real-time swing levels and triggers a new pivot event after every dip and nth bars. The breakout alerts that are given were not designed to be taken as signals since their purpose is to provide an extra bit of confluence. Because of this, I added no other conditions that try to make the alerts "perfect", but instead, print every breakout that is detected. Despite stating this, I did happen to add a condition that checks the difference in RSI and the breakout value, but that's as far as it'll go.
There are alerts built-in to the script, along with adjustable repainting options.
🔳 Settings
Lookback Range: Lookback period to trigger a new pivot point when conditions are met.
RSI Difference: The difference between the current RSI value and the breakout value. How much higher in value should the current RSI be compared to the breakout value in order to detect a breakout?
RSI Settings
Styling Options
🔳 Repaint Options
On: Allows repainting
Off - Bar Confirmation: Prevents repainting and generates alerts when the bar closes. (1 candle later)
🔳 How it Works
Before a trendline is drawn, the script retrieves the slope between the previous pivot point and the current. Then it adds or subtracts the slope x amount of times (based on the lookback range) from the current pivot value until the current x-axis is reached. By doing this we can get a trendline that will detect a breakout accurately.
The result
When using the RSI Difference condition, the script will print breakouts whenever the condition is true, because of this dotted lines were added to track where the alert was triggered.
🔳 Alerts

Pivot Points And Breakout Price Action With LuckyNickVaBar Color Candle Aligned with pivot points swing high and swing lows For Those Who Are Familiar with Trading The Breakouts Of Highs & Lows Of Structure. Pivots are said to be key areas in the market where price shows heavy reaction to where reversals make occur. At these points there are swing Highs & swing lows that traders may be able to find opportunity in the market. This Script is a combination of pivot points and Barcolor signals for the breakout.

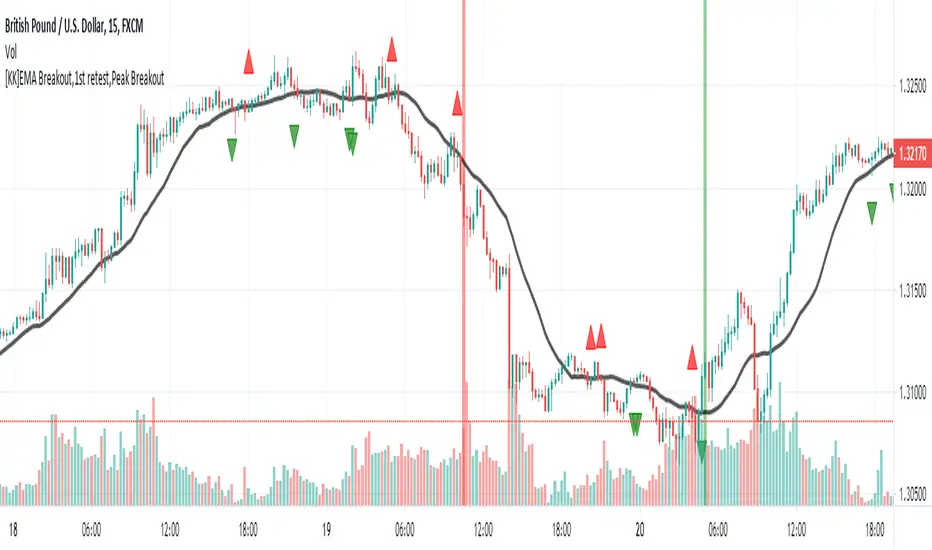
[KK]EMA Breakout,1st retest,Peak BreakoutThis script gives Signal based on 3 parameters
(1) Exponential Moving average breakout
(2)Retest after Breakout
(3) Peak Breakout after retest for conformation
Recommended Settings:
(1) EMA Length = 20 period
(2)Left Bars= Right Bars = 4
(3)15min chart resolution
Note: Default setting is what recommended.
Interpretation:
(1)Green Background = Higher Peak Breakout candle after conformed retest
(2)Red Background = Lower Peak Breakout candle after conformed retest
(3) Green circle = 1st Upward Breakout candle after conformed retest ( if previous breakout is Downward)
(4)Red circle = 1st Downward Breakout candle after conformed retest ( if previous breakout is Upward)
Note: you can additionally add backgrounds for EMA breakout and conformed Retest from code.
Signals:
(1)Long = When Green circle
(2)Short = When Red circle
This script works with any ticker id. Best Use for Equity and Forex Markets. Also, added alert condition for green and red circle.
P.S.: Thanks to @RagingRocketBull for source code for breakout candles
[1] Dynamic Support and Resistance with breakout [Dr Future]This script appears to be designed to identify and visualize dynamic support and resistance levels on a price chart, along with potential breakout signals.
Key Components & Functionality (Inferred):
Dynamic Support and Resistance: The script likely employs algorithms to calculate and plot support and resistance levels that adjust in real-time as price action evolves.
Breakout Detection: The script probably incorporates logic to recognize when the price breaks out of these dynamic support or resistance zones. This could trigger alerts or visual cues on the chart.
Dr Future's Approach: It's worth noting the " " tag, suggesting the script might be based on specific methodologies or insights associated with a trader or analyst known as "Dr Future." Without more context on their strategies, it's difficult to pinpoint the exact techniques used.
Potential Benefits:
Adaptive Levels: Dynamic support and resistance can offer a more responsive approach compared to static levels, as they account for changing market conditions.
Breakout Opportunities: Identifying breakouts can help traders spot potential entry or exit points.
Visual Clarity: Plotting these levels directly on the chart can provide a clearer picture of the current market structure and potential turning points.
Caveats:
False Signals: Like any technical tool, dynamic support and resistance can generate false signals. Breakouts might not always lead to sustained trends.
Parameter Sensitivity: The script's effectiveness likely depends on how its parameters are configured. Fine-tuning might be required to suit different markets or timeframes.
"Dr Future" Factor: The script's performance could be tied to the specific strategies of "Dr Future," which might not be universally applicable.
Important Note:
Without access to the actual code and a deeper understanding of "Dr Future's" methods, this description is based on inference and general knowledge of technical analysis.
Recommendation:
If you're considering using this script, it would be prudent to:
Backtest Thoroughly: Test the script on historical data to assess its performance and identify potential pitfalls.
Understand the Parameters: Familiarize yourself with the script's settings and how they impact the plotted levels and breakout signals.
Combine with Other Tools: Use this script in conjunction with other technical indicators and risk management strategies for a more holistic trading approach.

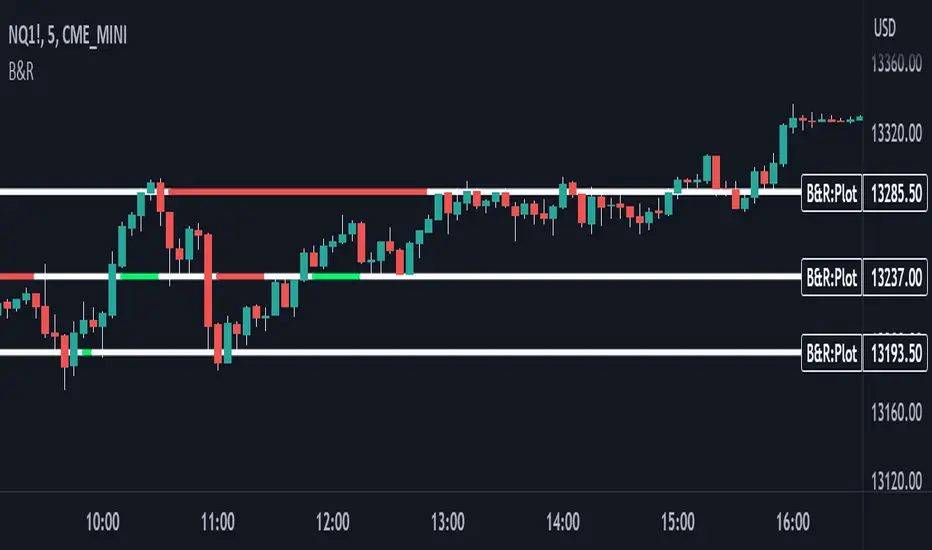
Support & Resistance With Breakout & RetestIntro
The Breakout Retest Indicator is a valuable tool utilized to confirm the occurrence of a proper breakout so you know when to enter on a retest. It analyses the price movement of an asset and identifies a breakout when the price level surpasses the inputted support and resistance values.
Conditions
The indicator operates based on simple yet reliable conditions. Once a candle closes above or below the specified line, the next candle's closure above or below without touching the high or low levels confirms the breakout. The indicator subsequently changes its color, signaling a long or short position. Upon retesting, it reverts to its original color.
Need Your Help
I am sharing this indicator to solicit your input in improving it. As a committed developer, I have ambitious plans for enhancing the indicator's functionality. To that end, I welcome your suggestions and ideas to build indicators that can contribute to the success of people's strategies.
Future Ideas
Some of the potential improvements that I plan to incorporate include the implementation of zones. Users will be able to define zones that require breaking above or below for a confirmed breakout. Additionally, a volume check will provide additional confirmation by evaluating the volume level relative to the breakout. Lastly, close above or below feature will ensure that a certain number of ticks, percentage, or price level has been breached to confirm the breakout.
Swing Breakout Sequence [LuxAlgo]The Swing Breakout Sequence tool enables traders to identify a directional price action scalping sequence comprising two unsuccessful breakouts in the same direction, with the expectation of a third.
🔶 USAGE
This sequence looks for pressure on one side of a swing zone.
The market tried to break out of the zone twice but failed. This led to a pullback into the zone after each attempt. Once a reversal inside the zone is identified, the sequence is complete. It is expected that the market will move from the final reversal within the zone to the final breakout attempt outside the zone.
The sequence of price action is as follows:
Point 1: Breakout attempt out of the swing zone
Point 2: Pullback into the zone
Point 3: Breakout attempt out of Point 1
Point 4: Pullback into the zone, tapping into Point 2 liquidity
Point 5: Reversal structure with Point 4 in the form of a double top or double bottom
This sequence assumes traders will be caught off-guard when they try to capitalize on the initial breakout at Point 1, which is likely to result in a loss. If the breakout at Point 3 fails, all traders will be caught out and switch positions.
If there is enough pressure in the swing zone to cause a reversal at Point 5, the trapped traders could be the start of the next breakout attempt.
🔹 Sequence Detection
Traders can define sequence behavior and adjust detection with three parameters from the Settings panel.
Disabling Points 4 and 5 will detect the most uncompleted sequences.
🔹 Showing/Hiding Elements
Traders can change the look of sequences by showing or hiding their parts using the Style settings.
🔶 SETTINGS
Swing Length: Number of candles to confirm a swing high or swing low. A higher number detects larger swings.
Internal Length: Number of candles to confirm a internal high or internal low. A lower number detects smaller swings. It must be the same size or smaller than the swing length.
🔹 Detection
Point 4 Beyond Point 2: It only detects sequences where Point 4 is beyond Point 2.
Show Point 5: Enable/disable Point 5 detection.
Require Equal H/L at Point 5: Enable/Disable double top/bottom detection at Point 5 within a given threshold. A bigger value detects more sequences.
🔹 Style
Show Sequence Path: Enable/disable a line between sequence points.
Show Boxes: Enable/disable colored boxes for each sequence.
Show Lines: Enable/disable horizontal lines from each point of the sequence.
Default Color: Define the color or enable/disable auto color.

Breakout LevelsBreakout Levels Indicator
The Breakout Levels indicator is a tool designed to help traders identify potential breakout points based on a specified time range and market volatility. By combining user-defined time frames with Average True Range (ATR) calculations, it provides actionable entry and stop-loss levels for both upward and downward breakouts. Additionally, it includes risk management features to calculate appropriate position sizes based on your account capital and risk tolerance.
Key Features
Custom Time Range Selection: Define a specific period during which the indicator calculates the highest high and lowest low to establish breakout levels.
ATR-Based Calculations: Use the ATR to adjust entry and stop-loss levels according to market volatility.
Risk Management: Automatically calculate position sizes based on your account capital and desired risk per trade.
Indicator Inputs
Start Time : The beginning of the time range for calculating the highest high and lowest low.
End Time : The end of the time range.
Entry Multiplier: A factor that determines how far the entry level is from the breakout level, scaled by the ATR.
Stop-Loss Multiplier: A factor that determines the distance of the stop-loss from the entry level, scaled by the ATR.
Risk per Trade (%) : The percentage of your account capital you're willing to risk on each trade.
Account Capital : Your total trading capital used for position size calculations.
ATR Length : The number of periods over which the ATR is calculated.
Position Size Up / Down : Shows you Lot size to maintain no loss more than allowed percentage at that entry

Range Breakout Signals (Intrabar) [LuxAlgo]The Range Breakout Signals (Intrabar) is a novel indicator highlighting trending/ranging intrabar candles and providing signals when the price breaks the extremities of a ranging intrabar candles.
🔶 USAGE
The indicator highlights candles with trending intrabar prices, with uptrending candles being highlighted in green, and down-trending candles being highlighted in red.
This highlighting is affected by the selected intrabar timeframe, with a lower timeframe returning a more precise estimation of a candle trending/ranging state.
When a candle intrabar prices are ranging the body of the candle is hidden from the chart, and one upper & lower extremities are displayed, the upper extremity is equal to the candle high and the lower extremity to the candle low. Price breaking one of these extremities generates a signal.
The indicator comes with two modes, "Trend Following" and "Reversal", these modes determine the extremities that need to be broken in order to return a signal. The "Trend Following" mode as its name suggests will provide trend-following signals, while "Reversal" will aim at providing early signals suggesting a potential reversal.
🔶 DETAILS
To determine if intrabar prices are trending or ranging we calculate the r-squared of the intrabar data, if the r-squared is above 0.5 it would suggest that lower time frame prices are trending, else ranging.
This approach allows almost obtaining a "settings" free indicator, which is uncommon. The intrabar timeframe setting only controls the intrabar precision, with a timeframe significantly lower than the chart timeframe returning more intrabar data as a result, this however might not necessarily affect the displayed information by the indicator.
🔶 SETTINGS
Intrabar Timeframe: Timeframe used to retrieve the intrabar data within a chart candle. Must be lower than the user chart timeframe.
Auto: Select the intrabar timeframe automatically. This setting is more adapted to intraday charts.
Mode: Signal generation mode.
Filter Out Successive Signals: Allows removing successive signals of the same type, returning a more easily readable chart.

Fibonacci Breakout Target LevelsFibonacci Extension
Fibonacci Extension is a powerful technical analysis tool that traders use to predict where the market might find support and resistance. It is based on the Fibonacci sequence and uses levels that are found by extending the 23.6%, 38.2%, 50%, 61.8%, and 100% Fibonacci ratios from a swing high or low. These levels can be used to find possible areas of support and resistance, and traders often use them to figure out when to get into or get out of a trade.
What does this indicator do?
This indicator gets five levels of the Fibonacci Extension and uses it for both the low and the high. The default lookback period is 10 days, and it checks for the highest and lowest price in that period. Then it calculates the extension levels and plots them, and it also adds a line that shows you the current breakout target levels.
How to use?
The primary use intended for this indicator is to be used to determine possible breakout target levels. Let's say you are trading a range and a breakout happens. You can use this indicator to determine possible take-profit zones and possible support and resistance zones.
Features:
Change the lookback period for the Fibonacci Extension levels.
Disable the Fibonacci Bands if you just want to see the FIB levels.
You can also change the 5 levels and add different Fibonacci numbers.
In this image, you can see how you can use this indicator to determine take-profit levels. The Fibonacci Extensions will determine potential support and resistance levels, which could be good places to exit your long or short positions.
