AlphaMACD - Adaptive MACD with Efficiency RatioOVERVIEW
AlphaMACD is an adaptive implementation of the classic MACD indicator that dynamically adjusts its calculation periods based on market efficiency. Unlike traditional MACD which uses fixed periods (typically 12, 26, 9), this indicator adapts its fast and slow EMA periods in real-time based on how efficiently the market is trending.
WHAT MAKES THIS ORIGINAL
This is not a simple MACD with different settings or colors. The core innovation is the adaptive period calculation using Kaufman's Efficiency Ratio, which was originally developed for the Adaptive Moving Average (AMA). This indicator applies that adaptive logic to MACD itself.
Key Differences from Standard MACD:
- Periods dynamically adjust between user-defined ranges (default: 8-21 for fast, 21-55 for slow)
- Uses Kaufman's Efficiency Ratio to measure market trendiness
- Implements gap protection to prevent extreme spikes from market gaps
- Includes market regime detection to filter signals in choppy conditions
- Provides multi-timeframe trend confirmation
HOW IT WORKS
1. Efficiency Ratio Calculation:
The indicator calculates market efficiency by comparing the absolute price change over a period to the sum of absolute price changes within that period. High efficiency = strong trending market. Low efficiency = choppy/sideways market.
2. Adaptive Period Adjustment:
- In trending markets (high efficiency): Periods move toward the minimum values for faster response
- In choppy markets (low efficiency): Periods move toward the maximum values for slower, more stable signals
- The "Sensitivity" parameter controls how aggressively periods adapt (0.5 to 5.0)
3. Gap Protection:
The custom adaptive EMA function detects abnormal price gaps (moves larger than 3x the typical ATR-based change) and limits their impact on the calculation. This prevents weekends or news gaps from causing extreme MACD spikes.
4. Signal Quality Filtering:
- Market regime detection identifies trending vs sideways conditions
- Momentum filter (RSI-based) prevents signals during overextended moves
- Signal strength calculation helps identify high-confidence setups
- Sideways market signals are marked with warning symbols
5. Multi-Timeframe Analysis:
The indicator compares current timeframe MACD with a higher timeframe (default 60 min) to provide context and filter against-trend signals.
HOW TO USE IT
Settings:
- Core Settings: Define the minimum and maximum periods for fast/slow EMAs
- Sensitivity: Higher values make the indicator more responsive to market changes
- Multi-timeframe: Set a higher timeframe for trend confirmation
- Visual options: Customize appearance and enable/disable features
Signal Interpretation:
- Strong bullish/bearish signals (large triangles): High-confidence entries in trending markets
- Warning signals (small ⚠): Crossovers in sideways markets - use caution or skip
- Divergence labels ("DIV"): Price and MACD diverging - potential reversal
- Background color: Green tint = trending market, Orange tint = sideways market
The Information Table shows:
- Current market regime (trending or sideways)
- Market efficiency percentage (how clean the trend is)
- Current adaptive fast and slow periods
- Higher timeframe trend direction
- Current signal strength
Best Practices:
- In trending markets: Trust strong signals, avoid warning signals
- In sideways markets: Reduce position sizes or skip trades entirely
- Use higher timeframe confirmation for better signal quality
- Adjust sensitivity based on your trading timeframe (higher for intraday, lower for swing)
TECHNICAL DETAILS
Calculation Method:
- Efficiency Ratio = ABS(Close - Close ) / SUM(ABS(Close - Close ), Period)
- Smoothed Efficiency = EMA(Efficiency Ratio, 5)
- Fast Period = Fast_Min + (Fast_Max - Fast_Min) × (1 - Smoothed_Efficiency × Sensitivity)
- Slow Period = Slow_Min + (Slow_Max - Slow_Min) × (1 - Smoothed_Efficiency × Sensitivity)
- Adaptive EMA uses standard EMA formula with gap detection and limiting
- MACD = Fast Adaptive EMA - Slow Adaptive EMA
- Signal = EMA(MACD, Signal Period)
- Histogram = MACD - Signal
The adaptive periods are calculated on every bar, so the MACD responds faster in trending conditions and stabilizes during consolidation.
WHAT THIS SOLVES
Standard MACD Problems:
- Fixed periods don't adapt to changing market conditions
- Too many false signals in sideways markets
- Whipsaws during low-volatility consolidation
- Price gaps can cause misleading spikes
AlphaMACD Solutions:
- Periods automatically adjust to market state
- Market regime filter identifies and warns about sideways conditions
- Adaptive smoothing reduces whipsaws
- Gap protection prevents false extremes
LIMITATIONS
- Like all indicators, this does not predict the future
- Requires trending markets for optimal performance
- Adaptive calculation means backtesting results will differ from fixed-period MACD
- More complex than standard MACD - requires understanding of adaptive concepts
- The adaptive periods mean you cannot directly compare this to traditional MACD studies
This indicator is best used as part of a complete trading system, not as a standalone signal generator.
EDUCATIONAL VALUE
For traders learning about:
- Adaptive indicators and market efficiency concepts
- Kaufman's Adaptive Moving Average principles applied to oscillators
- Market regime detection and signal filtering
- Gap handling in technical indicators
- Multi-timeframe analysis integration
Not Financial advice.
在脚本中搜索"gaps"

ICT Killzones x FVGs @dancizyeaaICT Killzones x FVGs Indicator
Last update: 19-SEP-2025
Creator: dancizyeaa
This indicator targets key session highs and lows combined with Fair Value Gaps (FVGs) visualization on TradingView charts. It integrates multiple market sessions (Asia, London, New York), drawing killzones, session separators, and key price levels with user-configurable alerts and filtering. It supports dynamic timeframe limits, coloring by FVG size, moving averages, and labels.
The ICT Killzones x FVGs indicator highlights major session high and low price zones with added fair value gaps, assisting traders in identifying potential reversal or breakout areas. It automatically draws session lines, pivot points, and dynamically colors FVG rectangles by size. It includes options for timezone offsets, alert setups for pivot breaks, and versatile visual configuration for clear session segmentation and market structure awareness.
Detailed Function Descriptions
Session Time and Date Handling:
Manages time offsets and date components to correctly align session boundaries and day separators considering timezone differences, including a weekday naming system for chart labeling.
FVG Detection and Coloring:
Detects bullish and bearish Fair Value Gaps based on recent candles, calculates gap size, and colors gaps differently if they are small or normal size to highlight relevant market inefficiencies.
Killzone (Session High/Low Zone) Management:
Creates and updates boxes, lines, and labels representing important market session zones from Asia to New York, including the ability to extend or limit these objects across timeframes and manage range averages.
Pivot Points and Midpoint Labels:
Draws session-specific pivot highs/lows and optional midpoint lines with alert conditions when these levels are broken, allowing traders to track and be notified of key market moves.
Session Separators and Open Lines:
Draws vertical and horizontal lines marking daily, weekly, and monthly open prices and session start/end boundaries with customizable styling, enhancing chart structure clarity.
Moving Average Overlay:
Optionally plots a user-defined simple moving average line for trend analysis, with customizable length and color.
Alert System:
Provides user-configurable alerts on pivot breaks and other key events, ensuring timely trading signals.
User Inputs and Settings:
Extensive input options to customize timezone offset, session visibility, line styles, transparency, label sizes and positions, and filter parameters for FVGs for a tailored trading experience.

OrderBlock / FVG / BoS / Pivots (Multi-Tools) v 1.3Questo indicatore identifica e visualizza diversi pattern di price action utilizzati nel trading Smart Money Concepts (SMC). Ecco cosa fa:
Funzionalità Principali
-Order Blocks (OB) - Identifica blocchi di ordini istituzionali dove il prezzo potrebbe rimbalzare
-Fair Value Gaps (FVG) - Rileva gap di prezzo che potrebbero essere riempiti
-Break of Structure (BoS) - Segnala rotture di strutture di mercato importanti
-Rejection Blocks (RJB) - Trova zone di rifiuto del prezzo
-Premium Premium Discount Discount (PPDD) - Identifica order blocks formati dopo sweep di liquidità
Caratteristiche Aggiuntive
-Pivot Points - Visualizza massimi e minimi di mercato
-High Volume Bars - Evidenzia candele con volume anomalo
-Stacked OB+FVG - Segnala quando order block e fair value gap si sovrappongono
Personalizzazione
L'indicatore offre controlli completi per:
-Colori personalizzabili per ogni elemento
-Numero massimo di box visualizzabili
-Trasparenza e stili dei bordi
-Etichette e dimensioni
-Opzioni per evidenziare zone "mitigate" (già testate dal prezzo)
È uno strumento molto utile per trader che seguono la metodologia "Smart Money" e cercano di identificare dove gli operatori istituzionali potrebbero aver piazzato i loro ordini.
////////////////////////////////////////////////////////////////////////////////
This indicator identifies and displays various price action patterns used in Smart Money Concepts (SMC) trading. Here's what it does:
Main Features
-Order Blocks (OB) - Identifies institutional order blocks where the price could bounce
-Fair Value Gaps (FVG) - Detects price gaps that could be filled
-Break of Structure (BoS) - Alerts breakouts of important market structures
-Rejection Blocks (RJB) - Finds price rejection zones
-Premium Premium Discount Discount (PPDD) - Identifies order blocks formed after liquidity sweeps
Additional Features
-Pivot Points - Displays market highs and lows
-High Volume Bars - Highlights candles with abnormal volume
-Stacked OB+FVG - Alerts when order blocks and fair value gaps overlap
Customization
The indicator offers complete controls for:
-Customizable colors for each element
-Maximum number of displayable boxes
-Transparency and border styles
-Labels and sizes
-Options to highlight "mitigated" zones (already tested by the price)
It's a tool Very useful for traders following the "Smart Money Concepts" and trying to identify where institutional traders may have placed their orders.

PumpC PAC & MAsPumpC – PAC & MAs (Open Source)
A complete Price Action Candles (PAC) toolkit combining classical price action patterns (Fair Value Gaps, Inside Bars, Hammers, Inverted Hammers, and Volume Imbalances) with a flexible Moving Averages (MAs) module and an advanced bar-coloring system.
This script highlights supply/demand inefficiencies and micro-patterns with forward-extending boxes, recolors zones when mitigated, qualifies patterns with a global High-Volume filter, and ships with ready-to-use alerts. It works across intraday through swing trading on any market (e.g., NASDAQ:QQQ , $CME:ES1!, FX:EURUSD , BITSTAMP:BTCUSD ).
This is an open-source script. The description is detailed so users understand what the script does, how it works, and how to use it. It makes no performance claims and does not provide trade advice.
Acknowledgment & Credits
This script originates from the structural and box-handling logic found in the Super OrderBlock / FVG / BoS Tools by makuchaku & eFe. Their pioneering framework provided the base methods for managing arrays of boxes, extending zones forward, and recoloring once mitigated.
Building on that foundation, I have substantially expanded and adapted the code to create a unified Price Action Candles toolkit . This includes Al Brooks–inspired PAC logic, additional patterns like Inside Bars, Hammers, Inverted Hammers, and the new Volume Imbalance module, along with strong-bar coloring, close-threshold detection, a flexible global High-Volume filter, and a multi-timeframe Moving Averages system.
What it does
Fair Value Gaps (FVG) : Detects 3-bar displacement gaps, plots forward-extending boxes, and optionally recolors them once mitigated.
Inside Bars (IB) : Highlights bars fully contained within the prior candle’s range, with optional high-volume filter.
Hammers (H) & Inverted Hammers (IH) : Identifies rejection candles using configurable body/upper/lower wick thresholds. High-volume qualification optional.
Volume Imbalances (VI) : Detects inter-body gaps where one candle’s body does not overlap the prior candle’s body. Boxes extend forward until wick-based mitigation occurs (only after the two-bar formation completes). Alerts available for creation and mitigation.
Mitigation Recolor : Each pattern can flip to a mitigated color once price trades back through its vertical zone.
Moving Averages (MAs) : Four configurable EMAs/SMAs, with per-MA timeframe, length, color, and clutter-free plotting rules.
Strong Bar Coloring : Highlights bullish/bearish engulfing reversals with different colors for high-volume vs low-volume cases.
Close Threshold Bars : Marks candles that close in the top or bottom portion of their range, even if the body is small. Helps spot continuation pressure before a full trend bar forms.
Alerts : Notifications available for FVG+, FVG−, IB, H, IH, VI creation, and VI mitigation.
Connection to Al Brooks’ PAC teachings
This script reflects Al Brooks’ Price Action Candle methodology. PAC patterns like Inside Bars, Hammers, and Inverted Hammers are not trade signals on their own—they gain meaning in context of trend, failed breakouts, and effort vs. result.
By layering in volume imbalances, strong-bar reversals, and volume filters, this script focuses attention on the PACs that show true participation and conviction, aligning with Brooks’ emphasis on reading crowd psychology through price action.
Why the High-Volume filter matters
Volume is a key proxy for conviction. A PAC or VI formed on light volume can be misleading noise; one formed on above-average volume carries more weight.
Elevates Inside Bars that show absorption/compression with heavy activity.
Distinguishes Hammers that reject price aggressively vs. weak drifts.
Filters Inverted Hammers to emphasize true supply pressure.
Highlights VI zones where institutional order flow left inefficiencies.
Differentiates strong engulfing reversals from weaker, low-participation moves.
Inputs & Customization
Inputs are grouped logically for fast configuration:
High-Volume Filter : Global lookback & multiple, per-pattern toggles.
FVG : Visibility, mitigated recolor, box style/transparency, label controls.
IB : Visibility, require high volume, mitigated recolor, colors, label settings.
Hammer / IH : Visibility, require high volume, mitigated recolor, wick/body thresholds.
VI : Visibility, require high volume, mitigated recolor, box style, labels, mitigation alerts.
Strong Bars : Enable/disable, separate colors for high-volume and low-volume outcomes.
Close Threshold Bars : Customizable close thresholds, labels, optional count markers.
MAs : EMA/SMA type, per-MA toggle, length, timeframe, color.
Alerts
New Bullish FVG (+)
New Bearish FVG (−)
New Inside Bar (IB)
New Hammer (H)
New Inverted Hammer (IH)
New Volume Imbalance (VI)
VI Mitigated
Strong Bullish Engulfing / Bearish Engulfing (high- and low-volume variants)
Suggested workflow
Choose your market & timeframe (script works across equities, futures, FX, crypto).
Toggle only the PACs you actually trade. Assign distinct colors for clarity.
Use MAs for directional bias and higher timeframe structure.
Enable High-Volume filters when you want to emphasize conviction.
Watch mitigation recolors to see which levels/zones have been interacted with.
Use alerts selectively for setups aligned with your plan.
Originality
Builds upon Super OrderBlock / FVG / BoS Tools (makuchaku & eFe) for FVG/box framework.
Expanded into a unified PAC toolkit including IB, H, IH, and VI patterns.
Brooks-inspired design: Patterns contextualized with volume and trend, not isolated.
Flexible high-volume gating with per-pattern toggles.
New VI integration with wick-based mitigation.
Strong Bar Coloring differentiates conviction vs weak reversals.
MTF-aware MAs prevent clutter while providing structure.
Open-source: Transparent for learning, editing, and extension.
Disclaimer
For educational and informational purposes only. This script is not financial advice. Trading carries risk—always test thoroughly before live use.

Sunmool's Next Day Model FVG AlertNY Killzone FVG Alert - ICT Fair Value Gap Detection Indicator
This comprehensive Pine Script indicator is specifically designed for traders following ICT (Inner Circle Trader) methodology and Smart Money Concepts. The indicator automatically detects Fair Value Gaps (FVG) that occur during the New York Killzone session, providing real-time alerts when these critical market imbalances are identified.
Key Features:
🎯 Fair Value Gap Detection
Automatically identifies bullish and bearish Fair Value Gaps using the classic 3-candle pattern
Filters gaps based on customizable minimum size thresholds to avoid insignificant imbalances
Provides visual representation through colored boxes and labels for easy identification
⏰ New York Killzone Focus
Specifically monitors the NY Killzone session (default: 7:00 AM - 10:00 AM EST)
Fully customizable session times to accommodate different trading preferences
Only detects FVGs when all three candles forming the gap occur within the killzone timeframe
📅 ICT Next Day Model Compliance
Automatically excludes Mondays from FVG detection as per ICT Next Day Model principles
Optional Monday exclusion can be toggled on/off based on trading strategy
Ensures alignment with professional ICT trading methodologies
🔔 Advanced Alert System
Three distinct alert conditions: Bullish FVG, Bearish FVG, and Combined alerts
Customizable alert messages for different notification preferences
Compatible with TradingView's full alert system including email, SMS, and webhook notifications
🎨 Visual Customization
Adjustable colors for bullish and bearish FVG boxes
Configurable box extension length for better visualization
Optional background highlighting during killzone sessions
Clean, professional chart presentation that doesn't clutter your analysis
📊 Technical Specifications
Works on all timeframes, though most effective on intraday charts (1m, 5m, 15m)
Timezone-aware calculations ensure accurate session detection globally
Efficient code structure minimizes processing load and chart lag
Compatible with other indicators and doesn't interfere with existing chart setups
🎯 Ideal For:
ICT methodology traders seeking automated FVG detection
Smart Money Concepts practitioners
Scalpers and day traders focusing on NY session
Traders looking to identify high-probability entry zones
Anyone interested in market structure and liquidity concepts
📈 Trading Applications:
Fair Value Gaps often serve as areas where price may return to "fill" the imbalance, making them excellent zones for:
Potential reversal areas
Take profit targets
Stop loss placement reference points
Market structure analysis
Confluence with other ICT concepts
⚙️ Customizable Parameters:
FVG minimum size filter
Killzone session start/end times
Visual display options
Alert preferences
Color schemes and styling options
This indicator brings institutional trading concepts to retail traders, helping identify the same market inefficiencies that smart money targets. By focusing specifically on the New York Killzone - one of the most liquid and volatile trading sessions - it provides high-quality signals during optimal market conditions.
Whether you're new to ICT concepts or an experienced trader looking to automate your FVG detection, this indicator provides the precision and reliability needed for professional trading analysis.

Fractals + FVG [Combined]Звісно, ось варіант опису англійською, який можна використати для публікації індикатора в TradingView.
Description
This script combines two powerful and widely-used trading concepts into a single, comprehensive indicator: Bill Williams Fractals with dynamic support/resistance lines and Fair Value Gaps (FVG) based on the popular logic from LuxAlgo.
The goal is to provide a cleaner chart by merging two essential tools, allowing traders to analyze market structure and imbalances simultaneously.
Features
1. Williams Fractals with Invalidation Lines
This part of the indicator identifies classic Bill Williams fractals and enhances them with a unique visualization feature.
Fractal Detection: Automatically identifies both bullish (bottom) and bearish (top) fractals. You can choose between a 3-bar or 5-bar pattern in the settings.
Dynamic S/R Lines: A horizontal line is automatically drawn from every confirmed fractal, acting as a potential support or resistance level.
Automatic Invalidation: A line is considered "invalidated" or breached when the body of a candle closes past it. When this happens, the line stops extending, changes its color to the "invalidated" color, and remains on the chart as a historical reference. This provides a clear, objective signal that a level has been broken.
Customization: You can fully customize the colors for the support, resistance, and invalidated lines to match your chart theme.
2. Fair Value Gaps (FVG) / Imbalance
This module incorporates the robust FVG detection logic from LuxAlgo to automatically identify and display market imbalances.
FVG Detection: Highlights bullish and bearish Fair Value Gaps on the chart with colored boxes, representing inefficiencies in price delivery.
Automatic Mitigation: The FVG boxes are automatically removed from the chart once the price has "mitigated" or filled the gap, keeping your workspace clean and focused on active imbalances.
Multi-Timeframe (MTF): You can set the indicator to find and display FVGs from a higher timeframe directly on your current chart.
Dashboard: An optional on-screen dashboard provides a quick summary of the total count of bullish/bearish FVGs and the percentage that have been mitigated.
Full Customization: Control the colors of FVG boxes, extend their length, and configure other visual style settings.
How to Use
Fractal Lines: Use the active support and resistance lines as key levels for potential bounces or breaks. A line's invalidation can serve as confirmation of a shift in market structure.
FVG Zones: Fair Value Gaps often act as "magnets" for price. Use these zones as potential targets for your trades or as areas of interest for entries when price retraces to fill the imbalance.
Combined Strategy: The true power of this indicator comes from combining both concepts. For example, a bullish FVG forming near a key fractal support level can create a high-probability confluence zone for a long entry. Similarly, a break and invalidation of a fractal resistance line might signal that price is heading towards the next bearish FVG above.
This indicator is a tool for analysis and should be used in conjunction with your own trading strategy and risk management rules.

Nifty50 Swing Trading Super Indicator# 🚀 Nifty50 Swing Trading Super Indicator - Complete Guide
**Created by:** Gaurav
**Date:** August 8, 2025
**Version:** 1.0 - Optimized for Indian Markets
---
## 📋 Table of Contents
1. (#quick-start-guide)
2. (#indicator-overview)
3. (#installation-instructions)
4. (#parameter-settings)
5. (#signal-interpretation)
6. (#trading-strategy)
7. (#risk-management)
8. (#optimization-tips)
9. (#troubleshooting)
---
## 🎯 Quick Start Guide
### What You Get
✅ **2 Complete Pine Script Indicators:**
- `swing_trading_super_indicator.pine` - Universal version for all markets
- `nifty_optimized_super_indicator.pine` - Specifically optimized for Nifty50 & Indian stocks
✅ **Key Features:**
- Multi-component signal confirmation system
- Optimized for daily and 3-hour timeframes
- Built-in risk management with dynamic stops and targets
- Real-time signal strength monitoring
- Gap analysis for Indian market characteristics
### Immediate Setup
1. Copy the Pine Script code from `nifty_optimized_super_indicator.pine`
2. Paste into TradingView Pine Editor
3. Add to chart on daily or 3-hour timeframe
4. Look for 🚀BUY and 🔻SELL signals
5. Use the information table for signal confirmation
---
## 🔍 Indicator Overview
### Core Components Integration
**🎯 Range Filter (35% Weight)**
- Primary trend identification using adaptive volatility filtering
- Optimized sampling period: 21 bars for Indian market volatility
- Enhanced range multiplier: 3.0 to handle market gaps
- Provides trend direction and strength measurement
**⚡ PMAX (30% Weight)**
- Volatility-adjusted trend confirmation using ATR-based calculations
- Dynamic multiplier adjustment based on market volatility
- 14-period ATR with 2.5 multiplier for swing trading sensitivity
- Offers trailing stop functionality
**🏗️ Support/Resistance (20% Weight)**
- Dynamic level identification using pivot point analysis
- Tighter channel width (3%) for precise Indian market levels
- Enhanced strength calculation with historical interaction weighting
- Provides entry/exit timing and breakout signals
**📊 EMA Alignment (15% Weight)**
- Multi-timeframe moving average confirmation
- Key EMAs: 9, 21, 50, 200 (popular in Indian markets)
- Hierarchical alignment scoring for trend strength
- Additional trend validation layer
### Advanced Features
**🌅 Gap Analysis**
- Automatic detection of significant price gaps (>2%)
- Gap strength measurement and impact on signals
- Specific optimization for Indian market overnight gaps
- Visual gap markers on chart
**⏰ Multi-Timeframe Integration**
- Higher timeframe bias from daily/weekly data
- Configurable daily bias weight (default 70%)
- 3-hour confirmation for precise entry timing
- Prevents counter-trend trades against major timeframe
**🛡️ Risk Management**
- Dynamic stop-loss calculation using multiple methods
- Automatic profit target identification
- Position sizing guidance based on signal strength
- Anti-whipsaw logic to prevent false signals
---
## 📥 Installation Instructions
### Step 1: Access TradingView
1. Open TradingView.com
2. Navigate to Pine Editor (bottom panel)
3. Create a new indicator
### Step 2: Copy the Code
**For Nifty50 & Indian Stocks (Recommended):**
```pinescript
// Copy entire content from nifty_optimized_super_indicator.pine
```
**For Universal Use:**
```pinescript
// Copy entire content from swing_trading_super_indicator.pine
```
### Step 3: Configure and Apply
1. Click "Add to Chart"
2. Select daily or 3-hour timeframe
3. Adjust parameters if needed (defaults are optimized)
4. Enable alerts for signal notifications
### Step 4: Verify Installation
- Check that all components are visible
- Confirm information table appears in top-right
- Test with known trending stocks for signal validation
---
## ⚙️ Parameter Settings
### 🎯 Range Filter Settings
```
Sampling Period: 21 (optimized for Indian market volatility)
Range Multiplier: 3.0 (handles overnight gaps effectively)
Source: Close (most reliable for swing trading)
```
### ⚡ PMAX Settings
```
ATR Length: 14 (standard for daily/3H timeframes)
ATR Multiplier: 2.5 (balanced for swing trading sensitivity)
Moving Average Type: EMA (responsive to price changes)
MA Length: 14 (matches ATR period for consistency)
```
### 🏗️ Support/Resistance Settings
```
Pivot Period: 8 (shorter for Indian market dynamics)
Channel Width: 3% (tighter for precise levels)
Minimum Strength: 3 (higher quality levels only)
Maximum Levels: 4 (focus on strongest levels)
Lookback Period: 150 (sufficient historical data)
```
### 🚀 Super Indicator Settings
```
Signal Sensitivity: 0.65 (balanced for swing trading)
Trend Strength Requirement: 0.75 (high quality signals)
Gap Threshold: 2.0% (significant gap detection)
Daily Bias Weight: 0.7 (strong higher timeframe influence)
```
### 🎨 Display Options
```
Show Range Filter: ✅ (trend visualization)
Show PMAX: ✅ (trailing stops)
Show S/R Levels: ✅ (key price levels)
Show Key EMAs: ✅ (trend confirmation)
Show Signals: ✅ (buy/sell alerts)
Show Trend Background: ✅ (visual trend state)
Show Gap Markers: ✅ (gap identification)
```
---
## 📊 Signal Interpretation
### 🚀 BUY Signals
**Requirements for BUY Signal:**
- Price above Range Filter with upward trend
- PMAX showing bullish direction (MA > PMAX line)
- Support/resistance breakout or favorable positioning
- EMA alignment supporting upward movement
- Higher timeframe bias confirmation
- Overall signal strength > 75%
**Signal Strength Indicators:**
- **90-100%:** Extremely strong - Maximum position size
- **80-89%:** Very strong - Large position size
- **75-79%:** Strong - Standard position size
- **65-74%:** Moderate - Reduced position size
- **<65%:** Weak - Wait for better opportunity
### 🔻 SELL Signals
**Requirements for SELL Signal:**
- Price below Range Filter with downward trend
- PMAX showing bearish direction (MA < PMAX line)
- Resistance breakdown or unfavorable positioning
- EMA alignment supporting downward movement
- Higher timeframe bias confirmation
- Overall signal strength > 75%
### ⚖️ NEUTRAL Signals
**Characteristics:**
- Conflicting signals between components
- Low overall signal strength (<65%)
- Range-bound market conditions
- Wait for clearer directional bias
### 📈 Information Table Guide
**Component Status:**
- **BULL/BEAR:** Current signal direction
- **Strength %:** Component contribution strength
- **Status:** Additional context (STRONG/WEAK/ACTIVE/etc.)
**Overall Signal:**
- **🚀 STRONG BUY:** All systems aligned bullish
- **🔻 STRONG SELL:** All systems aligned bearish
- **⚖️ NEUTRAL:** Mixed or weak signals
---
## 💼 Trading Strategy
### Daily Timeframe Strategy
**Setup:**
1. Apply indicator to daily chart of Nifty50 or Indian stocks
2. Wait for 🚀BUY or 🔻SELL signal with >75% strength
3. Confirm higher timeframe bias alignment
4. Check for significant support/resistance levels
**Entry:**
- Enter on signal bar close or next bar open
- Use 3-hour chart for precise entry timing
- Avoid entries during major news events
- Consider gap analysis for overnight positions
**Position Sizing:**
- **>90% Strength:** 3-4% of portfolio
- **80-89% Strength:** 2-3% of portfolio
- **75-79% Strength:** 1-2% of portfolio
- **<75% Strength:** Avoid or minimal size
### 3-Hour Timeframe Strategy
**Setup:**
1. Confirm daily timeframe bias first
2. Apply indicator to 3-hour chart
3. Look for signals aligned with daily trend
4. Use for entry/exit timing optimization
**Entry Refinement:**
- Wait for 3H signal confirmation
- Enter on pullbacks to key levels
- Use tighter stops for better risk/reward
- Monitor intraday support/resistance
### Risk Management Rules
**Stop Loss Placement:**
1. **Primary:** Use indicator's dynamic stop level
2. **Secondary:** Below/above nearest support/resistance
3. **Maximum:** 2-3% of portfolio per trade
4. **Trailing:** Move stops with PMAX line
**Profit Taking:**
1. **Target 1:** First resistance/support level (50% position)
2. **Target 2:** Second resistance/support level (30% position)
3. **Runner:** Trail remaining 20% with PMAX
**Position Management:**
- Review positions at daily close
- Adjust stops based on new signals
- Exit if trend changes to opposite direction
- Reduce size during high volatility periods
---
## 🎯 Optimization Tips
### For Nifty50 Trading
- Use daily timeframe for primary signals
- Monitor sector rotation impact
- Consider index futures for better liquidity
- Watch for RBI policy and global cues impact
### For Individual Stocks
- Verify stock follows Nifty correlation
- Check sector-specific news and events
- Ensure adequate liquidity for position size
- Monitor earnings calendar for volatility
### Market Condition Adaptations
**Trending Markets:**
- Increase position sizes for strong signals
- Use wider stops to avoid whipsaws
- Focus on trend continuation signals
- Reduce counter-trend trading
**Range-Bound Markets:**
- Reduce position sizes
- Use tighter stops and quicker profits
- Focus on support/resistance bounces
- Increase signal strength requirements
**High Volatility Periods:**
- Reduce overall exposure
- Use smaller position sizes
- Increase stop-loss distances
- Wait for clearer signals
### Performance Monitoring
- Track win rate and average profit/loss
- Monitor signal quality over time
- Adjust parameters based on market changes
- Keep trading journal for pattern recognition
---
## 🔧 Troubleshooting
### Common Issues
**Q: Signals appear too frequently**
A: Increase "Trend Strength Requirement" to 0.8-0.9
**Q: Missing obvious trends**
A: Decrease "Signal Sensitivity" to 0.5-0.6
**Q: Too many false signals**
A: Enable "3H Confirmation" and increase strength requirements
**Q: Indicator not loading**
A: Check Pine Script version compatibility (requires v5)
### Parameter Adjustments
**For More Sensitive Signals:**
- Decrease Signal Sensitivity to 0.5-0.6
- Decrease Trend Strength Requirement to 0.6-0.7
- Increase Range Filter multiplier to 3.5-4.0
**For More Conservative Signals:**
- Increase Signal Sensitivity to 0.7-0.8
- Increase Trend Strength Requirement to 0.8-0.9
- Enable all confirmation features
### Performance Issues
- Reduce lookback periods if chart loads slowly
- Disable some visual elements for better performance
- Use on liquid stocks/indices for best results
---
## 📞 Support & Updates
This super indicator combines the best of Range Filter, PMAX, and Support/Resistance analysis specifically optimized for Indian market swing trading. The multi-component approach significantly improves signal quality while the built-in risk management features help protect capital.
**Remember:** No indicator is 100% accurate. Always combine with proper risk management, market analysis, and your trading experience for best results.
**Happy Trading! 🚀**

FVG 9:31–10:00 AM ETFVG 9:31–10:00 AM ET - Script Description
What This Script Does
This indicator finds **Fair Value Gaps (FVGs)** that form during the first 29 minutes of the U.S. stock market (9:31 AM to 10:00 AM Eastern Time). A Fair Value Gap is a price imbalance where there's a gap between candles that often becomes an important support or resistance level.
Key Features:
- **Time Window**: Only looks for FVGs between 9:31-10:00 AM ET (most important opening period)
- **One Per Day**: Finds only the first FVG that forms in this time window each day
- **Visual Display**: Draws a purple box around the gap with a clear "FVG" label
- **Price Tracking**: Monitors when price comes back to test the gap level
- **Alert System**: Sends notifications when price returns to the FVG zone
How FVGs Are Detected:
- **Bullish FVG**: When there's a gap up (low of middle candle is above high of 3rd candle back)
- **Bearish FVG**: When there's a gap down (high of middle candle is below low of 3rd candle back)
The 9:31-10:00 AM window is chosen because this is when institutions and algorithms create their biggest price moves right after market open, making these gaps very reliable.
Customization Options
User Settings
Extend FVG Box (Bars)
- **What it does**: Makes the purple box longer to the right
- **Default**: 0 (box ends right after the gap forms)
- **Options**: Any number from 0 to 100+
- **When to use**:
- Keep at 0 for clean historical view
- Set to 10-20 to track the gap during the current session
- Set higher for longer reference
Code Settings (Can Be Changed)
Time Window
- **Start**: 9:31 AM Eastern Time
- **End**: 10:00 AM Eastern Time
- **Can modify**: Change the hour/minute numbers in the code
Visual Style
- **Color**: Purple with see-through background
- **Label**: Shows "FVG" text in white
- **Can modify**: Change colors and transparency in the code
How to Use:
Setup
Chart Settings
1. Use 1-minute, 5-minute, or 15-minute charts (works best on these timeframes)
2. Apply to liquid markets like ES, NQ, major stocks, or forex pairs
3. Set the "Extend FVG Box" to your preference (start with 0 or 10)
What You'll See
- A purple box appears when an FVG forms during 9:31-10:00 AM
- Box shows the exact price levels of the gap
- "FVG" label appears on the box
- Only one FVG per day will be marked
Trading Strategies
Basic FVG Trading
1. **Wait for Formation**: Let the purple box appear during 9:31-10:00 AM
2. **Watch Price Movement**: See if price moves away from the gap
3. **Enter on Retest**: When price comes back to the purple box area, consider entering
4. **Trade Direction**:
- Bullish FVG = look for long opportunities when price retests
- Bearish FVG = look for short opportunities when price retests
Entry Methods
- **Bounce Play**: Enter when price touches the FVG box and bounces away
- **Break Play**: Enter if price strongly breaks through the FVG box
- **Rejection Play**: Enter opposite direction if price gets rejected at the FVG
Risk Management
Stop Losses
- Place stops just outside the FVG box (a few ticks beyond the gap)
- If trading a bounce, stop goes on opposite side of the gap
- If trading a break, stop goes back inside the gap
Position Sizing
- Start small until you understand how FVGs work in your market
- Bigger gaps = smaller position size (more risk)
- Smaller gaps = can use larger position size
Profit Targets
- Take profits at obvious levels like round numbers, previous highs/lows
- Consider taking half profits at 1:1 risk/reward ratio
- Let some position run if the move is strong
Best Practices
When It Works Best
- High-volume stocks and futures (ES, NQ work great)
- Normal market days without major news during the 9:31-10:00 window
- When there's clear institutional activity in the opening period
When to Be Careful
- Low-volume stocks or markets
- Major economic news releases during the time window
- Market holidays when volume is low
- Very choppy or sideways days
Alert Usage
- The script will alert you when price comes back to test the FVG
- Don't trade the alert blindly - always check the current market situation
- Use the alert as a heads-up to start watching the setup more closely
Tips for Success
- The earlier the FVG forms in the 9:31-10:00 window, often the more significant it is
- FVGs that form with high volume are usually more reliable
- Always consider the overall market direction - don't fight the main trend
- Practice on paper first to understand how FVGs behave in your chosen market
🔗 Works Best With:
✅ Liquidity Levels — Smart Swing Lows: Spot key structural lows that can fuel stop hunts and reversals.
✅ ICT Turtle Soup — Liquidity Reversal: Add a classic reversal pattern to your toolkit to catch fakeouts cleanly.
✅ ICT SMC Liquidity Grabs and OBs- Liquidity Grabs, Order Block Zones, and Fibonacci OTE Levels, allowing traders to identify institutional entry models with clean, rule-based visual signals.
This script is most valuable for day traders who want to catch institutional moves right after market open, but it can also help swing traders identify important intraday levels.
✅ ICT Macro Zones (Grey Box Version)- It tracks real-time highs and lows for each Silver Bullet session.
✅ Weekly Opening Gap (cryptonnnite)

Neuracap Gap AnalysisThe Neuracap Gap Analysis indicator is a comprehensive tool designed to identify and track price gaps, special candlestick patterns, and high-volume breakout signals. It combines multiple trading strategies into one powerful indicator for gap trading, pattern recognition, and momentum analysis.
🎯 What This Indicator Does
1. Gap Detection & Tracking
Automatically identifies price gaps (up and down)
Tracks gap fills with visual boxes that extend until closed
Manages gap history with customizable limits
Color-coded visualization (Green = Gap Up, Red = Gap Down)
2. Upside Tasuki Gap Pattern
Identifies the bullish continuation pattern
Colors candles yellow when pattern is detected
Confirms trend continuation signals
3. Episodic Pivot Detection
High-volume breakout identification
EMA filter ensures signals only in uptrends
Strong momentum confirmation
Fuchsia-colored candles with arrow markers
🔍 How to Use for Trading
📈 Gap Trading Strategy
Gap Up Trading:
Wait for gap up (green box appears)
Check volume - Higher volume = stronger signal
Entry options:
Aggressive: Enter at market open
Conservative: Wait for pullback to gap level
Stop loss: Below the gap fill level
Target: Previous resistance or 2:1 risk/reward
Gap Down Trading:
Identify gap down (red box appears)
Look for bounce opportunities
Entry: When price shows reversal signs
Stop: Below recent lows
Target: Gap fill level
💫 Tasuki Gap Strategy
Yellow candle indicates bullish continuation
Confirms uptrend is likely to continue
Entry: On next candle after pattern
Stop: Below the gap low
Target: Next resistance level
🚀 Episodic Pivot Strategy
Fuchsia candle + arrow = High probability breakout
All conditions met:
Price above EMA 20, 50, 200
High volume (2x+ average)
Strong price move (4%+)
Entry: At close or next open
Stop: Below EMA 20 or recent swing low
Target: Measured move or next resistance
📊 Reading the Visual Signals
Gap Boxes
🟢 Green Box: Gap up - potential bullish continuation
🔴 Red Box: Gap down - potential bounce or bearish continuation
Box extends until gap is filled
Box disappears when gap closes
Candle Colors
🟡 Yellow: Tasuki gap pattern (bullish continuation)
🟪 Fuchsia: Episodic pivot (high-volume breakout)
⬜ Normal: No special pattern detected
Arrows & Markers
⬆️ Triangle Arrow: Episodic pivot confirmation
💡 Trading Tips & Best Practices
✅ Do's
Combine with trend analysis - Trade gaps in direction of trend
Check volume - Higher volume = more reliable signals
Use multiple timeframes - Confirm on higher timeframes
Risk management - Always set stop losses
Wait for confirmation - Don't chase, let signals develop
❌ Don'ts
Don't trade all gaps - Focus on high-quality setups
Avoid low volume - Weak volume = unreliable signals
Don't ignore trend - Counter-trend trading is risky
Don't overtrade - Quality over quantity
Don't ignore context - Consider market conditions
⚠️ Risk Management
Position sizing: Risk 1-2% per trade
Stop losses: Always define before entry
Target levels: Set realistic profit targets
Market conditions: Avoid trading in choppy markets
📈 Performance Optimization
For Conservative Traders:
Increase minimum gap size to 1%
Set volume multiplier to 3.0x
Only trade episodic pivots in strong uptrends
Wait for gap fill confirmation
For Aggressive Traders:
Decrease minimum gap size to 0.3%
Set volume multiplier to 1.5x
Trade both gap types
Enter on pattern confirmation
🚨 Alert Setup
The indicator provides alerts for:
Gap Up Detected
Gap Down Detected
Upside Tasuki Gap
Episodic Pivot
Recommended: Enable all alerts and filter manually based on your strategy.
📝 Summary
This indicator excels at identifying high-probability trading opportunities through gap analysis, pattern recognition, and momentum confirmation. Use it as part of a complete trading system with proper risk management for best results.

Price Ranged FVG📌 Price Ranged FVG
Is a clean and efficient tool designed to detect Fair Value Gaps (FVGs) with adjustable filters and structural context. It’s especially useful for traders looking to filter out insignificant gaps and focus on high-probability areas, particularly around swing breaks or structural shifts.
🧠 What is a Fair Value Gap (FVG)?
A Fair Value Gap appears when there’s a price imbalance between candles — typically after a strong move — where the market skips over certain price levels without trading there. These zones can act as potential areas for price to return to (mean reversion), or serve as support/resistance depending on market structure.
🔍 FVG Detection Types
You can choose between three different detection modes under the "FVG Detection" input:
Same Type: Only detects FVGs where the last 3 candles are in the same direction (all bullish or all bearish).
All: Detects any FVG, regardless of candle direction.
Twin Close: Detects FVGs only when the last two candles are in the same direction and close accordingly — offering a stricter confirmation.
🎯 FVG % Filters
To filter out noise or insignificant gaps, this indicator includes:
Minimum FVG % Filter: Ignores FVGs smaller than your specified percentage of the current close.
Maximum FVG % Filter: Ignores overly large gaps that may be unreliable or caused by anomalies.
These filters help focus on relevant FVGs that are more likely to act as reaction zones.
🏛 Structural Context (Swing Highs and Lows)
The indicator plots swing highs and swing lows with dots to provide structure-based context:
Set Swing Strength to 3 for detecting internal structure (shorter-term moves).
Use a higher setting like 5 to focus on external structure (more significant highs/lows).
These levels can help you determine whether an FVG is forming within a consolidation, breakout, or key structural transition.
✅ Use Case (My Personal Workflow)
I personally use this indicator to:
Filter out weak or irrelevant FVGs using the % filters.
Watch for price interaction at swing breaks — especially when an FVG aligns with a break in internal or external structure.
Refine entry and exit planning in confluence with other tools or strategies.
⚠️ Disclaimer
This indicator is not financial advice. It is a technical analysis tool intended to support your own decision-making process. Always do your own research and risk management.

Rapid ICT Suite - MTF Concepts & iFVGTitle: Rapid ICT Suite - MTF Concepts & iFVG
Overview
Unlock a new level of market analysis with the Rapid ICT Suite, a comprehensive, all-in-one indicator designed for the discerning price action trader. This powerful tool merges two distinct analytical engines into one seamless experience, allowing you to overlay critical Higher Timeframe (HTF) market structure onto your current chart while simultaneously tracking real-time Fair Value Gaps (FVGs) and their inversions (iFVGs).
Whether you are a scalper needing to respect 1H structure, a day trader aligning with the 4H bias, or a swing trader mapping the daily trend, this indicator provides the clarity and context you need to make higher-probability trading decisions. It was built from the ground up to solve common issues traders face, delivering stable, precise, and flexible analysis.
The Strategy: Targeting IRL with iFVG Entries
The Destination (The "Why"): Internal Range Liquidity (IRL)
On a Higher Timeframe (HTF), we will identify major Internal Range Liquidity (IRL) zones. In the context of ICT, IRL simply refers to unmitigated Fair Value Gaps (FVGs) that exist within a broader trading range.
These HTF FVGs act as powerful magnets for price. The market will often seek out these zones to rebalance before continuing its next major move. By plotting these on our chart, we establish a clear directional bias and a high-probability target. Our indicator will now label these HTF FVG boxes as "IRL".
The Entry Signal (The "How"): Inverted Fair Value Gaps (iFVG)
Once we have our HTF IRL target, we drop down to our Lower Timeframe (LTF) for execution.
We wait for price to create an Inverted Fair Value Gap (iFVG). An iFVG is a regular FVG that has failed and been traded through, signifying a shift in momentum.
An iFVG appearing on the LTF provides a high-precision entry signal to take a trade in the direction of the HTF IRL zone. It's our confirmation that the market is likely now making its move towards that destination.
Key Features
Multi-Timeframe Order Blocks (Boxes): Automatically identify and plot key HTF demand and supply zones (Order Blocks) onto your chart.
Multi-Timeframe Fair Value Gaps (Boxes): See where HTF imbalances exist, giving you a clear map of institutional reference points and potential targets.
Multi-Timeframe Liquidity Pools (Boxes): Pinpoint where buy-side and sell-side liquidity is likely resting, based on clusters of old highs and lows.
Current Timeframe FVG & iFVG (Lines/Labels): A second, independent engine tracks FVGs on your chosen timeframe, monitors them for mitigation, and automatically identifies when an FVG has been inverted (iFVG), a crucial shift in market dynamics.
The "Rapid" Advantage: Solving Trader Frustrations
This indicator was engineered to overcome three of the most common problems with technical indicators:
1. ✅ No More Flickering or "Ghost" Signals
The Problem: Many indicators show signals on the live, forming candle. This causes zones or signals to appear and disappear ("flicker"), leading to confusion and false entries.
The Solution: The Rapid ICT Suite uses 100% confirmed, closed-candle data for all its calculations (OB, FVG, and Liquidity). A zone will only appear on your chart after the price action that confirms it is complete. This means every signal is stable, reliable, and non-repainting.
2. ✅ Frame-Perfect, Precise Placement
The Problem: Indicators that use lookback logic often draw their signals one candle too late, causing a visual disconnect between the price pattern and the signal itself.
The Solution: We have corrected this common flaw. Every box and line is drawn starting from the exact confirmation candle of the pattern. This frame-perfect precision is critical for accurate analysis and planning your entries.
3. ✅ The Dual Analysis Engine: Uncluttered & Flexible
The Problem: Trying to analyze multiple timeframes at once can lead to cluttered charts and mental overload .
The Solution: This suite contains two independent parts that you can control separately.
Part 1 gives you the macro context—the HTF structure where big moves originate.
Part 2 gives you the micro details—the real-time FVG and iFVG story on your trading timeframe.
Use them together for a complete picture, or toggle one off to focus on a specific aspect of your strategy. This flexibility keeps your workspace clean and your analysis sharp.
How to Use & Settings Explained
The indicator settings are neatly organized into two main parts.
Part 1: MTF Concepts (OB, FVG, Liq)
This section controls the Higher Timeframe boxes that are overlaid onto your current chart.
Higher-TF for OB/FVG/Liq: This is the most important setting. Select the higher timeframe you want to analyze. For example, if you are trading on the 15-minute chart, you might set this to 240 (4-Hour) to see the key 4H zones.
Show Order-Blocks / FVGs / Liquidity: Simple toggles to turn each type of HTF zone on or off.
Max... Count: Controls how many of the most recent zones are displayed on the chart, preventing clutter from old, irrelevant zones.
Part 2: FVG & iFVG (Lines/Labels)
This section controls the second engine, which analyzes FVGs and iFVGs on its own selected timeframe.
Timeframe for FVG/iFVG: Choose the timeframe for this analysis. You can leave it blank to use your current chart's timeframe, or set it to a specific one.
Mitigation Type & Mitigation %: A powerful feature to define when an FVG is considered "used up."
Type: Choose if mitigation is counted from the candle's Wick or Close.
Percent: Set how far price must retrace into an FVG (e.g., 50%) before it is considered mitigated and the lines are removed from your chart.
FVG/iFVG Count: Controls how many of the most recent FVG/iFVG zones are displayed.
Style & Color Settings: Fully customize the appearance of the lines and labels to match your chart theme.
Final Words
This indicator was built to provide actionable clarity. By understanding the interplay between higher-timeframe structure and current price action, you can significantly enhance your trading edge. Thank you for choosing the Rapid ICT Suite.
Happy trading!

Gap Open DetectorIndicator Note: Gap Open Detector
What This Indicator Does
This indicator helps you spot significant price gaps at the start of new candles compared to the previous candle’s close. A gap means the current candle’s opening price is noticeably higher or lower than the previous candle’s closing price.
Gap Up: The new candle opens above the previous candle’s close.
Gap Down: The new candle opens below the previous candle’s close.
The indicator highlights these gaps with colored candles:
Green Candle: Gap Up detected.
Red Candle: Gap Down detected.
How to Use the Indicator:
This indicator gives Best Results on Hourly Candles:
This indicator works best on hourly charts (1-hour time frame). It is especially useful for spotting gaps at the start of the next day or after a significant break in trading.
Wait for Confirmation:
After a gap is detected at the open, wait for the candle to form. Ideally, wait for one hour (until the hourly candle is complete) to confirm the candle’s direction and strength before taking any action.
Customize Gap Size:
You can set the minimum gap size using either points or percentage:
Points: Enter the minimum number of points for a gap to be considered significant.
Percentage: Enter the minimum percentage change for a gap to be considered significant.
This flexibility allows you to adjust the indicator to suit different markets and volatility levels.
Trading Logic
If there is a Gap Up and the one hour candle is green:
Buy Option: Consider initiating a buy (long) position.
If there is a Gap Up but the one hour candle is red:
Sell Option: Consider initiating a sell (short) position.
If there is a Gap Down and the one hour closing candle is red:
Sell Option: Consider initiating a sell (short) position.
If there is a Gap Down but the one hour candle is green:
Buy Option: Consider initiating a buy (long) position.
Important Tips
1. Patience Pays: Always wait for the hourly candle to close before making any trading decisions based on the gap.
2. Next Day Open: This strategy is especially effective for catching gaps at the start of a new trading day or after a market break.
3. Visual Cues: The indicator gives you a simple visual cue to spot potential trading opportunities.
4. Flexible Settings: Set your preferred gap size in points or percentage to match your trading style.

[GetSparx] Lacuna Pro⚡ Lacuna Pro – Institutional Liquidity Framework
This indicator is a premium Smart Money Concepts (SMC) trading toolkit designed to help traders identify high-probability entry and exit zones by visualizing real-time market inefficiencies. It combines Fair Value Gaps (FVGs), Break of Structure (BOS), Change of Character (CHoCH), and Supply & Demand Zones into a unified, configurable framework.
Unlike many public indicators that simply "overlay concepts", this indicator implements strict internal validation to filter out noise and provide only institutional-grade levels — making it a valuable execution layer for SMC-based strategies.
🧠 What the Script Does – and Why the Combination Matters
This is more than just a combination of known SMC tools — it's a complete workflow assistant:
-FVGs highlight where liquidity is likely resting due to institutional imbalance.
-BOS & CHoCH define structural context: whether the market is trending or shifting.
-Supply & Demand Zones show where institutions are likely to react.
-Each component works together to create a layered confluence system:
-FVG inside a Demand Zone after a Bullish CHoCH → High-probability Long Setup
-Bearish BOS into a Supply Zone + fresh Bearish FVG → High-probability Short Setup
📘 Core Concepts Explained
Fair Value Gap (FVG)
FVGs occur when price moves with strong momentum and leaves a gap between candles — suggesting inefficiency. Bullish FVGs lie below price; bearish ones above. Price often returns to these levels before continuing.
An FVG is detected when a three-candle sequence reveals a price imbalance:
- Bullish : Candle 2’s low is higher than Candle 1’s high
- Bearish : Candle 2’s high is lower than Candle 1’s low
These setups indicate a sudden burst of institutional momentum, often causing price to revisit the gap for rebalancing.
Break of Structure (BOS)
A BOS signals trend continuation when price breaks the previous swing high or low in the direction of the current trend.
The script uses a 3-bar pivot system to detect local swing highs and lows — a swing high forms when the highest candle is flanked by two lower highs on each side (and vice versa for swing lows).
A BOS is confirmed when price closes beyond the most recent swing point in alignment with the current trend direction.
Change of Character (CHoCH)
A CHoCH signals a potential trend reversal by breaking a structure level in the opposite direction of the prevailing trend.
It is detected when price breaks the most recent opposing swing and simultaneously flips the internal trend state.
CHoCH events always take precedence over BOS to avoid conflicting signals.
The internal trend engine ensures that these structural shifts are valid and not caused by random volatility.
Supply & Demand Zones
These zones mark institutional interest and are formed using precise price action rules — not arbitrary support/resistance.
A valid zone begins when a small-bodied base candle (such as a star or doji) appears at a local swing point. This candle must be followed by a strong impulse candle — either a bullish engulfing (for demand) or bearish breakout (for supply).
- Demand Zone : From the base candle's low to the impulse candle's high
- Supply Zone : From the base candle's high to the impulse candle's low
These zones represent likely institutional entries or exits, often acting as magnets or rejection areas. Once price decisively breaks through a zone, it is automatically removed — keeping the chart clean and relevant.
Zone Detection Logic – When a Zone Is Drawn or Skipped
Below are the precise rules used to determine whether a Supply or Demand Zone is valid and shown on the chart
A Supply or Demand Zone is only drawn if all of the following conditions are met:
-A small-bodied base candle forms at a local high or low (body size below threshold)
-The base candle is followed by a strong impulse candle (engulfing or breakout)
-The impulse direction matches the expected context (e.g., bearish impulse from swing high = Supply)
-The candle wicks do not invalidate the structure (e.g., no long opposing wick that retraces the move)
-The zone meets the minimum size threshold based on % or ATR filter
If any of these criteria are not satisfied, the zone is skipped to avoid false or weak levels.
This ensures only clean, institutional-grade Supply & Demand Zones are shown on the chart.
(e.g. small-bodied star + bullish engulfing at swing low = Demand Zone, or bearish breakout at swing high = Supply Zone).
🔍 Core Functionality & Original Features
1. 📉 Fair Value Gaps (FVGs) – Dynamic, Validated, and Clean
Unlike scripts that draw every gap, this script applies strict quality control to ensure only meaningful FVGs appear:
Minimum Threshold Filtering
Filters out small or noisy gaps by requiring each FVG to exceed a % or ATR-based size threshold. Prevents micro-gap clutter on lower timeframes.
Momentum Candle Verification
Requires a strong middle candle (candle 2) between two extremes. Large opposing wicks invalidate the setup.
Partial Fill Adjustment
When price partially fills a gap, the FVG box automatically shrinks to show only the remaining imbalance. If fully filled, the box is removed.
Multi-Timeframe Overlays
View institutional gaps from 15m, 1H, 4H, or Daily overlaid onto any chart for top-down analysis and entry refinement.
2. 🧱 Structural Shifts – BOS & CHoCH
Structural logic is built around pivot detection with real-time trend state awareness:
Pivot Logic (Customizable Strength)
Local highs/lows are detected using pivot length (default: 3 bars left/right). Breaks are only confirmed if they align with the internal trend state.
BOS = Continuation
Breaks a swing in trend direction (e.g., HL → HH → BOS at previous HH)
CHoCH = Reversal
Breaks a structure against trend (e.g., HH → HL → break of HL = Bearish CHoCH)
Conflict Resolution
If both BOS and CHoCH could trigger, CHoCH takes priority. This avoids false positives and ensures a single, clear structure signal per swing.
Styling & Visibility
All structure lines and labels are customizable — colors, line style (solid/dashed), and which signals to display (BOS/CHoCH/both).
3. 🧠 Supply & Demand Zones – Smart Detection & Maintenance
These zones are generated using strict price action logic, not arbitrary support/resistance lines:
-Formation Conditions
-Small-bodied "base candle" at a local high/low
-Followed by an impulse candle (bullish/bearish engulfing or breakout)
-Zone Bounds
- Demand : From base candle low to impulse high
- Supply : From base candle high to impulse low
Automatic Cleanup
Once price decisively pierces a zone, it’s automatically removed from the chart. This keeps the display relevant and clutter-free.
Multi-Timeframe Zones
Toggle zones from your current timeframe or overlay from 1H, 4H, and Daily — ideal for confluence stacking.
Zone Compression Filtering
Optional compression % ensures overlapping zones are combined logically to reduce redundancy.
🧩 How It Works Together – Practical Usage Flow
This indicator is designed to follow a structured workflow used by institutional-style traders:
Trend Structure
Identify trend using BOS and CHoCH on your timeframe.
Liquidity Zones
Look for supply/demand zones aligning with the structural bias.
Execution Areas
Wait for an unfilled FVG in confluence with the above conditions.
📸 Screenshot Captions
Screenshot 1: CHoCH + Demand Zone + Bullish FVG
📌 Reversal Setup with Confluence
A Bullish CHoCH confirms a structural shift. Price enters a Demand Zone and reacts from an unfilled Bullish FVG, creating a high-probability long opportunity.
Screenshot 2: Bearish BOS + FVG Fill
📌 Trend Continuation Confirmation
Price breaks a swing low, triggering a Bearish BOS. A Bearish FVG forms and price returns to fill it before continuing lower — validating the trend and the gap.
Screenshot 3: Multi-Timeframe Overlay (FVGs from 1H and 4H)
📌 Top-Down Liquidity Mapping
Overlaid 1H and 4H FVGs provide institutional-level insight on lower timeframes. Combined with structure signals, this supports precise entry alignment across timeframes.
As price partially fills a bullish gap, the FVG box auto-adjusts to show only the remaining imbalance. Fully filled zones are automatically removed, keeping the chart clean.
Screenshot 4: Supply Zone Rejection
📌 Institutional Supply in Action
Price enters a Supply Zone formed from a base candle + bearish impulse. A sharp rejection confirms active sell-side interest at this level. Zone opgevuld box verdwijnt
Screenshot 5: Bullish BOS + Internal Trend Logic
📌 Trend Continuation with Structure Awareness
A Higher Low forms, followed by a Higher High, triggering a Bullish BOS. The internal trend engine confirms direction and filters false reversals.
Screenshot 6: Zone Compression Logic
📌 Smart Zone Consolidation
Closely overlapping supply zones are merged using compression logic to prevent clutter. Only the strongest institutional levels remain visible.
⚙ Full Customization Panel
You can configure:
-FVG display per timeframe + color scheme
-BOS/CHoCH styling, label text, and detection toggles
-Zone settings: visibility, compression %, length
-Auto-cleanup behavior for FVGs and zones
🔐 Why Invite-Only?
This indicator contains original logic not available in public indicators, including:
-Momentum-candle verified FVGs
-Real-time partial fill trimming
-Auto-removal of invalidated structure/zones
-Conflict-aware BOS/CHoCH logic
-Multi-timeframe overlays with internal state tracking
-Proprietary compression-based zone filtering
This script is part of a private paid offering. It is not based on reused or repackaged educational code. The logic and structure management are exclusive to this implementation.
⚠ Disclaimer
This tool is for educational and analytical use only. It does not provide financial advice or trading signals. Always use proper risk management and do your own due diligence.

CandelaCharts - Unicorn Model📝 Overview
The Unicorn Model is an advanced indicator that pinpoints high-probability reversal setups based on the ICT Unicorn formation. It uses a zigzag-based structure to detect engineered liquidity grabs followed by sharp displacements in the opposite direction—ideal for fade entries or the start of new trends.
The indicator is enhanced with macro time filters, allowing it to align model detections with key trading sessions and institutional flow windows.
The ICT Unicorn Model is a precision-driven intraday strategy rooted in smart money concepts. It combines time-of-day sensitivity, engineered liquidity runs, and institutional order flow to uncover high-quality trading opportunities.
📦 Features
Liquidity Levels: Projects forward-looking liquidity zones after a Unicorn model is confirmed, highlighting potential price targets. These zones act as magnet areas where price is likely to be drawn, helping traders manage exits, partials, and re-entries with greater precision.
Unicorn: The Unicorn formation utilizes a smart money framework and a dynamic zigzag detection method to identify engineered liquidity grabs—sharp sweeps of previous highs or lows—followed by impulsive reversals.
Macros: These time-based intervals represent key moments when institutional algorithms are most active, seeking liquidity, rebalancing, or delivering price to key levels like fair value gaps and liquidity pools.
Custom TF Pairing: Choose your preferred combination of entry timeframe and context timeframe. For example, trade 5m setups within a 1h HTF bias, allowing precise alignment of microstructure with broader directional intent.
HTF & LTF PD Arrays: Displays high- and low-timeframe PD Arrays (e.g., Fair Value Gaps, Inversion Fair Value Gaps) that act as zones of interest or rejection, enhancing confluence and risk control.
History: Backtest previous Unicorn setups directly on the chart. Toggle historical models to analyze past behavior, improve your confidence, and fine-tune your trade execution across varying market regimes.
Killzone Filter: Restrict signal generation to specific trading sessions or killzones (e.g., London Open, New York AM). This minimizes false positives in low-volume or overlapping ranges.
Standard Deviation: Dynamically calculates and plots four deviation bands from the model confirmation point. These levels offer insight into stretch targets, volatility bands, and potential mean-reversion zones.
Dashboard: A real-time control panel showing the active model, HTF candle timer, current directional bias, asset name, and session date—offering clarity and fast decision-making at a glance.
⚙️ Settings
Core
Status: Filter models based on status
Bias: Controls what model type will be displayed, bullish or bearish
Fractal: Controls the timeframe pairing that will be used
Length: Sets the maximum number of candles allowed for a model to develop
Labels: Display the model label (e.g., C1, C2, Cn)
Unicorn
Zigzag: Adjusts the length of the Zigzag formation
Breaker: Defines the style of Breaker Blocks
Sweeps
Sweep: Shows the sweep that forms a model
I-sweep: Controls the visibility of invalidated sweeps
D-purge: Plots the double purge sweeps
S-area: Highlights the sweep area
Liquidity
Liquidity: Displays the liquidity levels that belong to the model
History
History: Controls the number of past models displayed on the chart
Filters
Asia: Filter models based on Asia Killzone hours
London: Filter models based on London Killzone hours
NY AM: Filter models based on NY AM Killzone hours
NY Launch: Filter models based on NY Launch Killzone hours
NY PM: Filter models based on NY PM Killzone hours
Custom: Filter models based on user Custom hours
HTF
Candles: Controls the number of HTF candles that will be visible on the chart
NY Open: Display True Day Open line
Offset: Controls the distance of HTF from the current chart
Space: Controls the space between HTF candles
Size: Controls the size of HTF candles
PD Array: Displays ICT PD Arrays
CE Line: Style the equilibrium line of PD Array
Border: Style the border of the PD Array
LTF
H/L Line: Displays on the LTF chart the High and Low of each HTF candle
O/C Line: Displays on the LTF chart the Open and Close of each HTF candle
PD Array: Displays ICT PD Arrays
CE Line: Style the equilibrium line of PD Array
Border: Style the border of the PD Array
Standard Deviation
StDev: Controls standard deviation of available levels
Labels: Controls the size of standard deviation levels
Anchor: Controls the anchor point of standard deviation levels (wick, body)
Lines: Controls the line widths and color of standard deviation levels
Dashboard
Panel: Display information about the current model
💡 Framework
The Unicorn Model analyzes price action by combining key elements to identify high-probability trade setups. It detects liquidity sweeps and uses a zigzag method to spot Breaker Blocks. The model maps PD Arrays like Fair Value Gaps and Inversion FVGs for precision zones, integrates macro time filters for context, and projects forward price targets based on liquidity clusters. Together, these components provide a clear framework to anticipate market trends and optimize entries and exits.
The model incorporates the following timeframe pairing:
15s - 5m
1m - 15m
1m - 30m
2m - 20m
3m - 30m
3m - 60m
5m - 1H
15m - 4H
15m - 8H
30m - 9H
30m - 12H
1H - 1D
2H - 2D
3H - 3D
4H - 1W
8H - 2W
12H - 3W
1D - 1M
2D - 2M
1W - 3M
2W - 6M
3W - 9M
1M - 12M
Below are the key components that make up the model:
Sweep
D-purge
Zigzag (Breaker)
PD Arrays (FVG, IFVG)
Macros
Standard Deviation
Liquidity
The Unicorn Model operates through a defined lifecycle that tracks its current stage, helping to assess the validity of potential trade opportunities.
The model's lifecycle includes the following statuses:
Formation (grey)
Invalidation (red)
Success (green)
Through the phases of Formation, Invalidation, and Success, traders can effectively manage positions, minimize risk, and capitalize on the high-probability setups presented by the Unicorn Model.
⚡️ Showcase
The Unicorn Model is an advanced trading framework designed to elevate your market analysis and increase your trading edge. By leveraging smart money concepts and sophisticated pattern detection, it helps you spot key liquidity sweeps, reversal zones, and high-probability setups, enabling more precise entries, exits, and risk management tailored to market structure.
LTF PD Array
LTF PD Arrays are crucial to the Unicorn Model and must align with the Zigzag Breaker for the setup to be considered valid.
HTF PD Array
Higher-Timeframe PD Arrays deliver essential macro context, serving to validate both the direction and momentum of potential reversals.
Timeframe Alignment
Timeframe alignment is a fundamental element of the Unicorn trading model. By integrating multi-timeframe context, the model effectively identifies high-probability models.
Killzone Filters
Filter Unicorn Models according to key market sessions—Asia, London, New York AM, New York Launch, and New York PM—to target periods of high liquidity. This approach improves the accuracy and timing of trade setups by capturing moments when smart money is most active.
Macros
The Unicorn Model uses ICT Macro Times to identify key trading periods when institutional activity is most intense. By syncing setups with these critical windows, the model improves accuracy and provides better context for entries, risk management, and potential reversals.
Gain a trading advantage with the Unicorn Model — your essential tool for clearer insights, smarter decision-making, and more confident trade execution.
🚨 Alerts
This script provides alert options for all model types, which must be configured within TradingView.
Bearish Model
A bearish model alert is triggered when a model forms, signaling a 4 Zigzag points formation and a bearish Breaker.
Bullish Model
A bullish model alert is triggered when a model forms, signaling a 4 Zigzag points formation and a bullish Breaker.
⚠️ Disclaimer
These tools are exclusively available on the TradingView platform.
Our charting tools are intended solely for informational and educational purposes and should not be regarded as financial, investment, or trading advice. They are not designed to predict market movements or offer specific recommendations. Users should be aware that past performance is not indicative of future results and should not rely on these tools for financial decisions. By using these charting tools, the purchaser agrees that the seller and creator hold no responsibility for any decisions made based on information provided by the tools. The purchaser assumes full responsibility and liability for any actions taken and their consequences, including potential financial losses or investment outcomes that may result from the use of these products.
By purchasing, the customer acknowledges and accepts that neither the seller nor the creator is liable for any undesired outcomes stemming from the development, sale, or use of these products. Additionally, the purchaser agrees to indemnify the seller from any liability. If invited through the Friends and Family Program, the purchaser understands that any provided discount code applies only to the initial purchase of Candela's subscription. The purchaser is responsible for canceling or requesting cancellation of their subscription if they choose not to continue at the full retail price. In the event the purchaser no longer wishes to use the products, they must unsubscribe from the membership service, if applicable.
We do not offer reimbursements, refunds, or chargebacks. Once these Terms are accepted at the time of purchase, no reimbursements, refunds, or chargebacks will be issued under any circumstances.
By continuing to use these charting tools, the user confirms their understanding and acceptance of these Terms as outlined in this disclaimer.

FVG# Fair Value Gap (FVG) Indicator
## Overview
The Fair Value Gap (FVG) indicator is a technical analysis tool designed to identify potential areas of price imbalance in the market. These imbalances, known as "fair value gaps," represent discontinuities in price movement where supply and demand were significantly imbalanced, potentially creating zones that price may return to in the future. This indicator was developed by Michele Amori for TradingView and operates as an overlay on price charts.
## Core Concept
Fair Value Gaps occur when price makes a significant move in one direction, leaving behind an area where no trading occurred. Specifically:
- **Bullish FVG**: Forms when the low of the current candle is higher than the high of the candle two positions back, creating an upward gap in price movement.
- **Bearish FVG**: Forms when the high of the current candle is lower than the low of the candle two positions back, creating a downward gap in price movement.
These gaps represent potential "fair value" areas that price may revisit to establish equilibrium between buyers and sellers.
## Visual Representation
The indicator displays FVGs in the following manner:
1. **Bullish FVGs**:
- Represented by semi-transparent green boxes
- Extend from the high of the candle two positions back to the low of the current candle
- Include a dashed green center line representing the middle point of the gap
2. **Bearish FVGs**:
- Represented by semi-transparent red boxes
- Extend from the low of the candle two positions back to the high of the current candle
- Include a dashed red center line representing the middle point of the gap
All FVG boxes and their center lines are extended to the right of the chart, making them visible until they are filled or invalidated.
## Invalidation Logic
The indicator automatically removes FVGs when they are considered filled or invalidated:
- **Bullish FVGs**: Removed when the closing price falls below the bottom of the FVG box, indicating that the upward gap has been filled.
- **Bearish FVGs**: Removed when the closing price rises above the top of the FVG box, indicating that the downward gap has been filled.
This removal only occurs after a candle is confirmed (fully formed), ensuring that premature invalidation doesn't occur during candle formation.
## Technical Implementation
The indicator uses arrays to store and manage the FVG boxes and their center lines. Key features of the implementation include:
- Creation of new FVGs only after candle confirmation
- Dynamic addition and removal of visual elements
- Transparent coloring (75% transparency) for better chart visibility
- Dashed center lines with less transparency (25%) to highlight the middle point of gaps

Gap DetectorGap Detector Indicator
The Gap Detector designed to identify price gaps on a chart, highlighting significant upward and downward gaps based on user-defined thresholds. It visually marks these gaps for easy identification and generates alerts when a gap occurs.
Features
- Customizable Gap Size: Users can define the minimum gap size required for detection.
- Delay Functionality: A user-defined number of bars to wait before confirming and signaling a gap.
- Visual Gap Highlighting: Clearly displays detected gaps as colored boxes on the chart.
- Instant Alerts: Provides alerts immediately after the specified delay, notifying users of the detected gap.
Settings
- Min Gap Size (price points):
- Defines the minimum price difference between consecutive bars required to recognize a gap.
- Default value: `1.0`
- Bars to wait after gap:
- Determines the delay in bars before confirming a detected gap.
- Default value: `2`
How it Works
Gap Detection Logic:
- Gap Up: Identified when the low price of the current bar is higher than the high price of the previous bar, exceeding the minimum gap size.
- Gap Down: Identified when the high price of the current bar is lower than the low price of the previous bar, again exceeding the minimum gap size.
Gap Confirmation and Visualization:
- After detecting a gap, the indicator waits the specified number of bars before confirming.
- Once confirmed, it visually highlights the gap area on the chart:
- Gap Up: Highlighted with a green box.
- Gap Down: Highlighted with a red box.
Alerts:
- Generates clear alerts with descriptive messages:
- Gap direction (Up or Down).
- Gap size in price points.
- Number of bars elapsed since gap detection.
Alert Conditions
- Gap Up Confirmed: Alerts when a gap up is confirmed.
- Gap Down Confirmed: Alerts when a gap down is confirmed.

D3m4h GIFVGDescription
D3m4h GIFVG is an indicator designed to automatically detect market imbalances—often referred to as FVGs (Fair Value Gaps)—and potential pivot-based shifts in market structure. It offers a dynamic approach to visualizing supply/demand inefficiencies and pivot-based trend changes. Key features include:
1. Pivot-Based Bullish/Bearish Detection
The indicator identifies higher-high/lower-low pivot logic as well as “outside bar” pivots.
It tracks when the market transitions from bullish to bearish ranges, or vice versa, by using multiple checks:
Pivot low/high detection
Break-of-structure (when price crosses the last pivot)
Opposing FVG detection to confirm an intraday pivot shift
2. FVG (Fair Value Gap) Detection
The script automatically scans for bullish or bearish FVG conditions:
Bullish FVG: Candle at position (bar_index - 2) has a high below the current candle’s low.
Bearish FVG: Candle at position (bar_index - 2) has a low above the current candle’s high.
When it detects an FVG, it draws a box on the chart to highlight the price gap (yellow boxes by default).
3. Pivot Range FVG
If an FVG forms while the market is in a bullish pivot range, the script can paint a special “blue” FVG to underscore its significance. The same logic applies if a newly formed FVG appears in a bearish pivot range.
4. Filled Gap Cleanup
You can optionally hide standard FVG boxes once they’re filled. For example, if the candle’s body (or candle range) covers that gap, the box is removed to keep your chart clean.
5. Pivot-Range FVG “Raided” Cleanup
If the pivot-based FVG is later filled from the opposing direction, it turns green and can optionally remove itself after a set number of bars.
6. Informative Table
A small table on the chart optionally displays whether or not the pivot-based FVG has been “raided”. You can toggle this table on/off in the settings.
How It Works
1. Pivot Shifts
The script tracks the last pivot high/low using a combination of candle-based pivot detection and break-of-structure checks (when price crosses the last pivot in the opposite direction).
When a shift is detected, the pivot range ID increments—this helps the script know when to remove old pivot-based FVGs or draw new ones.
2. FVG Formation
Each new bar checks if a bullish or bearish FVG formed (comparing the high of bar two bars ago to the current low, or the low of bar two bars ago to the current high).
If one is found, a box is drawn to highlight the imbalance. Its color and extension depend on script settings.
3. Imbalance or Pivot FVG
Standard imbalance boxes appear in yellow.
If the new imbalance coincides with a bullish or bearish pivot range, a special “pivot imbalance” box in blue is drawn.
3. Hide Filled
If a newly formed candle’s body fully covers the FVG, the box is considered filled. If Hide Filled Gaps is enabled, the box is deleted once it’s covered.
4. Raid Status
For the pivot-based (blue) FVG, once price invalidates it from the opposite side, it changes color to green and gets removed after a user-defined number of bars.
How to Use
1. Look for FVGs
Observe yellow boxes to identify potential intraday imbalances. Watch for price returning to fill these zones.
If you see a “blue” box, it signifies a pivot-based FVG in line with a recognized shift in structure—arguably a higher-probability zone.
2. “Hide Filled Gaps”
Turn this on if you only want to see currently active or partially filled imbalances. The script cleans up old, fully covered boxes to keep your chart neat.
3. Pivot Shifts
Note the script’s internal pivot logic. Each new pivot re-defines bullish or bearish states. Use these states to gauge the short-term trend shifts.
4. Toggle the Table
You can show or hide the chart table by enabling/disabling “Show Table” from the inputs. This table indicates if the pivot-based “GIFVG” has been “raided” or not.
5. Extend Count
Adjust the extendCount in the code if you want FVG boxes to extend further or shorter in time.
Underlying Concepts
Fair Value Gaps
Market inefficiencies that occur when price jumps, leaving a “gap” from the candle 2 bars ago to the current candle. They can act like mini supply/demand zones where price may revisit for balance.
Pivot Ranges
The script tries to maintain an internal sense of whether the market is in a bullish or bearish pivot range. When it sees a contrary FVG or break-of-structure, it flips the pivot state.
Outside Bars
A candle that has both a higher high and a lower low than the previous bar. The script uses these to mark significant pivot shifts.
By combining pivot-based logic with FVG detection, the D3m4h GIFVG indicator helps highlight potential areas of liquidity or unfilled value. Traders can use these zones to plan entries/exits or to confirm short-term trend shifts.

FVG ST/RE Detector(v1.0.73)FVG ST/RE Detector
The FVG ST/RE Detector is a powerful technical analysis tool designed to identify market structure and potential trading opportunities through Fair Value Gaps (FVG), Structure Transitions (ST), and Re-entries (RE).
What This Indicator Does:
This indicator identifies and displays:
Fair Value Gaps (FVG): Areas where price has moved so quickly that it has left an imbalance in the market. These gaps represent potential areas where price may return to in the future.
Structure Transitions (ST): Points where the market structure changes from bearish to bullish or vice versa, signaling a potential trend change.
Re-entries (RE): Opportunities to enter the market in the direction of the prevailing trend after a pullback.
Leg Lines: Horizontal lines representing key structural movements in the market, helping traders visualize the market structure more easily.
How It Works:
The indicator detects FVGs when price moves rapidly, creating gaps in market value.
ST points are identified when the direction of FVGs changes from bearish to bullish or vice versa.
RE points are identified when a new FVG forms in the same direction after a pullback.
The indicator tracks and displays the number of consecutive leg lines in the current trend direction.
Key Features:
Customizable colors for bullish and bearish patterns
Optional display of ST and RE labels
Adjustable leg lines with multiple style options
Statistics panel showing the number of legs in the current direction
Alert system for new leg formations
Mitigation tracking to identify when FVGs have been filled
How to Use This Indicator:
Look for ST points to identify potential trend changes
Use RE points to find potential entries in the direction of the prevailing trend
Monitor the number of legs to gauge trend strength
Use FVGs as potential support and resistance areas
Set alerts to be notified of new leg formations
This indicator is suitable for all timeframes and markets, and can be used as part of a comprehensive trading strategy.
本指标的功能:
该指标识别并显示:
公平价值缺口 (FVG):价格快速移动以至于在市场中留下不平衡区域的区间。这些缺口代表价格未来可能回归的潜在区域。
结构转换 (ST):市场结构从看跌转变为看涨或相反的点位,预示潜在的趋势变化。
重新进入 (RE):在回调后沿着主导趋势方向进入市场的机会。
趋势腿线:代表市场中关键结构移动的水平线,帮助交易者更容易地可视化市场结构。

FVG Radar [Mr_Rakun]The FVG Radar indicator is designed to automatically detect Fair Value Gaps (FVG) on your TradingView chart. It visually highlights bullish and bearish gaps with colored boxes and provides alerts when specific conditions are met.
How It Works
Fair Value Gap (FVG) Detection:
The script identifies gaps based on previous price action. A bullish FVG is recognized when there is a gap below a higher low candle, and a bearish FVG when there is a gap above a lower high candle.
Radar Area:
A yellow “Radar Area” box is drawn on the chart using upper and lower bands defined as a percentage above and below the current price. This area helps you visualize where the price is relative to these bands.
Alerts:
Alerts are triggered based on user-defined conditions:
When price crosses half of the gap (if the "Clear FVG When Price Reaches Half" option is enabled).
When price fully fills the gap (if the option is disabled).
The alert will only be activated after waiting a specified number of bars post-gap formation (as set by the "Wait X Bars After FVG Formation" parameter).
Input Parameters
Radar Upper Band (%):
Sets the upper threshold percentage relative to the current price for the radar area.
Radar Lower Band (%):
Sets the lower threshold percentage relative to the current price for the radar area.
Minimum FVG Size (%):
Determines the minimum size (as a percentage) for a gap to be recognized as a valid FVG.
Clear FVG When Price Reaches Half:
If enabled, the FVG will be cleared when the price reaches the midpoint of the gap. If disabled, the entire gap must be filled before it is cleared.
Wait X Bars After FVG Formation:
Specifies the number of bars to wait after an FVG is detected before triggering an alert. This delay helps to avoid premature alerts.
Bullish and Bearish FVG Colors and Opacity:
Customize the appearance of the FVG boxes for bullish (green) and bearish (red) gaps, including the opacity of these visual elements.
How to Use
Add the Indicator:
Load the FVG Radar indicator on your TradingView chart.
Customize Settings:
Adjust the input parameters based on your trading style and the market’s volatility. The radar area settings help you set your own visual reference for price deviations.
Monitor the Chart:
Watch for the colored boxes that represent FVGs. The boxes will display the size of the gap as a percentage.
Respond to Alerts:
When an alert is triggered after the specified number of bars, it indicates that the price has interacted with the gap. Use this information to guide your trading decisions.
Türkçe --------------------------------------------
FVG Radar göstergesi, TradingView grafiğinizde Fair Value Gap (FVG) – yani adil değer boşluklarını – otomatik olarak tespit etmek için tasarlanmıştır. Bu boşluklar, yükseliş ve düşüş boşluklarını farklı renkli kutularla vurgular ve belirli koşullar sağlandığında uyarılar verir.
Nasıl Çalışır
Fair Value Gap (FVG) Tespiti:
Gösterge, önceki fiyat hareketlerine dayalı olarak boşlukları belirler. Yükseliş boşluğu, düşük seviyenin yukarıdaki mumun altındaki boşlukla oluştuğu durumlarda; düşüş boşluğu ise, yüksek seviyenin aşağıdaki mumun üstünde boşluk oluştuğunda tespit edilir.
Radar Alanı:
Grafikte, mevcut fiyata göre belirlenen üst ve alt yüzde bantlarına dayalı olarak sarı renkte “Radar Alanı” kutusu çizilir. Bu alan, fiyatın bu bantlara göre nerede olduğunu görsel olarak anlamanıza yardımcı olur.
Uyarılar:
Kullanıcının belirlediği koşullara göre uyarılar verilir:
Fiyat, boşluğun yarısına ulaştığında (eğer "FVG'nin yarısına ulaştığında temizle" seçeneği etkinse).
Fiyat boşluğu tamamen doldurduğunda (seçenek devre dışı bırakıldığında).
Uyarı, boşluk oluşumundan sonra belirlenen bar sayısı kadar bekledikten sonra tetiklenir ("FVG Oluşumundan Sonra X Bar Bekle" parametresi).
Giriş Parametreleri
Radar Upper Band (%):
Mevcut fiyata göre radar alanı için üst eşik yüzdesini ayarlar.
Radar Lower Band (%):
Mevcut fiyata göre radar alanı için alt eşik yüzdesini ayarlar.
Minimum FVG Size (%):
Bir boşluğun geçerli bir FVG olarak tanınabilmesi için gereken minimum boyutu (yüzde olarak) belirler.
FVG'nin yarısına ulaştığında temizle:
Etkinse, fiyat boşluğun orta noktasına ulaştığında boşluk temizlenir. Devre dışı bırakılırsa, boşluğun tamamen doldurulması gerekir.
FVG Oluşumundan Sonra X Bar Bekle:
Bir FVG tespit edildikten sonra uyarı tetiklenmeden önce beklenmesi gereken bar sayısını belirler. Bu gecikme, erken uyarıların önüne geçmeyi amaçlar.
Yükseliş ve Düşüş FVG Renkleri ve Opaklık:
Yükseliş boşlukları (yeşil) ve düşüş boşlukları (kırmızı) için kutuların görünümünü ve opaklığını özelleştirmenize olanak tanır.
Nasıl Kullanılır
Göstergeyi Ekleyin:
FVG Radar göstergesini TradingView grafiğinize ekleyin.
Ayarları Özelleştirin:
Ticaret tarzınıza ve piyasanın oynaklığına göre giriş parametrelerini ayarlayın. Radar alanı ayarları, fiyat sapmalarını kendi görsel referansınızla tanımlamanıza yardımcı olur.
Grafiği İzleyin:
FVG’leri temsil eden renkli kutuları takip edin. Kutular, boşluğun yüzdelik büyüklüğünü gösterecektir.
Uyarılara Tepki Verin:
Belirlenen bar sayısı sonrasında tetiklenen uyarı, fiyatın boşluk ile etkileşime girdiğini gösterir. Bu bilgiyi, ticaret kararlarınızı yönlendirmek için kullanın.

Dabel MS + FVGThis script is designed to assist traders by identifying market structures, imbalances, and potential trade opportunities using Break of Structure (BOS) and Market Structure Shifts (MSS). It visually highlights imbalances in price action, key pivots, and market structure changes, providing actionable information for making trading decisions.
Key features:
Imbalances Detection: Highlights bullish and bearish price gaps (Fair Value Gaps) using colored boxes. Users can choose the line style (solid, dashed, or dotted) for imbalance midlines.
Market Structure Analysis: Tracks pivot highs and lows to identify BOS and MSS in two separate market structures with adjustable pivot strengths.
Customizable Visualization: Allows users to choose line styles, colors, and display options for both imbalances and market structures.
Alerts: Alerts traders when BOS or MSS occur, helping to monitor the market effectively.
Trading Strategy
Imbalance Trading:
Imbalances (gaps) represent areas where supply or demand was left unfilled. These gaps often act as magnet zones where the price revisits to fill.
Bullish Imbalance: Look for buying opportunities when price enters a green imbalance zone.
Bearish Imbalance: Look for selling opportunities when price enters a red imbalance zone.
Use the midline of the imbalance box as a key reference point for potential reversals.
Break of Structure (BOS) and Market Structure Shift (MSS):
BOS: Indicates a continuation of the existing trend. For example:
Bullish BOS: Look for continuation in the uptrend after a high is broken.
Bearish BOS: Look for continuation in the downtrend after a low is broken.
MSS: Suggests a potential reversal in market structure. For example:
Bullish MSS: Indicates a possible shift from a bearish to bullish market.
Bearish MSS: Indicates a potential shift from a bullish to bearish market.
Multiple Market Structures:
This script provide two sets of market structures, allowing traders to compare short-term and long-term trends.
Adjust the pivot strength to suit your trading style (lower for intraday trading, higher for swing or positional trading).
Entry and Exit:
Entry: Look for entries near imbalances or after confirmed BOS/MSS in line with the overall trend.
Exit: Place stop-loss below/above recent pivots and take profit at nearby support/resistance or imbalance zones.
For New Traders
Focus on Basics: Understand what BOS and MSS mean and how they signal trend direction or reversals.
Use Alerts: Rely on the script's alert system to catch important moments without staring at charts all day.
Start Small: Test this strategy on a demo account before using it live. You can understand it more with practice.
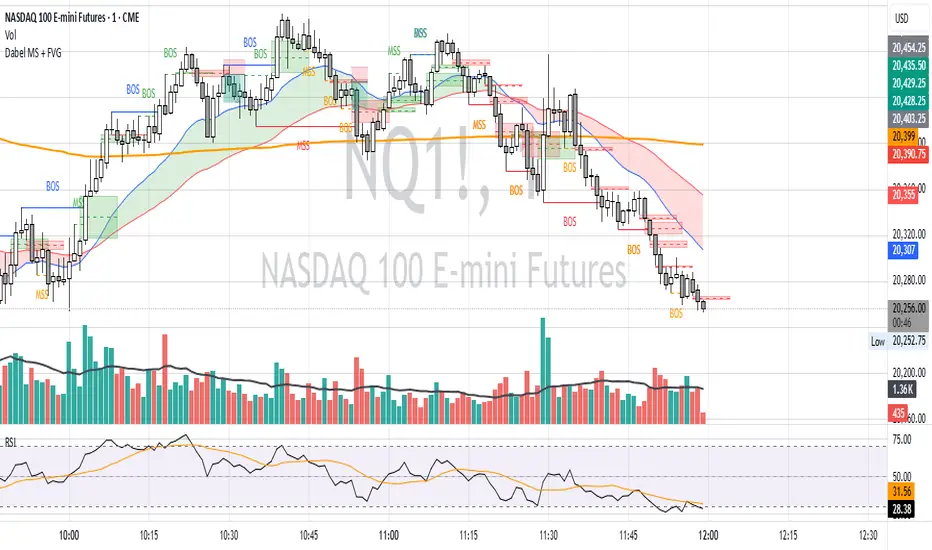
FVG Detector (Gholam version)The Fair Value Gap (FVG) Detector is a powerful tool designed to identify and highlight potential imbalance areas in the market. Fair Value Gaps, also known as "FVG" or "Liquidity Gaps," are price ranges where there has been little or no trading activity. These gaps can often act as key levels of support or resistance and may represent areas where price is likely to return to for a fill, providing potential trading opportunities.
This indicator automatically scans and marks these gaps on the chart, helping traders quickly spot areas of interest for potential reversals or continuation patterns.

FVG Breakout/BreakdownThe FVG Breakout/Breakdown indicator is designed to identify potential breakout and breakdown opportunities in the market, based on the concept of Fair Value Gaps (FVGs). FVGs are areas where price moves too quickly, leaving behind gaps between candlesticks, often seen as areas of inefficiency or imbalance that the market tends to revisit.
Key Concepts:
Fair Value Gaps (FVG):
FVG occurs when a price gap is created between candlesticks, typically when the high of one candle is lower than the low of the previous candle (for a bearish FVG) or the low of one candle is higher than the high of the previous candle (for a bullish FVG).
These gaps represent an imbalance between buying and selling pressure, and the market often revisits them, making them valuable for identifying potential entry points.
Bullish FVG: This occurs when the low of the current candle is higher than the high of the previous candle.
Condition: low > high
Bearish FVG: This occurs when the high of the current candle is lower than the low of the previous candle.
Condition: high < low
Breakout/Breakdown Signals:
Breakout: A bullish breakout signal occurs when the price breaks above a defined resistance level after an FVG gap. This suggests that the market may continue moving higher.
Breakdown: A bearish breakdown signal occurs when the price breaks below a defined support level after an FVG gap. This suggests that the market may continue moving lower.
NWOG (New Week Opening Gap):
The NWOG can be used as an additional factor to confirm the FVG signal. The gap between Friday's close and Monday's open is a crucial level for identifying the start of a new move for the week.
NWOG helps to further refine the timing of breakout or breakdown signals, only triggering them when price moves relative to the Monday Open and shows a new direction.
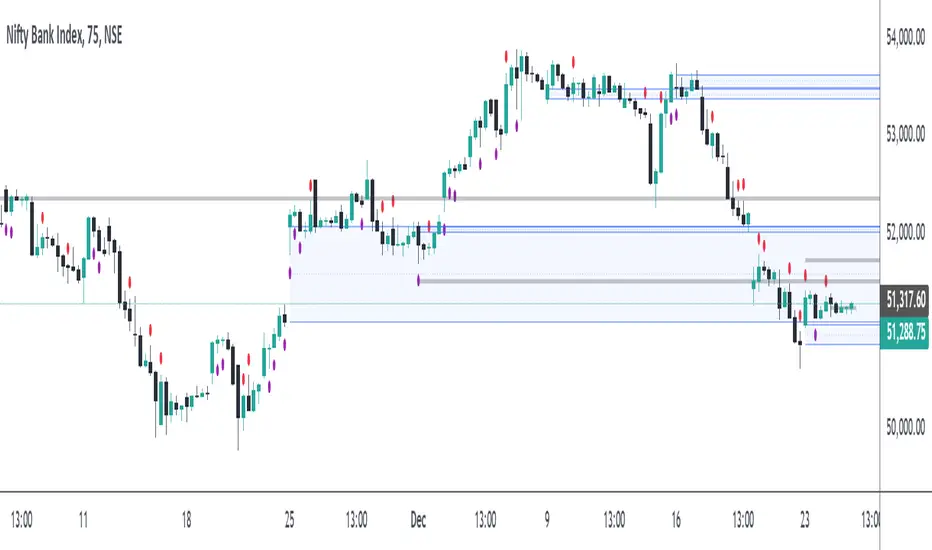
Adaptive Volatility-Scaled Oscillator [AVSO] (Zeiierman)█ Overview
The Adaptive Volatility-Scaled Oscillator (AVSO) is a dynamic trading indicator that measures and visualizes volatility-adjusted market behavior. By scaling various metrics (such as volume, price changes, standard deviation, ATR, and Yang-Zhang volatility) and applying adaptive smoothing, AVSO helps traders identify market conditions where volatility deviates significantly from the norm.
This indicator uses standardized scaling (Z-Score logic) to highlight periods of abnormally high or low volatility relative to recent history. With gradient coloring and clear volatility zones, AVSO provides a visually intuitive way to analyze market volatility and adapt trading strategies accordingly.
█ How It Works
⚪ Scaling Metrics: The indicator scales user-selected metrics (e.g., volume, ATR, standard deviation) relative to the market and price, providing a standardized volatility measure.
⚪ Z-Score Standardization: The scaled metric is normalized using a Z-Score to measure how far current volatility deviates from its recent mean.
Positive Z-Score: Above-average volatility.
Negative Z-Score: Below-average volatility.
⚪ Adaptive Smoothing: An Adaptive EMA smooths the Z-Score, dynamically adjusting its length based on the strength of the volatility. Stronger deviations result in shorter smoothing, increasing responsiveness.
█ Unique Feature: Yang-Zhang Volatility
The Yang-Zhang volatility estimator sets this indicator apart by providing a more robust and accurate measure of volatility compared to traditional methods like ATR or standard deviation.
⚪ What Makes Yang-Zhang Volatility Unique?
Comprehensive Calculation: It combines overnight price gaps (log returns from the previous close to the current open) and intraday price movements (high, low, and close).
Accurate for Gapped Markets: Traditional volatility measures can misrepresent price movement when significant gaps occur between sessions. Yang-Zhang accounts for these gaps, making it highly reliable for assets prone to overnight price jumps, such as stocks, cryptocurrencies, and futures.
Adaptable to Real Market Conditions : By including both close-to-open returns and intraday volatility, it provides a balanced and adaptive measure that captures the full volatility picture.
⚪ Why This Matters to Traders
Better Volatility Insights: Yang-Zhang offers a clearer view of true market volatility, especially in markets with price gaps or uneven trading sessions.
Improved Trade Timing: By identifying volatility spikes and calm periods more effectively, traders can time their entries and exits with greater confidence.
█ How to Use
Identify High and Low Volatility
A high Z-Score (>2) indicates significant market volatility. This can signal momentum-driven moves, breakouts, or areas of increased risk.
A low Z-Score (<-2) suggests low volatility or a calm market environment. This often occurs before a potential breakout or reversal.
Trade Signals
High Volatility Zones (background highlight): Monitor for potential breakouts, trend continuations, or reversals.
Low Volatility Zones: Anticipate range-bound conditions or upcoming volatility spikes.
█ Settings
Source: Select the price source for scaling calculations (close, high, low, open).
Metric Measure: Choose the volatility measure:
Volume: Scales raw volume.
Close: Uses closing price changes.
Standard Deviation: Price dispersion.
ATR: Average True Range.
Yang: Yang-Zhang volatility estimate.
Bars to Analyze: Number of historical bars used to calculate the mean and standard deviation of the scaled metric.
ATR / Standard Deviation Period: Lookback period for ATR or Standard Deviation calculation.
Yang Volatility Period: Period for the Yang-Zhang volatility estimator.
Smoothing Period: Base smoothing length for the adaptive smoothing line.
-----------------
Disclaimer
The information contained in my Scripts/Indicators/Ideas/Algos/Systems does not constitute financial advice or a solicitation to buy or sell any securities of any type. I will not accept liability for any loss or damage, including without limitation any loss of profit, which may arise directly or indirectly from the use of or reliance on such information.
All investments involve risk, and the past performance of a security, industry, sector, market, financial product, trading strategy, backtest, or individual's trading does not guarantee future results or returns. Investors are fully responsible for any investment decisions they make. Such decisions should be based solely on an evaluation of their financial circumstances, investment objectives, risk tolerance, and liquidity needs.
My Scripts/Indicators/Ideas/Algos/Systems are only for educational purposes!