Wolfe Strategy [Trendoscope]Hello Everyone,
Wish you all Merry X-Mas and happy new year. Lets start 2023 with fresh new strategy built on Wolfe Indicator. Details of the indicator can be found here
🎲 Wolfe Concept
Wolfe concept is simple. Whenever a wedge is formed, draw a line joining pivot 1 and 4 as shown in the chart below:
For simplicity, we will only consider static value for Target and Stop. But, entry is done based on breaking the triangle. Revised strategy looks something like this:
🎲 Settings
Settings are simple and details of each are provided via tooltips.
Out of these, the most important one is minimum risk reward ratio. If you set lower risk reward threshold then losing few trades may generate more losses than more winning trades. Similarly higher value will filter out most of the trades and may not work efficiently. Default value set to 1 to make sure optimal risk reward is present before placing trade. Also make note that since the entry bar is always moving towards stop, as and when pattern progress, the RR will also increase. Hence, a pattern which is below RR threshold may become good to trade at certain point of time in future.
🎲 Strategy Parameters
Default strategy parameters are initialised via definition. Margins are set to 100 to disable leveraged trades. Appropriate values are chosen for other parameters. These can be altered based on individual strategy and trading plan.
As the strategy concentrates on the single pattern, number of trades generated are comparatively less. But, there is chance to increase the algorithm further to catch more such patterns on larger scale. Will try to work on them in next versions.
🎲 Pine Strategy limitations
Backtest can only be done on one direction as pine strategy cannot have both long and short open trades together. Hence, it is mandatory to chose either long/short trades in settings.
Since pyramiding is limited to 1, there is possibility of a pattern not generating trade even though the entry conditions are met. They are just based on pine limitations and not necessarily mean patterns are not good for placing trades.
在脚本中搜索"harmonic"

mess JBI have made an all in one powerful script. It contains all meme lines(Moving average, Ema, Dema, Vwma, Hma)
In general, orange color means negative and white means positive. But you can very easily customize the colors according to your need and enable and disable any meme line.
Dots represent change of price action, although it works on every time frame but I have got best results on 15minute and 4hour Time Frame.
Cross represent change in volume. Now that's the most powerful thing, I have picked time segmented oscillator and changed the cod to represent Volume change. To take a better note of market, Start from Bigger Time frames. This indicator predicted every move Perfectly.
Enjoy

Cup & HandleHi, here is my take on 'Cup & Handle'
Pivot Points - ph (highest points in a certain period) are stored in an array
When there is a new ph , previous ph's are compared to the latest one.
A temporary test line is drawn between these 2 points.
The script checks if a close (between these 2 points) doesn't break above this test line.
(test line is deleted afterwards)
If it doesn't, and the '% max breaks' are not breached, 2 circle shaped lines are drawn
(Top & Bottom line of the cup) which forms the Cup, together with the Handle.
The red box (Handle) is the maximum 33-50% retracement (% of cup height)
-> Only the latest pattern is shown, enabling 'Show Cup labels' shows the position of cup patterns in history.
They can be visualised by using 'Bar Replay'
'% max breaks' -> 'maximum highs/lows breaking through the Top/Bottom line
(% of bars between left & right extreme points of the Cup)
Settings:
- 'Left', 'Right' -> regulates Pivot Point values
- 'PP back' -> max lookback for Pivot High
More explanation can be found in following print screens,
or by checking the tooltips in the settings
Cheers!

Crab Range FinderFinds the "crab range" of current price action.
///////
The lines corresponds are follows:
Green line represents the average high price
Orange line represents the median price
Yellow line represents the average low price
///////
By default, the last 5 bars are used when calculating the price lines, this value can be changed in settings as needed to tune for accuracy.

Wedge and Flag Finder (Multi - zigzag)Here is a small attempt to automatically identify wedges and flags.
Tradingview standard wedge checks for only 4 pivots. In this version, I have considered 5 pivots instead - which can help reduce noise as 4 pivots forming wedge can be quite common. In future, will also try to add more pivots in pattern recognition to make the signal more accurate.
If wedge comes with a tail, then it is marked as flag :)
Settings are quite simple and they are as shown below

CyclesTime based indicator attempting to show changes in a cycle based on the different time elapsed between new highs and new lows in a given time period. Useful when combined with elliott wave price structure. A drop above/below 0 suggests a wave 4 whilst new highs/lows of the indicator suggest whether a bullish or bearish trend is in place. You can change the time cycle as you like. Any Q's please post, i'll be happy to answer them. (If I can)

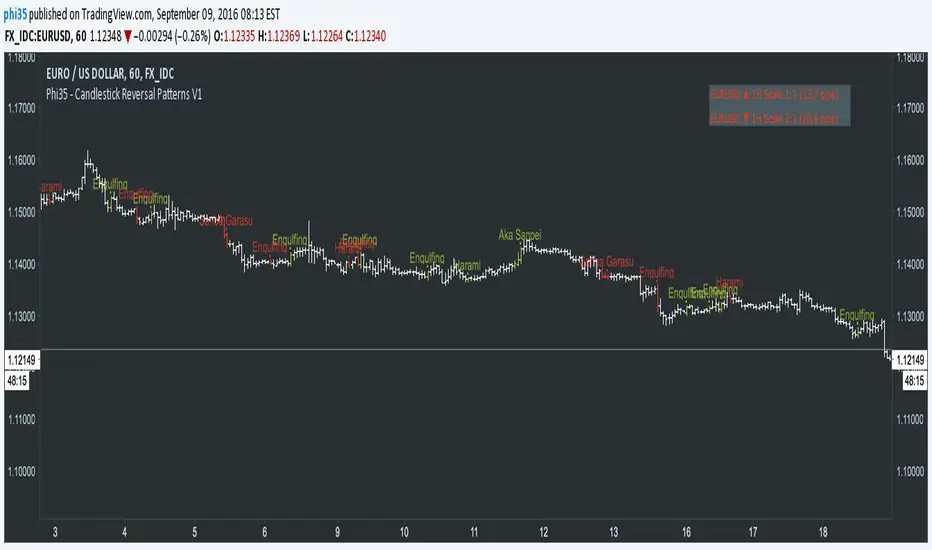
Phi35 - Candlestick Reversal Patterns V1 ©Candlestick Reversal Pattern V1 by Phi35 - 9rd September 2016 ©
Check also my " Candlestick Continuation Pattern " indicator which will follow soon!
Do not modify the code without my permission!
If there is an issue or any suggestions, feel free to contact me on the link below
www.tradingview.com
www.tradingview.com
It seems to work well but still no guarantee on completeness!
RISK WARNING! PAST PERFORMANCE IS NOT NECESSARILY INDICATIVE OF FUTURE RESULTS. IN MAKING AN INVESTMENT DECISION, TRADERS MUST RELY ON THEIR OWN EXAMINATION OF THE ENTITY MAKING THE TRADING DECISIONS!
Wait always for confirmation (next opening price or closing price)!!
RECOGNIZABLE REVERSAL PATTERNS
01.Engulfing
02.Harami
03.Piercing Line
04.Morning Star
05.Evening Star
06.Belt Hold
07.Three White Soldiers
08.Three Black Crows
09.Three Stars in the South
10.Stick Sandwich
11.Meeting Line
12.Kicking
13.Ladder Bottom
Although the Engulfing and Harami Patterns are important but can occur too often and give false signals, I give you the option to turn them completely off.
Donchian Fibo Channels v2Updated and fixed version of DFC.
- fixed bugs
- added permanent setting for direction
- added color change for terminal and breakout bars
- added smart timings for line of 100% retracement


Spinning TopsThis is my script for a spinning top. It is just another form of a doji. It is an indecision bar. Enjoy.

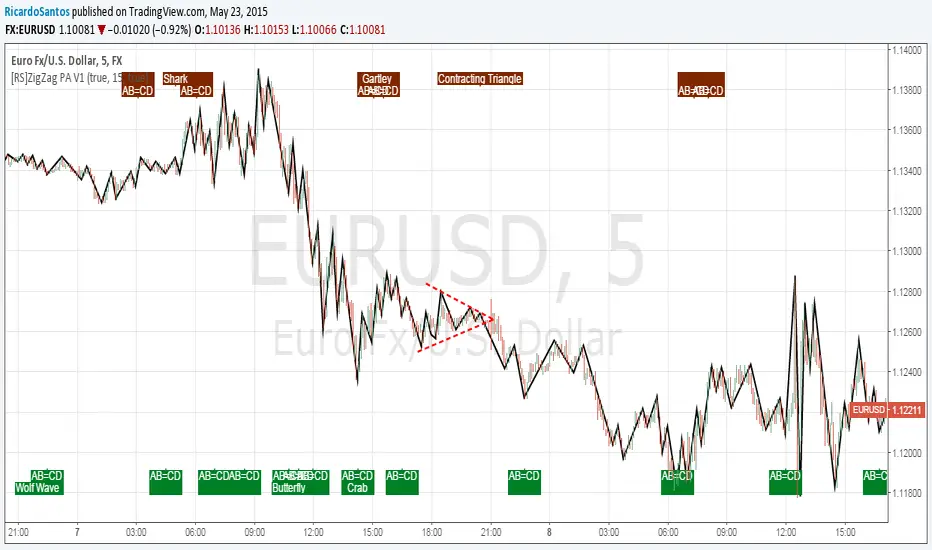
[RS]ZigZag PA V1ZigZag Based on price oscilation.
added pattern recognition, also added recognition of head and shoulders and contracting/expanding triangles to previous list of patterns :p
Use Alt Timeframe: enables optional timeframes, use higher timeframes to reduce noise.
Timeframe: said Alt Timeframe.
Show Patterns: toggles Pattern Recognition on.
[RS]Simple ZigZag V3EXPERIMENTAL:
optional:
custom timeframe
custom fib ab_extension/bc_retrace zone
Display base zigzag
Display zigzag
Display Tops and Bottoms Lines
Display Fib. Ret./Ext.
Display Pattern Recognition

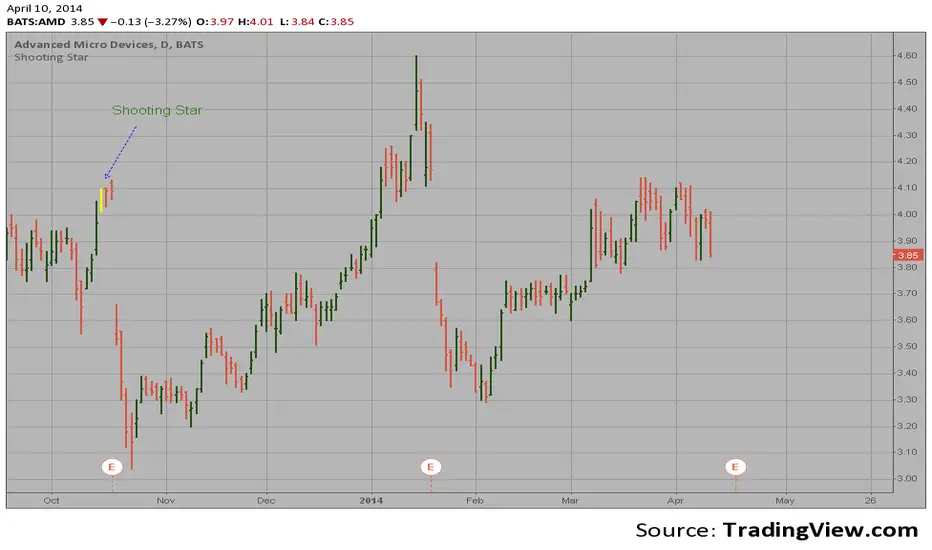
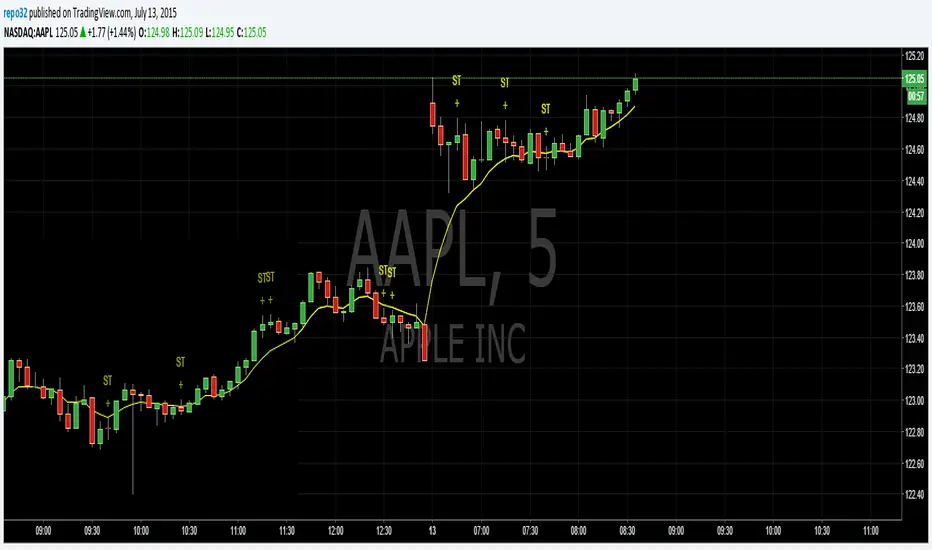
Shooting Star automatic finding scriptHi
Let me introduce my Shooting Star automatic finding script.
This is a bearish reversal candlestick which occurs in an uptrend. It has a long
upper shadow with little, or no lower shadow, and a small real body near the lows
of the session.