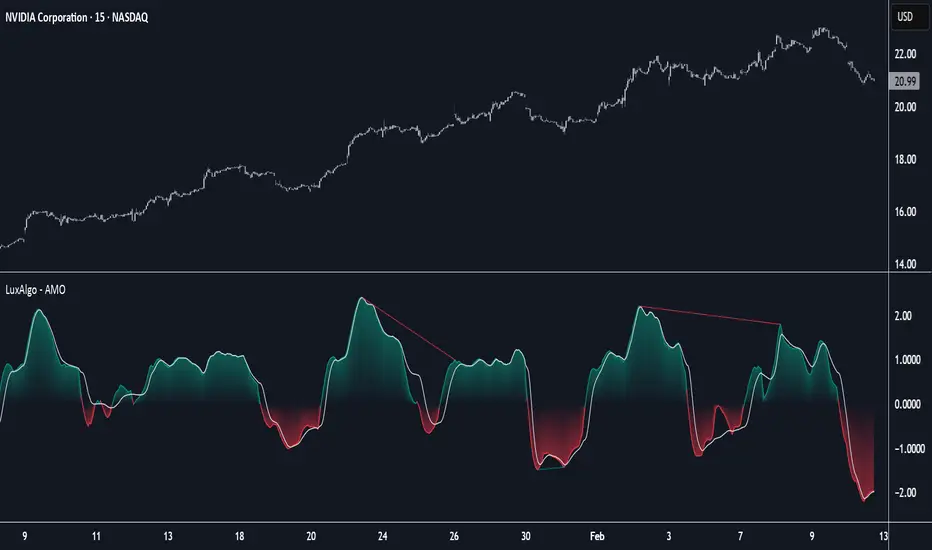
Adaptive Momentum Oscillator [LuxAlgo]The Adaptive Momentum Oscillator tool allows traders to measure the current relative momentum over a given period using the maximum delta in price.
It features a histogram with gradient color, divergences, and an adaptive moving average that allows traders to clearly see the smoothed trend direction.
🔶 USAGE
This unbounded oscillator has positive momentum when values are above 0 and negative momentum when values are below 0. The adaptive moving average is used as a minimum lag smoothing tool over the momentum histogram.
🔹 Signal Line
There are two main uses for the signal line drawn on the chart above.
Momentum crosses above or below the signal line: acceleration in momentum.
Signal line crosses the 0 value: positive or negative momentum.
🔹 Data Length
On the chart above, we can compare different length sizes and how the tool values change, allowing traders to get a shorter or longer-term view of current market strength.
🔹 Smoothing Length
In the previous figure, we can compare how different Smoothing Length values affect the oscillator output.
🔹 Divergences
The divergence detector is disabled by default. Traders can enable it and adjust the divergence length from the settings panel.
As we can see in the chart above, by changing the length of the divergences, traders can fine-tune their detection, a small number will detect smaller divergences, and use a larger number for larger divergences.
🔶 SETTINGS
Data: Select data source, close price by default
Data Length: Select the length for data gathering
Smoothing Length: Select the length for data smoothing
Divergences: Enable/Disable divergences detection and length
在脚本中搜索"histogram"
ADR% Extension Levels from SMA 50I created this indicator inspired by RealSimpleAriel (a swing trader I recommend following on X) who does not buy stocks extended beyond 4 ADR% from the 50 SMA and uses extensions from the 50 SMA at 7-8-9-10-11-12-13 ADR% to take profits with a 20% position trimming.
RealSimpleAriel's strategy (as I understood it):
-> Focuses on leading stocks from leading groups and industries, i.e., those that have grown the most in the last 1-3-6 months (see on Finviz groups and then select sector-industry).
-> Targets stocks with the best technical setup for a breakout, above the 200 SMA in a bear market and above both the 50 SMA and 200 SMA in a bull market, selecting those with growing Earnings and Sales.
-> Buys stocks on breakout with a stop loss set at the day's low of the breakout and ensures they are not extended beyond 4 ADR% from the 50 SMA.
-> 3-5 day momentum burst: After a breakout, takes profits by selling 1/2 or 1/3 of the position after a 3-5 day upward move.
-> 20% trimming on extension from the 50 SMA: At 7 ADR% (ADR% calculated over 20 days) extension from the 50 SMA, takes profits by selling 20% of the remaining position. Continues to trim 20% of the remaining position based on the stock price extension from the 50 SMA, calculated using the 20-period ADR%, thus trimming 20% at 8-9-10-11 ADR% extension from the 50 SMA. Upon reaching 12-13 ADR% extension from the 50 SMA, considers the stock overextended, closes the remaining position, and evaluates a short.
-> Trailing stop with ascending SMA: Uses a chosen SMA (10, 20, or 50) as the definitive stop loss for the position, depending on the stock's movement speed (preferring larger SMAs for slower-moving stocks or for long-term theses). If the stock's closing price falls below the chosen SMA, the entire position is closed.
In summary:
-->Buy a breakout using the day's low of the breakout as the stop loss (this stop loss is the most critical).
--> Do not buy stocks extended beyond 4 ADR% from the 50 SMA.
--> Sell 1/2 or 1/3 of the position after 3-5 days of upward movement.
--> Trim 20% of the position at each 7-8-9-10-11-12-13 ADR% extension from the 50 SMA.
--> Close the entire position if the breakout fails and the day's low of the breakout is reached.
--> Close the entire position if the price, during the rise, falls below a chosen SMA (10, 20, or 50, depending on your preference).
--> Definitively close the position if it reaches 12-13 ADR% extension from the 50 SMA.
I used Grok from X to create this indicator. I am not a programmer, but based on the ADR% I use, it works.
Below is Grok from X's description of the indicator:
Script Description
The script is a custom indicator for TradingView that displays extension levels based on ADR% relative to the 50-period Simple Moving Average (SMA). Below is a detailed description of its features, structure, and behavior:
1. Purpose of the Indicator
Name: "ADR% Extension Levels from SMA 50".
Objective: Draw horizontal blue lines above and below the 50-period SMA, corresponding to specific ADR% multiples (4, 7, 8, 9, 10, 11, 12, 13). These levels represent potential price extension zones based on the average daily percentage volatility.
Overlay: The indicator is overlaid on the price chart (overlay=true), so the lines and SMA appear directly on the price graph.
2. Configurable Inputs
The indicator allows users to customize parameters through TradingView settings:
SMA Length (smaLength):
Default: 50 periods.
Description: Specifies the number of periods for calculating the Simple Moving Average (SMA). The 50-period SMA serves as the reference point for extension levels.
Constraint: Minimum 1 period.
ADR% Length (adrLength):
Default: 20 periods.
Description: Specifies the number of days to calculate the moving average of the daily high/low ratio, used to determine ADR%.
Constraint: Minimum 1 period.
Scale Factor (scaleFactor):
Default: 1.0.
Description: An optional multiplier to adjust the distance of extension levels from the SMA. Useful if levels are too close or too far due to an overly small or large ADR%.
Constraint: Minimum 0.1, increments of 0.1.
Tooltip: "Adjust if levels are too close or far from SMA".
3. Main Calculations
50-period SMA:
Calculated with ta.sma(close, smaLength) using the closing price (close).
Serves as the central line around which extension levels are drawn.
ADR% (Average Daily Range Percentage):
Formula: 100 * (ta.sma(dhigh / dlow, adrLength) - 1).
Details:
dhigh and dlow are the daily high and low prices, obtained via request.security(syminfo.tickerid, "D", high/low) to ensure data is daily-based, regardless of the chart's timeframe.
The dhigh / dlow ratio represents the daily percentage change.
The simple moving average (ta.sma) of this ratio over 20 days (adrLength) is subtracted by 1 and multiplied by 100 to obtain ADR% as a percentage.
The result is multiplied by scaleFactor for manual adjustments.
Extension Levels:
Defined as ADR% multiples: 4, 7, 8, 9, 10, 11, 12, 13.
Stored in an array (levels) for easy iteration.
For each level, prices above and below the SMA are calculated as:
Above: sma50 * (1 + (level * adrPercent / 100))
Below: sma50 * (1 - (level * adrPercent / 100))
These represent price levels corresponding to a percentage change from the SMA equal to level * ADR%.
4. Visualization
Horizontal Blue Lines:
For each level (4, 7, 8, 9, 10, 11, 12, 13 ADR%), two lines are drawn:
One above the SMA (e.g., +4 ADR%).
One below the SMA (e.g., -4 ADR%).
Color: Blue (color.blue).
Style: Solid (style=line.style_solid).
Management:
Each level has dedicated variables for upper and lower lines (e.g., upperLine1, lowerLine1 for 4 ADR%).
Previous lines are deleted with line.delete before drawing new ones to avoid overlaps.
Lines are updated at each bar with line.new(bar_index , level, bar_index, level), covering the range from the previous bar to the current one.
Labels:
Displayed only on the last bar (barstate.islast) to avoid clutter.
For each level, two labels:
Above: E.g., "4 ADR%", positioned above the upper line (style=label.style_label_down).
Below: E.g., "-4 ADR%", positioned below the lower line (style=label.style_label_up).
Color: Blue background, white text.
50-period SMA:
Drawn as a gray line (color.gray) for visual reference.
Diagnostics:
ADR% Plot: ADR% is plotted in the status line (orange, histogram style) to verify the value.
ADR% Label: A label on the last bar near the SMA shows the exact ADR% value (e.g., "ADR%: 2.34%"), with a gray background and white text.
5. Behavior
Dynamic Updating:
Lines update with each new bar to reflect new SMA 50 and ADR% values.
Since ADR% uses daily data ("D"), it remains constant within the same day but changes day-to-day.
Visibility Across All Bars:
Lines are drawn on every bar, not just the last one, ensuring visibility on historical data as well.
Adaptability:
The scaleFactor allows level adjustments if ADR% is too small (e.g., for low-volatility symbols) or too large (e.g., for cryptocurrencies).
Compatibility:
Works on any timeframe since ADR% is calculated from daily data.
Suitable for symbols with varying volatility (e.g., stocks, forex, cryptocurrencies).
6. Intended Use
Technical Analysis: Extension levels represent significant price zones based on average daily volatility. They can be used to:
Identify potential price targets (e.g., take profit at +7 ADR%).
Assess support/resistance zones (e.g., -4 ADR% as support).
Measure price extension relative to the 50 SMA.
Trading: Useful for strategies based on breakouts or mean reversion, where ADR% levels indicate reversal or continuation points.
Debugging: Labels and ADR% plot help verify that values align with the symbol’s volatility.
7. Limitations
Dependence on Daily Data: ADR% is based on daily dhigh/dlow, so it may not reflect intraday volatility on short timeframes (e.g., 1 minute).
Extreme ADR% Values: For low-volatility symbols (e.g., bonds) or high-volatility symbols (e.g., meme stocks), ADR% may require adjustments via scaleFactor.
Graphical Load: Drawing 16 lines (8 upper, 8 lower) on every bar may slow the chart for very long historical periods, though line management is optimized.
ADR% Formula: The formula 100 * (sma(dhigh/dlow, Length) - 1) may produce different values compared to other ADR% definitions (e.g., (high - low) / close * 100), so users should be aware of the context.
8. Visual Example
On a chart of a stock like TSLA (daily timeframe):
The 50 SMA is a gray line tracking the average trend.
Assuming an ADR% of 3%:
At +4 ADR% (12%), a blue line appears at sma50 * 1.12.
At -4 ADR% (-12%), a blue line appears at sma50 * 0.88.
Other lines appear at ±7, ±8, ±9, ±10, ±11, ±12, ±13 ADR%.
On the last bar, labels show "4 ADR%", "-4 ADR%", etc., and a gray label shows "ADR%: 3.00%".
ADR% is visible in the status line as an orange histogram.
9. Code: Technical Structure
Language: Pine Script @version=5.
Inputs: Three configurable parameters (smaLength, adrLength, scaleFactor).
Calculations:
SMA: ta.sma(close, smaLength).
ADR%: 100 * (ta.sma(dhigh / dlow, adrLength) - 1) * scaleFactor.
Levels: sma50 * (1 ± (level * adrPercent / 100)).
Graphics:
Lines: Created with line.new, deleted with line.delete to avoid overlaps.
Labels: Created with label.new only on the last bar.
Plots: plot(sma50) for the SMA, plot(adrPercent) for debugging.
Optimization: Uses dedicated variables for each line (e.g., upperLine1, lowerLine1) for clear management and to respect TradingView’s graphical object limits.
10. Possible Improvements
Option to show lines only on the last bar: Would reduce visual clutter.
Customizable line styles: Allow users to choose color or style (e.g., dashed).
Alert for anomalous ADR%: A message if ADR% is too small or large.
Dynamic levels: Allow users to specify ADR% multiples via input.
Optimization for short timeframes: Adapt ADR% for intraday timeframes.
Conclusion
The script creates a visual indicator that helps traders identify price extension levels based on daily volatility (ADR%) relative to the 50 SMA. It is robust, configurable, and includes debugging tools (ADR% plot and labels) to verify values. The ADR% formula based on dhigh/dlow

Market Correlation AnalysisMarket Correlation Analysis is an indicator that measures the correlation of any two instruments.
To express price changes in a way that is comparable, this indicator uses a percentage of the ATR as a unit.
User Inputs:
Other Symbol - the symbol which we want to compare with the symbol of the main chart.
ATR for Price Movement Normalisation - I recommend high values to get the ATR more stable across time - if the ATR drastically changes, the indicator will register that as a price movement, because the unit in which price movements are measured itself changed by a lot. However, with higher values the ATR is stable and, in my opinion, more reliable than simply a percentage change of the current price.
Correlation Length - this is the number of bars for which the correlation coefficient will be calculated.
About The Indicator:
Market Correlation Analysis expresses the price changes of both instruments in question on the same histogram.
By default, the price changes that represent the instrument of the main chart are expressed with thinner bars of stronger colour, while the price changes that represent the other instrument are expressed with much thicker bars, which are of more pale colour.
The correlation coefficient is not expressed on the histogram, as it has a different scale. Therefore, it is only showed as a number.
I hope this indicator can make it easier to understand just how much two instruments have been similar to one another over a certain period of time. The possibility to see the correlation for any given time frame can give information that very specific to any trading style.

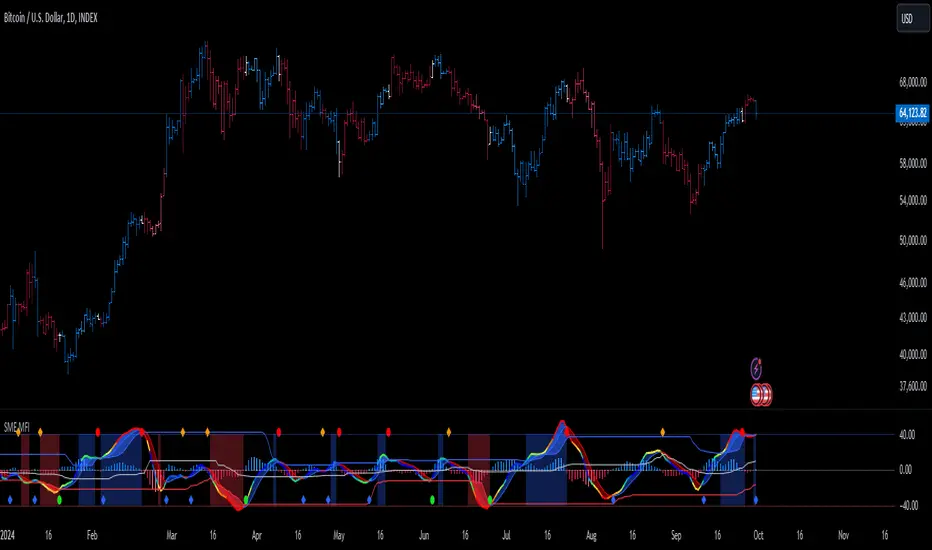
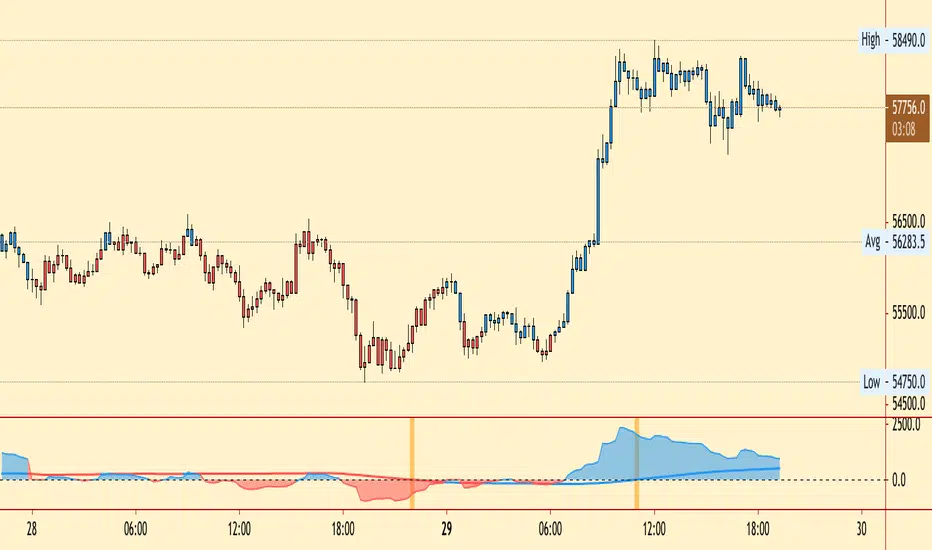
SMI Ergodic Indicator/Oscillator of Money Flow Index▮ Introduction
The Stochastic Momentum Index Ergodic (SMII) indicator is a technical analysis tool designed to predict trend reversals in the price of an asset.
It functions as a momentum oscillator, measuring the ratio of the smoothed price change to the smoothed absolute price change over a given number of previous periods.
The Ergodic SMI is based on the True Strength Index (TSI) and integrates a signal line, which is an exponential moving average (EMA) of the SMI indicator itself.
The Ergodic SMI oscillator provides a clearer picture of market trends than the traditional stochastic oscillator by incorporating the concept of 'ergodicity', which helps remove market noise.
On ther other hand, MFI (Money Flow Index) is a technical analysis indicator used to measure the inflow of money into an asset and thus help identify buying and selling pressure in a given financial instrument.
When these two indicators are combined, they can provide a more comprehensive view of price direction and market strength.
▮ Motivation: why another indicator?
By combining SMII with MFI, we can gain even more insights into the market.
One way to do this is to use the MFI as an input to the SMII, rather than just using price.
This means we are measuring momentum based on buying and selling pressure rather than just price.
Furthermore, there is the possibility of making several fine adjustments to both the calculation and visualization parameters that are not present in other indicators.
▮ What to look for
When using the SMII MFI indicator, there are a few things to look out for.
First, look at the SMII signal line.
When the line crosses above -40, it is considered a buy signal, while the crossing below +40 is considered a sell signal.
Also, pay attention to divergences between the SMII and the price.
If price is rising but the SMII is showing negative divergence, it could indicate that momentum is waning and a reversal could be in the offing.
Likewise, if price is falling but the SMII is showing positive divergence, this could indicate that momentum is building and a reversal could also be in the offing.
Divergences can be considered in both indicator and/or histogram.
Examples:
▮ Notes
The indicator presented here offers both the 'SMII' and the 'SMIO', that is, the 'Stochastic Momentum Index Ergodic Indicator' together with the 'Stochastic Momentum Index Ergodic Oscillator' (histogram), as per the documentation described in reference links.
So it is important to highlight the differences in relation to my other indicator, the 'Stochastic Momentum Index (SMI) of Money Flow Index (MFI)':
This last one is purely based on the SMI , which is implemented using SMA smoothing for the relative range and the high/low range.
Although they may seem the same in some situations, the calculation is actually different. The TSI tends to be more responsive at the expense of being noisier, while the SMI tends to be smoother. Which of these two indicators is best depends on the situation, the context, and the analyst's personal preference.
Please refer to reference links to more info.
▮ References
SMI documentation
SMII documentation
SMIO documentation
MFI documentation
slope-velocityDescription
This Pine Script indicator, named "slope-velocity," calculates and visualizes the slope of a moving average (MA) in degrees, allowing users to observe the rate of change of the MA over time. Here's a breakdown of its components and functionality:
Inputs:
option: A dropdown menu allowing the user to select the type of moving average (SMA, EMA, DEMA).
length: An integer input for specifying the period length of the moving average.
source: The data source for the moving average calculation, defaulting to the close price.
Variable Initialization:
ma: A variable to store the moving average value, initialized as na.
Moving Average Calculation:
Depending on the selected option, the script calculates the appropriate moving average:
ta.sma(source, length) for Simple Moving Average (SMA).
ta.ema(source, length) for Exponential Moving Average (EMA).
ta.dema(source, length) for Double Exponential Moving Average (DEMA).
Slope Calculation:
slope_ma: The script calculates the slope of the moving average by subtracting the previous period's MA value from the current period's MA value (ma - ma ).
Slope Conversion to Degrees:
slope_degrees_ma: The slope is converted to degrees using the math.atan function to compute the arctangent of the slope, followed by math.todegrees to convert the result from radians to degrees. The result is rounded to the nearest integer using math.round.
Plotting Reference Lines:
Horizontal lines are plotted at specific degree values (0, 10, 20, -10, -20) to provide reference points for the slope's visualization.
Plotting the Slope:
The slope in degrees is plotted as a histogram. The color of the histogram bars is determined by the sign of the slope: green for positive slopes and red for negative slopes.
Additional Comments
The script includes some commented-out sections related to plotting acceleration and displaying labels for slope differences, which are not active in the current implementation.
The script is designed to provide a visual representation of the moving average's rate of change, making it easier to identify periods of rapid price movement and potential trend reversals.

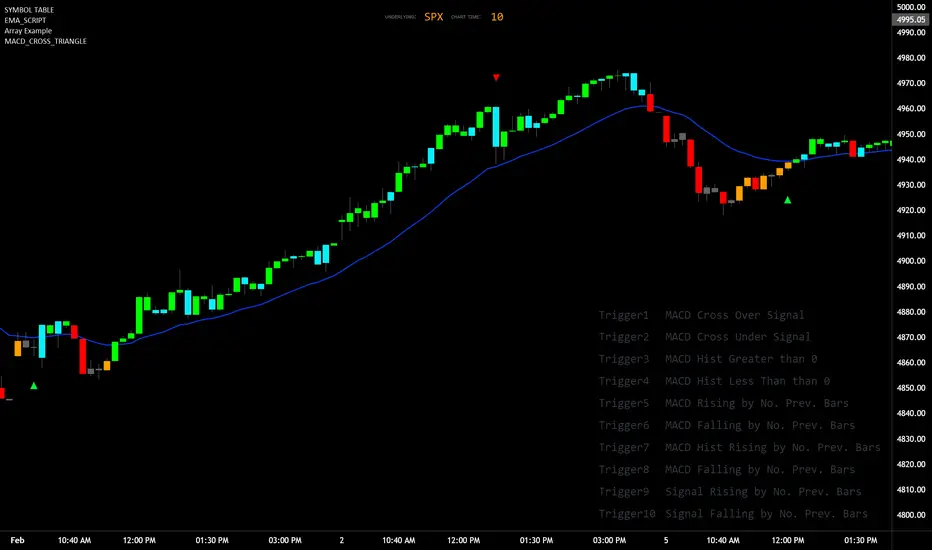
MACD_TRIGGER_CROSS_TRIANGLEMACD Triangle Trigger Indicator by thebearfib
Overview
The MACD Cross Triangle Indicator is a powerful tool for traders who rely on the MACD's signal line crossovers to make informed trading decisions. This indicator enhances the traditional MACD by allowing users to customize triggers for bullish and bearish signals and by displaying these signals directly on the chart with visually distinctive labels.
Features
Customizable Color Scheme: Choose distinct colors for bullish and bearish signals to fit your chart's theme or your personal preference.
Flexible Trigger Conditions: Select from a variety of trigger conditions based on MACD and signal line behaviors over a specified number of bars back.
Visual Signal Indicators: Bullish and bearish signals are marked with upward and downward triangles, making it easy to spot potential entry or exit points.
Detailed Trigger Descriptions: A comprehensive table lists all available triggers and their descriptions, aiding in selection and understanding of each trigger's mechanism.
Configuration Options
Bullish and Bearish Colors: Customize the color of the labels for bullish (upward) and bearish (downward) signals.
Trend Lookback Period: Choose how far back (in bars) the indicator should look to determine the trend, affecting the calculation of certain triggers.
Trigger Selection for Bullish and Bearish Signals: Pick specific triggers for both bullish and bearish conditions from a list of 10 different criteria, ranging from MACD crossovers to historical comparisons of MACD, signal line, and histogram values.
Label Size and Font Settings: Adjust the size of the signal labels on the chart and the font size of the trigger descriptions table to ensure readability and fit with your chart layout.
Trigger Descriptions Table Position and Color: Customize the position and color of the trigger descriptions table to match your chart's aesthetic and layout preferences.
Trigger Mechanisms
Trigger 1 to 10: Each trigger corresponds to a specific condition involving the MACD line, signal line, and histogram. These include crossovers, directional changes compared to previous bars, and comparisons of current values to historical values.
Usage
1. Select Trigger Conditions: Choose the desired triggers for bullish and bearish signals based on your trading strategy.
2. Customize Visuals: Set your preferred colors for the bullish and bearish labels, adjust label and font sizes, and configure the trigger descriptions table.
3. Analyze Signals: Watch for the upward (bullish) and downward (bearish) triangles to identify potential trading opportunities based on MACD crossover signals.
Conclusion
The MACD Cross Triangle Indicator offers a customizable and visually intuitive way to leverage MACD crossover signals for trading. With its flexible settings and clear signal indicators, traders can tailor the indicator to fit their strategy and improve their decision-making process on TradingView.
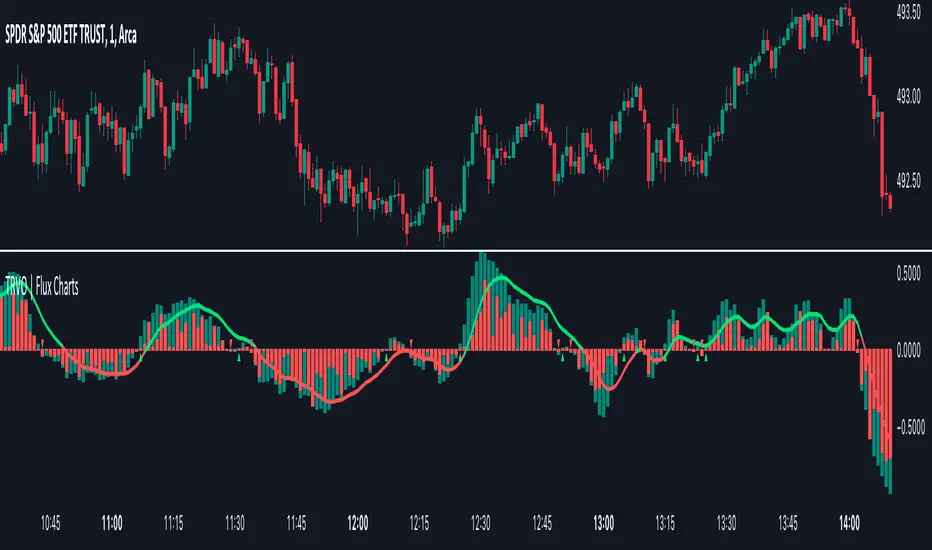
Time Relative Volume Oscillator | Flux Charts💎 GENERAL OVERVIEW
The relative volume indicator aims to improve upon the default existing relative volume indicator by comparing volumes between previous trading sessions rather than previous candles. As such, it works best on lower time frames as there is more data to compare with. The purpose of the indicator is to show how the current bar’s volume compares to the volume at the same time on previous trading days.
There exists a couple different modes and combinations that each provide a different perspective on the trading volume.
Oscillator mode
Oscillator mode starts with the same relative volume calculation, but adds two EMAs of different lengths that diverge and converge. Like the MACD, it plots the difference as a histogram. This functions as an easy way to view when relative volume is increasing or decreasing.
How to use:
The oscillator oscillates between -1 and 1. It moves along with volume direction, so this mode can be used to view the current volume direction in a lagging fashion. In oscillating markets, this indicator can give an idea of how buy/sell volume is moving and where it currently stands. Small arrows mark where reversals are predicted, when the histogram crosses over 0. The biggest pitfall of this mode is that, in a straight trending market, the two EMAs converge and it gives a false reversal signal.
Delta mode
Delta volume mode is a step up from the buy/sell volume mode. It separates both sides into the top and bottom, while also displaying the actual volume behind it in a semi transparent overlay. The best feature, however, is the delta oscillator. This oscillator fluctuates depending on how buy/sell volume is changing and plots bullish/bearish labels when the dominant side (bullish/bearish) changes. The signals, while a bit common, can sometimes dictate large direction changes, started by a dominant volume switch.
On top of different display modes, there is also one more volume mode: buy/sell volume. Instead of only showing the total volume and relative volume, it calculates and separates buying and selling volume.
This volume mode displays differently in all three viewing modes, but the basic principle is the same. It adds a vital piece of information to the chart without adding clutter. The calculation for buy/sell volume uses the candle wicks and body to compare bullish and bearish movement.
Classic mode
Classic mode takes the default volume indicator and improves upon it by also displaying the relative volume on top of the actual volume. Relative volume is calculated similarly between the three display modes: simply by comparing the current bar’s volume to the volume at the same time during previous trading days. Classic mode displays this “relative volume” as well as a simple EMA over top of the actual trading volume.
Originality
The script improves upon the existing relative volume indicator by using previous trading days rather than previous candles to generate the relative volume. On top of that, the calculation methods are unique, using different formulas like variations of the sigmoid function to smooth noise. The main issue this script aims to fix is that towards the start or end of the day relative volume indicators all see spikes as volume grows into close. The new relative volume calculations fix this problem and show what the “true” relative volume is because they compare the current bar to the “same” bar on previous trading sessions.
Enhanced Cumulative Volume Delta [NariCapitalTrading]Enhanced Cumulative Volume Delta (eCVD) Technical Guide
Introduction
The Enhanced Cumulative Volume Delta (eCVD) is a technical indicator in trading that measures the cumulative difference between buying and selling volume over a user-defined period. It helps in understanding market sentiment by showing whether buyers or sellers dominate.
Calculation
Inputs
Period : Number of bars for cumulative volume calculation (default: 14).
MA Period : Period for the moving average of eCVD (default: 20).
Volume Delta Calculation
Buying Volume (buyVolChange) : Counted as buying volume if the current close is greater than the previous.
Selling Volume (sellVolChange) : Counted as selling volume if the current close is less than the previous.
Cumulative Volume Delta (CVD)
Cumulative buying ( cumBuyVol ) and selling volumes ( cumSellVol ) are calculated.
Every period bars, these cumulative volumes are reset.
eCVD is the difference between cumulative buying and selling volumes.
CVD Moving Average
Simple Moving Average (SMA) of eCVD calculated over maPeriod .
Interpretation
eCVD Histogram
Plotted as a histogram.
Color Coding :
Green : Positive eCVD (more buying volume).
Red : Negative eCVD (more selling volume).
Black : No significant difference between buying and selling volume.
CVD Moving Average
Moving average line (yellow) indicates eCVD trend direction and strength.
Application
Trend Confirmation : Rising eCVD suggests an uptrend; falling eCVD suggests a downtrend.
Divergence : Opposite movements in price and eCVD can indicate potential reversals.
Volume Analysis : High eCVD values signal high trading activity, significant at market extremes.
Conclusion
The eCVD can be used to analyze buyer/seller dynamics through volume. It should be used alongside other methods for informed trading decisions.

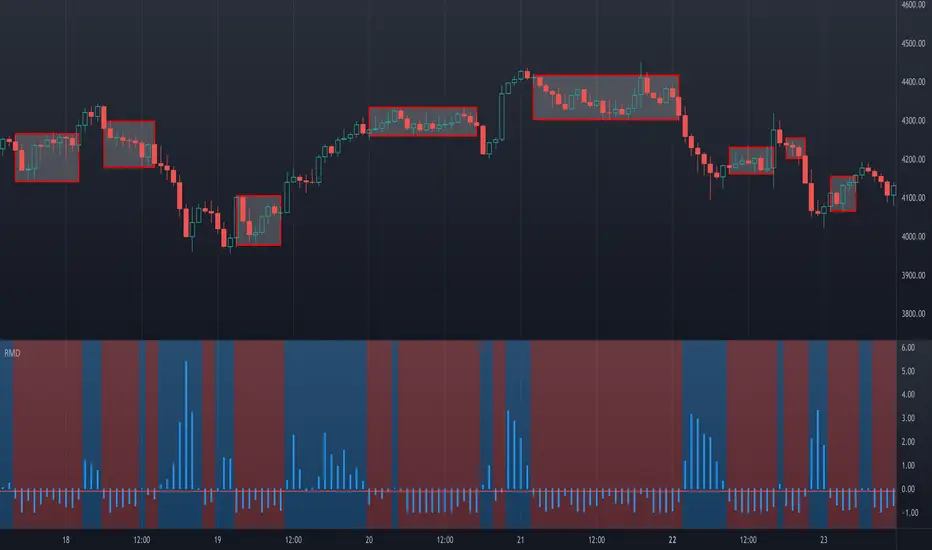
Realized Profit & Loss [BigBeluga]The Realized Loss & Profit indicator aims to find potential dips and tops in price by utilizing the security function syminfo.basecurrency + "_LOSSESADDRESSES".
The primary objective of this indicator is to present an average, favorable buying/selling opportunity based on the number of people currently in profit or loss.
The script takes into consideration the syminfo.basecurrency, so it should automatically adapt to the current coin.
🔶 USAGE
Users have the option to enable the display of either Loss or Profit, depending on their preferred visualization.
Examples of displaying Losses:
Example of displaying Profits:
🔶 CONCEPTS
The concept aims to assign a score to the data in the ticker representing the realized losses. This score will provide users with an average of buying/selling points that are better to the typical investor.
🔶 SETTINGS
Users have complete control over the script settings.
🔹 Calculation
• Profit: Display people in profit on an average of the selected length.
• Loss: Display people in loss on an average of the selected length.
🔹 Candle coloring
• True: Color the candle when data is above the threshold.
• False: Do not color the candle.
🔹 Levels
- Set the level of a specific threshold.
• Low: Low losses (green).
• Normal: Low normal (yellow).
• Medium: Low medium (orange).
• High: Low high (red).
🔹 Z-score Length: Length of the z-score moving window.
🔹 Threshold: Filter out non-significant values.
🔹 Histogram width: Width of the histogram.
🔹 Colors: Modify the colors of the displayed data.
🔶 LIMITATIONS
• Since the ticker from which we obtain data works only on the daily timeframe, we are
restricted to displaying data solely from the 1D timeframe.
• If the coin does not have any realized loss data, we can't use this script.

SuperCloudSupercloud is a MA based Trend Representation. Its different from a normal MA Cloud. Cloud starts from '0' level and rise or fall based on price.
Supercloud is plotted based on the difference of the price movement between various MA's of different length. All MA's are plotted with reference to EMA 200. So when the MA's converge or Diverge or Bounce back we can still be in the Trend unless the Cloud goes below or above Zero Line.
works in all Timeframes.
Up Trend:
-> All MA's are Above Zero and Cloud color is complete green
-> A decrease in Cloud Volume indicates a weaker Momentum
Down Trend:
-> All MA's are Below Zero and Cloud color is complete red
-> A decrease in Cloud Volume indicates a weaker Momentum
Sideways:
-> A Mixed color indicates a Sideways moment.
Cloud Outlines:
1) The outer edge of Cloud shows the actual trend.
2) its based on MA-5, when price is above MA 5 or Below MA 5 a bright green and bright red outlines are plotted.
Buy Signals Confirmation:
upper Outer Cloud must be Bright Green
Cloud under must be fully Shaded Green
Alternatively EMA crossover can be used and confirmed.
Sell Signals Confirmation:
lower Outer Cloud must be Bright Red
Cloud under must be fully Shaded Red
Alternatively EMA cross under can be used and confirmed.
MACD
MACD is also plotted within the cloud.
Color ribbon is used to plot MACD
Histogram is not present. Instead use the width of the MACD Ribbon
Correspondingly Outer Cloud represents the Histogram.
Zero Line:
Zero line is actually EMA5 which is to be treated as EMA200 for our visual representation.
A sideway channel is plotted around Zero line.
When price reaches this sideways Zone price usually get rejections and starts moving side ways.
Trend is established only after price crosses the sideway band.
Sideway is calculated based on mintick of the Asset which varies. a min value equivalent to 10EMA or value 10 must be used for better usage.

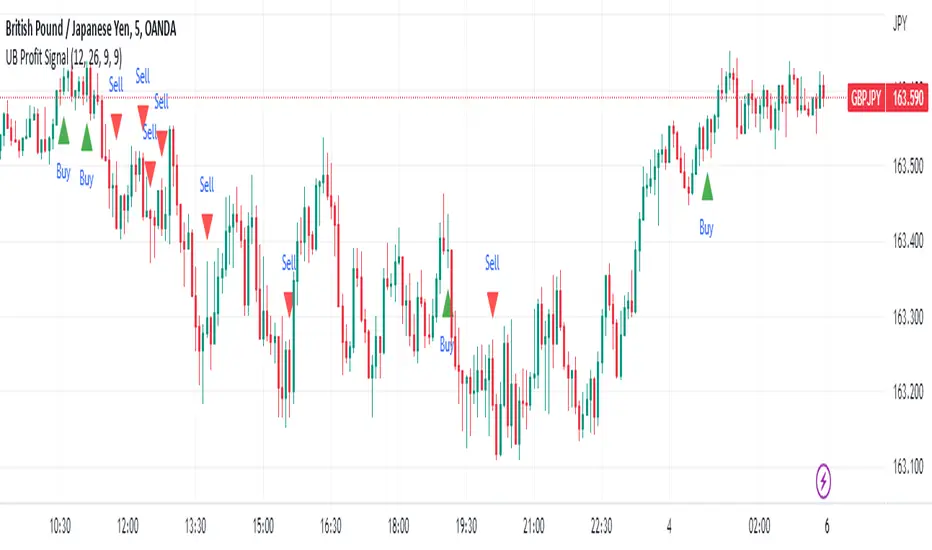
UB Profit Signal IndicatorThe UB Profit Signal indicator is a technical analysis tool designed to identify potential buy and sell signals in the market. The indicator is based on four technical indicators - Moving Average Convergence Divergence (MACD), Relative Strength Index (RSI), Bollinger Bands (BB), and volume moving average.
The script starts by defining input variables such as MACD Fast Length, MACD Slow Length, MACD Signal Length, RSI Length, etc. These variables are used to customize the indicator based on the user's preference.
The MACD is calculated using the ta.macd function, which returns three variables: the MACD Line, Signal Line, and Histogram. The MACD line is calculated as the difference between two exponential moving averages of the price. The signal line is a moving average of the MACD line. The histogram shows the difference between the MACD line and the signal line.
The RSI is calculated using the ta.rsi function, which calculates the RSI value based on the number of periods specified in the RSI Length input variable. The RSI is a momentum oscillator that measures the speed and change of price movements.
The Bollinger Bands are calculated using the ta.sma and ta.stdev functions. The Simple Moving Average (SMA) is calculated using the close price over 21 periods, while the Standard Deviation is calculated using the close price over the same 21 periods. The upper and lower bands are then calculated based on the SMA and Standard Deviation.
Finally, the buy and sell signals are generated based on specific conditions that combine the MACD, RSI, and BB values. For example, a buy signal is generated when the RSI value is greater than 30, the volume is greater than the volume moving average, the close price is greater than the 9-period SMA, and the close price is between the upper and lower BBs. Similarly, a sell signal is generated when the RSI value is less than 40, the volume is greater than the volume moving average, the close price is less than the 9-period SMA, and the close price is between the upper and lower BBs.
The buy and sell signals are plotted on the chart using the plotshape function, which creates triangular shapes above and below the bars to indicate the signals. Green triangles indicate a buy signal, while red triangles indicate a sell signal. Overall, the UB Profit Signal indicator can be useful for traders looking to identify potential buy and sell signals in the market and take advantage of price movements.
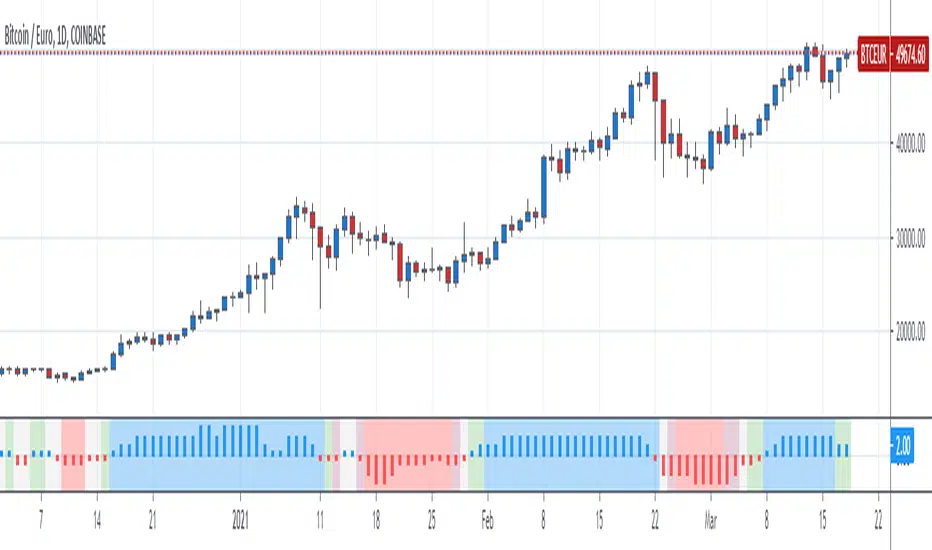
Deemer Breakaway Momentum ThrustBreakaway momentum is a "breadth thrust" coined by Walter Deemer in the 1970s that occurs when the ten-day total advances on the NYSE are greater than 1.97 times the ten-day total NYSE declines.
This indicator calculates the ratio and plots it as a histogram. The 1.97 threshold is also plotted as a horizontal line. Anytime the histogram gets above the line Breakaway Momentum has occurred.
This is a rare signal that has only happened 25 times since 1945.

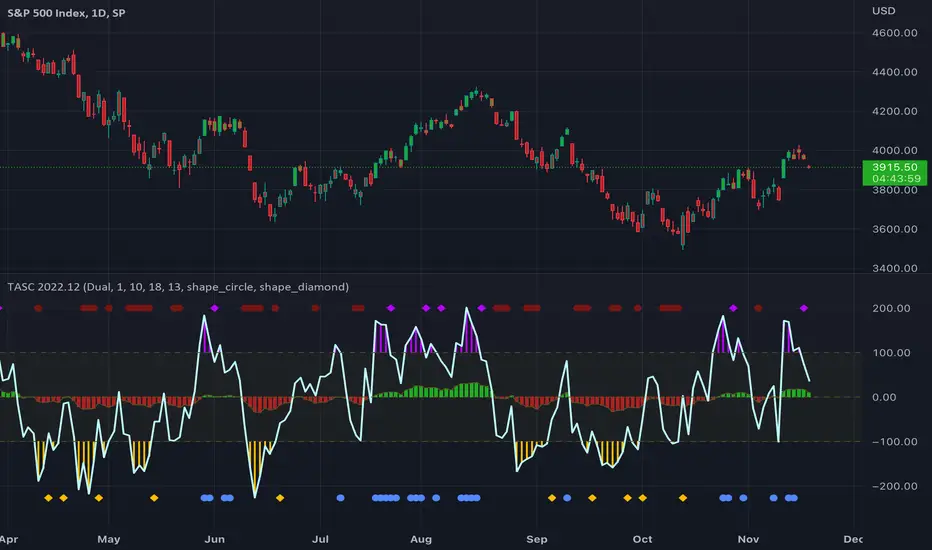
TASC 2022.12 Short-Term Continuation And Reversal Signals█ OVERVIEW
TASC's December 2022 edition Traders' Tips includes an article by Barbara Star titled "Short-Term Continuation And Reversal Signals". This is the code that implements the concepts presented in this publication.
█ CONCEPTS
The article takes two classic indicators, the Commodity Channel Index (CCI) and the Directional Movement Indicator (DMI), makes changes to the traditional ways of visualizing their readings, and uses them together to generate potential signals. The author first discusses the benefits of converting the DMI indicator to an oscillator format by subtracting the −DI from the +DI, which is then displayed as a histogram. Next, the author shows how the use of an on-chart visual framework (i.e., choosing the line style and color, coloring price bars, etc.) can help traders interpret the signals produced the considered pair of indicators.
█ CALCULATIONS
The article offers the following signals based on the readings of the DMI and CCI pair, suitable for several types of trades:
• Short-term trend change signals:
A DMI oscillator above zero indicates that prices are in an uptrend. A DMI oscillator below the zero line and falling means that selling pressure is dominating and price is trending down. The sign of the DMI oscillator is indicated by the color of the price bars (which correlates with the color of the DMI histogram). Namely, green, red and grey price bars correspond to the DMI oscillator above, below and equal to zero . Colored price bars and the DMI oscillator make it easy for trend traders to recognize changes in short-term trends.
• Trend continuation signals:
Blue circles appear near the bottom of the oscillator chart border when the DMI is above the zero line and the price is above its simple moving average in an uptrend . Dark red circles appear near the top of the chart in a downtrend when the DMI oscillator is below its zero line and below the 18-period moving average. Trend continuation signals are useful for those looking to add to existing positions, as well as for traders waiting for a pullback after a trend has started.
• Reversal signals:
The CCI signals a reversal to the downside when it breaks out of its +100 and then returns at some point, crossing below the +100 level. This is indicated by a magenta-colored diamond shape near the top the chart. The CCI signals a reversal to the upside when it moves below its −100 level and then at some point comes back to cross above the −100 level. This is indicated by a yellow diamond near the bottom of the chart. Reversal signals offer short-term rallies for countertrend traders as well as for swing traders looking for longer-term moves using the interplay between continuation and reversal signals.
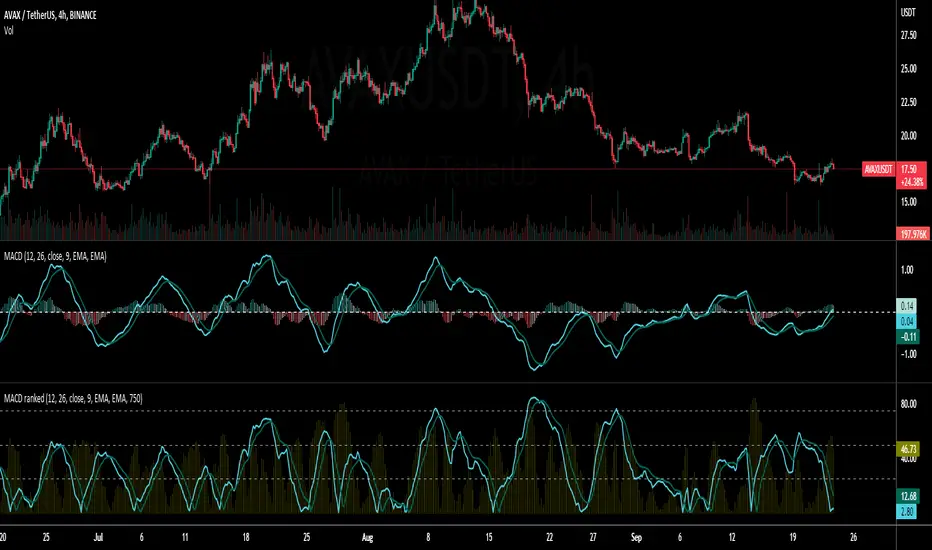
Percentile Rank of Moving Average Convergence DivergenceThis simple indicator provides you three useful information of the Moving Average Convergence Divergence (MACD) indicator:
The percentile rank of the current value of the MACD line, displayed by the bright blue line.
The percentile rank of the current value of the Signal line, displayed by the dark blue line.
The percentile rank of the current value of the Histogram line, displayed by the olive histogram.
This indicator can be useful to identify the strength of trend. This indicator makes the assumption that market tends to revert into the opposite direction. If the market has been trending a lot, it should consolidate for a while later. If the market has been consolidating for a long time, it would begin trending real soon.
When we see a low percentile rank, no matter which line it is, this tells that the market hasn't been moving much, or there is little momentum. If the percentile rank stays below the median or even below the first quartile for a long time, this could suggest that the market is ready for the next trend since it has stored quite some energy.
When we see a high percentile rank, no matter which line it is, this tells that the market has been trending a lot, or there is much momentum. If the percentile rank stays above the median or even above the third quartile for a long time, it is probable that the market has used up much of its energy and is going to take a rest (consolidate).
Ranging Market Detector [AstrideUnicorn]Determining if the market is in a trend or a range regime is a very complex problem. And knowing the answer can be, in some situations, the real holy grail. If the trader knows when the market is in a range regime, they can avoid overtrading and make moving average crossover strategies more profitable. A regime switch from a trend to a range can be a signal to close open positions. It can also be helpful when trading such instruments as short-term binary options. When the market is ranging directional moves are not expected, and the trader should be careful as opening a position in such conditions is, by some degree, a random outcome game. Range breakouts trading is one more example when knowing the market regime is critical.
We have created an indicator that predicts the current market regime. It smooths the price using the Kalman filter and analyzes the curve's slope. If the absolute value of the slope is low, then the market is in range mode and vice versa. To distinguish between the two regimes, the algorithm compares the absolute value of the slope with its long-term average.
HOW TO USE
The indicator shows the difference between the absolute slope value and its long-term average as a histogram. When a bar of the histogram is higher than the threshold level presented by the red line, the market is in a trending regime. In this regime, the background of the indicator is blue. When the market is in a range regime, the indicator background turns red.
The threshold level helps to control the lag. The greater it is, the more lagging the indicator will be. By default, this value is set to a negative value. It means that the indicator switches from range to trend a little bit earlier than the slope gets higher than the average slope. You can use the value of zero or low negative values to find the optimal tradeoff between the strength of the signals and their lag.
SETTINGS
The indicator has one input parameter called Threshold. It sets the threshold level described above. Its value should be close to zero. The less the value is, the less is the indicator's lag, but at the same time, the less confirmed the regime-switching signals are.
The use cases can be very different. And as the code is open, you can also use the indicator as a building block for your custom trading strategies.
Let us know your thoughts and suggestions!
Faith Indicator eykpunter [DM] Greetings Colleagues
I share here a slightly modified version of the fabulous indicator designed by @eykpunter.
Moidifications =
Ploting aspect
Signals transparency
BackGround Trend Signals transparency
Signal length
The two lines of code have been converted into the functions
This indicator compares buyers demand with sellers supply volumes and calculates which prevails. Therefore it only works if volume is published. Buyers demand is assumed for a period in which a higher high is reached with more volume . Sellers supply is recognized by a lower low combined with more volume .
The average of sellers supplies is subtracted from buyers demand, the result is graded because a statement like “The faith in this period was ## percent” has no meaning. We can conclude to more faith and less faith but not represent it in some exact number.
This indicator assigns the following grades:
Very high faith graduated as 8
High faith as 6
Good faith as 4
Some Faith as 2
Little Faith as 1
Neither Faith nor Distrust as zero
Self Protection Distrust graduated as -8
Fear Distrust as -6
Anxiety Distrust as -4
Suspicion Distrust as -2
Doubt Distrust as -1
It is presented as a histogram with blue staves pointing up (meaning faith) and red staves pointing down (meaning distrust)
The background is colored using the Hull Agreement Indicator (Hullag), which I published before. Hullag graduates price movements in five grades to which it assigns a background color. These are as follows:
grade 2: blue, clear upward movement
grade 1: green, some upward movement
grade 0: silver , neither upward nor downward movement
grade -1: maroon, some downward movement
grad -2: red, clear downward movement.
Use of the Faith Indicator:
The indicator shows price action/momentum as a background color and volume action analyzed as a grade of faith in the form of a histogram. Usually faith comes together with rising prices (blue/green background) and distrust with lowering prices (red/maroon background), however contrarian situations occur, e.g. lowering prices while the market has good faith. These can be explained by minority sellers who act contrary to the feelings in the market. You can then decide that this might be an unsustainable move of the quotes.
If the faith indicator confirms the price movement, you might assume that the move is meaningful and will go further. Also if you see faith diminishing you might assume that the move is coming to an end and the tide is going to turn.

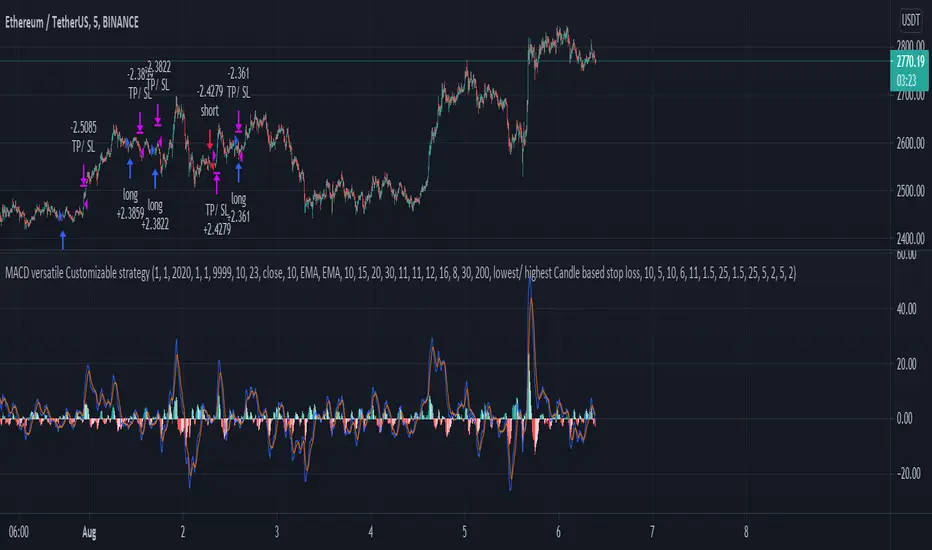
MACD, EMA, Know sure thing, Chopy Market - high adaptabilityHey there :)
This is the free version of the script. The following indicators / settings are missing:
- Support and resistance zones
- dynamic textboxes for alarms when using bots (3 Commas, Alertatron, etc.)
- a table showing the current position, indicators and other important information
With this script there is the possibility to completely customize the MACD . Starting with the MACD and signal line, the histogram and the color of the histogram.
Since the Pinecoders team has previously deleted the script, I will mention the fee settings in a bit more detail:
In this script a fee of 0.01% and a slipage of 15 was used. With each trade the total capital (100%) is used with a risk reward of 1 to 1.5.
The total capital, i.e. the risk, can be changed at any time under the "Settings" tab at "Equity".
I also added an EMA , the Know sure thing indicator and the Chopy Market indicator (by TradingRush) to the script to filter out bad trades.
The EMA:
Since the EMA is very reliable and shows whether there is an upward or downward trend, it should be used with the indicators in any case. It prevents long trades in downward movements and vice versa.
The KST Indicator:
The KST indicator has a similar movement as the MACD, but is by and large a bit more time delayed. It filters out false swings of the MACD and thus prevents bad trades.
The Chopy Market Indicator by Tradingrush:
The Chopy Market indicator, which was introduced by TradingRush in one of its videos, has the ability to detect sideways markets and block zones below this line for trades by means of a fixed value (the line).
To exit the trades, I added the following options:
ATR Exits. Exits based on past candles (lowest low, highest high).
Static exits based on set percentages.
In the next days I will create a tutorial for the script, just have a look on my profile.
If you have any questions about the script, let me know.
Flunki T-WAP minus MA Oscillator
Yo,
Possible the last of these for now, and mostly for the sake of completeness..
This is..
Another simple oscillator that show the difference in price between a selectable timeframe TWAP and a Moving Average of that TWAP
This is shown as a histogram.
Use numeric TWAP values for minutes (30, 60 ,720 whatever) and D, 3D, W, M for higher values
There is also a global timeframe which will set the timeframe for a global alternate timeframe (instead of current chart resolution)
On top of that is a Moving Average of the histogram value, shown as a blue / red line with an option to highlight this MA crossing zero, and an option to colour bars to this line.
The major difference between this Oscillator, and the other script (Flunki VWAP minus MA Oscillator)
(I treid to insert a link but it's invisible so it would seem, anyway.. )
is that VWAP is usually calculated daily, so there is a sharp move upon the daily close, as VWAP starts a new day. Using TWAP this does not occur, so gives smoother transitions ; also the timeframe for TWAP is selectable for additional wap fun.
Simple idea : Code open
Enjoy !

Flunki TWAP minus MTF TWAP Oscillator
Heys,
Herewith a another simple oscillator that show the difference in price between a selectable timeframe TWAP and another alternative selectable timeframe TWAP
This is shown as a histogram.
Use numeric TWAP values for minutes (30, 60 ,720 whatever) and D, 3D, W, M for higher values
There is also a global timeframe which will set the timeframe for a global alternate timeframe (instead of current chart resolution)
On top of that is a Moving Average of the histogram value, shown as a blue / red line with an option to highlight this MA crossing zero, and an option to colour bars to this line.
Simple idea : Code open
Enjoy !
Faith IndicatorThis indicator compares buyers demand with sellers supply volumes and calculates which prevails. Therefore it only works if volume is published. Buyers demand is assumed for a period in which a higher high is reached with more volume. Sellers supply is recognized by a lower low combined with more volume.
The average of sellers supplies is subtracted from buyers demand, the result is graded because a statement like “The faith in this period was ## percent” has no meaning. We can conclude to more faith and less faith but not represent it in some exact number.
This indicator assigns the following grades:
Very high faith graduated as 8
High faith as 6
Good faith as 4
Some Faith as 2
Little Faith as 1
Neither Faith nor Distrust as zero
Self Protection Distrust graduated as -8
Fear Distrust as -6
Anxiety Distrust as -4
Suspicion Distrust as -2
Doubt Distrust as -1
It is presented as a histogram with blue staves pointing up (meaning faith) and red staves pointing down (meaning distrust)
The background is colored using the Hull Agreement Indicator (Hullag), which I published before. Hullag graduates price movements in five grades to which it assigns a background color. These are as follows:
grade 2: blue, clear upward movement
grade 1: green, some upward movement
grade 0: silver, neither upward nor downward movement
grade -1: maroon, some downward movement
grad -2: red, clear downward movement.
Use of the Faith Indicator:
The indicator shows price action/momentum as a background color and volume action analyzed as a grade of faith in the form of a histogram. Usually faith comes together with rising prices (blue/green background) and distrust with lowering prices (red/maroon background), however contrarian situations occur, e.g. lowering prices while the market has good faith. These can be explained by minority sellers who act contrary to the feelings in the market. You can then decide that this might be an unsustainable move of the quotes.
If the faith indicator confirms the price movement, you might assume that the move is meaningful and will go further. Also if you see faith diminishing you might assume that the move is coming to an end and the tide is going to turn.
Volume Profile per day with support/resistance linesThis indicator shows the volume profile by daily blocks and draws on the chart the support or resistance lines produced by the previous volume profile block. A support line will be created if in the previous block, the VPOC line was closer to the lowest price line of that block. This support line will be placed below the VPOC line, at a distance equal to the difference between the highest price of that block and the VPOC price. For the case of the resistance line, the logic applied is analogous.
These support and resistance lines are introduced because, according to the Gaussian bell, the VPOC is likely to be located in the middle, and these deviations can be used to trace support and resistance.
In addition, the indicator includes the following features:
- Change the colors of all plotted lines.
- Define the number of daily blocks to be displayed.
- Define the resolution when calculating the volume of each candle.
- Define the number of support/resistance lines to be displayed.
- Highest and lowest price lines, as well as vpoc line, volume histogram and support and resistance lines.
- Display or not, the vpoc line and the volume histogram.
The calculations performed by the script improve if the candles used are of a lower timeframe. This indicator has been tested in several markets, including cryptos, CFDs, Forex and Indices.
KISS Strategy: SMA + EMA//Hello my fellow investors
//I am creating a simple non-cluttered strategy that uses 3(+1) simple means to determine: viability, entry, and exit
//1) Has a consistent trend been maintained for several days/weeks
//2) SH SMA crossover LG SMA = Bullish entry/LG SMA crossover SH SMA = Bearish entry
//3) Use the Slope factor & Weeks in Trend (WiT) to dertermine how strong of an entry signal you are comfortable with
//4) Exit position based on next SMA cross and trend reversal or stop loss%
//3+1) For added confidence in trend detection: Apply MACD check - buy--> MACD line above signal line and corssover below histogram \\ sell --> MACD line below signal line and crossover above histogram.
//*)This code also allows you to determine your desired backtesting date compliments of alanaster
The chart shown has:
Starting Capital: $10,000
Investment percent per trade: 1.5%
Stop Loss: 20%
Take Profit: 100%
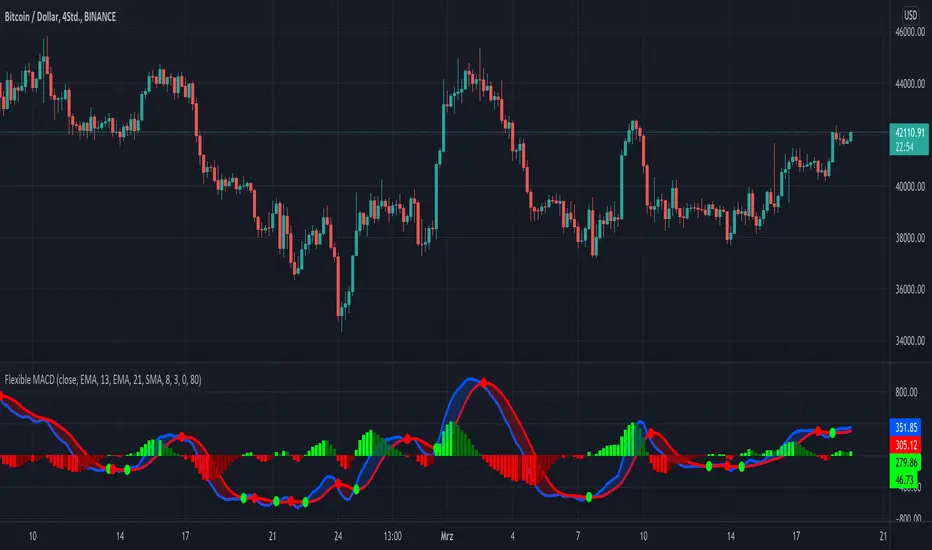
KINSKI Flexible MACDFlexible MACD (Moving Average Convergence/Divergence) Indicator
The Moving Average Convergence Divergence consists of three elements: two moving averages (the MACD line and the signal line) and a histogram. The blue MACD line is the difference between a longer and a shorter EMA (here 13 and 21 periods preset), the red signal line is an SMA (here 8 preset) on the MACD line. The histogram (green: ascending, red: descending) shows the difference between both lines.
As soon as the blue MACD line crosses the red signal line, circles are generated that indicate an up/down trend. If the red signal line is greater than or equal to the blue MACD line, this indicates a downward trend (red circle). If the blue MACD line is greater than or equal to the red signal line, this indicates an upward trend (green circle).
The special thing about this MACD indicator is the many setting options, especially the definition of the MA variants for MACD (Fast, Slow) and signal. You can define the following MA types: "COVWMA", "DEMA", "EMA", "EHMA", "FRAMA", "HMA", "KAMA", "RMA", "SMA", "SMMA", "VIDYA", "VWMA", "WMA".
You also have the following display options:
- "Up/Down Movements: On/Off" - Shows ascending and descending MACD, signal lines
- "Up/Down Movements: Rising Length" - Defines the length from which ascending or descending lines are detected
- "Bands: On/Off" - Fills the space between MACD and signal lines with colors to indicate up or down trends
- "Bands: Transparency" - sets the transparency of the fill color
Disclaimer: I am not a financial advisor. For purpose educate only. Use at your own risk.