High and Low in Selected Time Window (Chart's Timezone)Simple indicator for finding the high and low in any selected time period. to use enter the start time by selecting the hour and minute and enter the end time the same.
a line will be drawn along with the price and a timestamp of when it occurred. shows multiple days of the same time period. Useful for observing ICT Macros, 6VS10 etc.
在脚本中搜索"low"

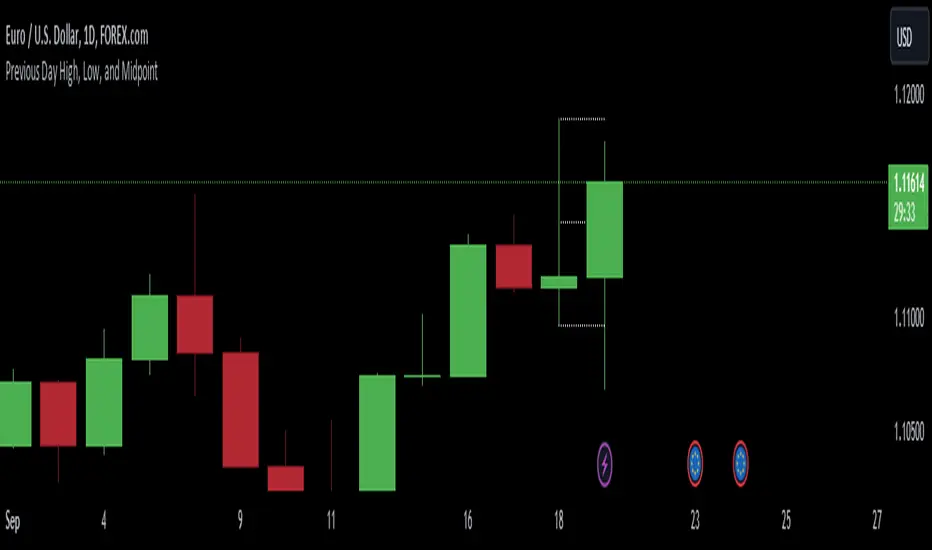
Previous Day High, Low, and Midpointshows yesterdays high low and midpoint elimainating the need to use the fib tool every day
High Low Lines (500 candle 5min)This TradingView script is designed to visualize the highest high and the lowest low from the previous 576 candles on the chart. It draws horizontal lines representing these values and updates them at a specific time each day.

Previous Day High and LowPlots previous and the day before days' high and low for all days, not just today.

Cumulative New Highs - New LowsIndicator that plots the cumulative number of 52-Week New Highs minus New Lows with an added moving average. Settings allow the choice between S&P 500, Nasdaq 100 or the Overall Market as Index. You can also customize the length of the moving average.

Day Open,High,Low Fib LevelsDay Open,High,Low Fibonacci Levels indicator depicts Fibonacci levels from Highest to lowest price levels vis-à-vis Day Open Price. The indicator is structured based on default Intraday number of bars. Hence the indicator and Gray Zone concept is effective in lower time frames .The indicator has also “Regular” Check in Box option under “Input” with default 14 bars under “Regular Length” to switch over from default Intraday Length.
Green Zone represent area above Day Open Price when close is above Day Open Price.
Red Zone represent area below Day Open Price when close is below Day Open Price.
Gray Zone represent band within the Maximum and Minimum of Moving Averages of MA24,MA38,MA50,MA62,MA79 drawn with relevance to Fibonacci levels. The movement within this band is expected to be resistant prone on either direction.
Fibonacci levels between Highest and Lowest points during Green Zone and Red Zone are derived and reflected at 78.6,61.8,50.0,38.2 and 23.6 levels for users guidance.
Trades above Gray Zone are favored for Buy trades and below Gray Zone are favored for Sell trades. Trades within Gray Zone are resistant prone from either direction.
If number of bars in Gray Zone during Intraday are more than the combined number of bars above Green Zone and number of bras below Gray Zone then market may be assumed to be in Range bound state.
MA20 and MA200 are in default in display state. Position of MA 20 above and below Gray Zone and vis-à-vis MA Mid (Mid point in Gray Zone ) reflects the prevailing trend .MA 200 reflects the general Up trend or Down trend .
The Indicator reflects the Green Zone, Gray Zone ,Red Zone in the Table below the Chart depending on the position of Day Open Price below or above the Last Price .If the number of bars in the Gray Zone are more than the combined number of bars above and below Gray Zone the table reflect Range Bound Market.
Supplementing with other monitoring tools and Price Action dynamics the indicator assist the user to plan his entry and exit of trade based on the position of the market whether it is in Green Zone or Red Zone by taking into account the Fibonacci Levels.
DISCLAIMER : For educational and entertainment purpose only .Nothing in this content should be interpreted as financial advice or a recommendation to buy or sell any sort of security/ies or investment/s.

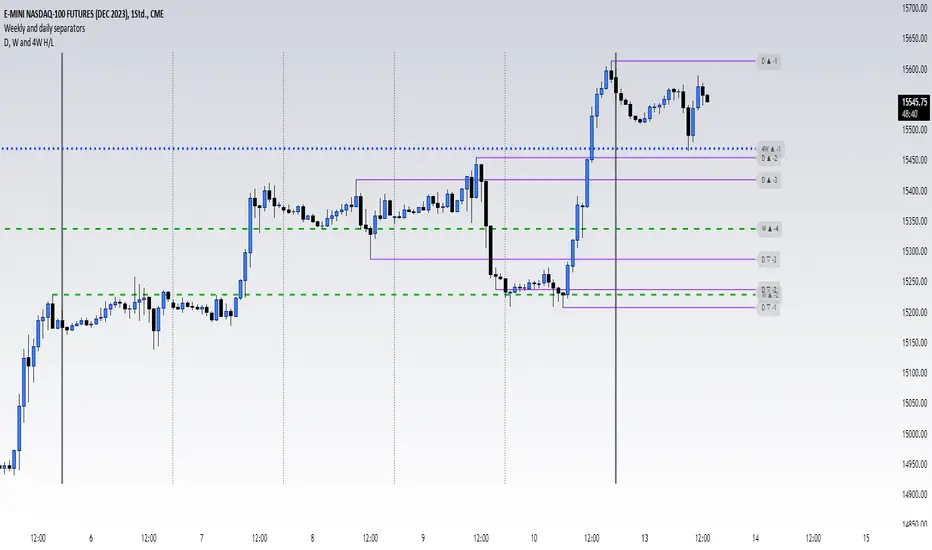
High and low of last D, W, 4W and quaterThis script shows you the Highs and Lows from multiple candels from some different timeframes. They are the 1D, 1W, 4W (a month basically), and 3M (a quater). The indicator offery you many customization option to make it look how you like it best
Cumulative Net Highs-Lows (4 Week)Plots the cumulative total of net new highs minus lows over the past 4 weeks and the 10 ema of the calculation. Settings allow choice of NYSE and Nasdaq. Signal shading for when the indicator is above the 10 ema, showing a rising trend of net highs-lows. Similar to the TC2000 T2123 indicator.

Exchange Net Highs-LowsDisplays the net new 52 week highs - 52 week lows for either the NYSE or Nasdaq. Select colors and moving average input within the settings.

OHMLC Lines - Present- Current OHMLC candles
- Show current Open, High, Mid, Low, Close candles levels

Globex High/LowThis indicator marks the opening, high, and low of the Globex range in futures (6 PM ET - 9:30 AM ET). In addition, it also will calculate and plot the 1st and 2nd standard deviations above and below the globex range. These levels can be used as support and resistance in the New York session (9:30 AM ET - 4 PM ET). Price often respects the globex range to some degree during regular trading hours. This can be modified for any time range you prefer.
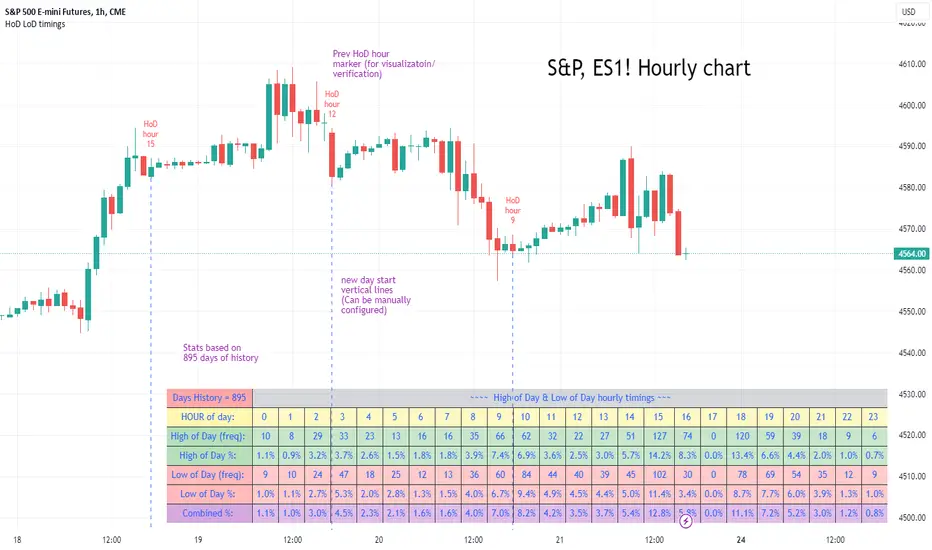
High of Day Low of Day hourly timings: Statistics. Time of day %High of Day (HoD) & Low of Day (LoD) hourly timings: Statistics. Time of day % likelihood for high and low.
//Purpose:
To collect stats on the hourly occurrences of HoD and LoD in an asset, to see which times of day price is more likely to form its highest and lowest prices.
//How it works:
Each day, HoD and LoD are calculated and placed in hourly 'buckets' from 0-23. Frequencies and Percentages are then calculated and printed/tabulated based on the full asset history available.
//User Inputs:
-Timezone (default is New York); important to make sure this matches your chart's timezone
-Day start time: (default is Tradingview's standard). Toggle Custom input box to input your own custom day start time.
-Show/hide day-start vertical lines; show/hide previous day's 'HoD hour' label (default toggled on). To be used as visual aid for setting up & verifying timezone settings are correct and table is populating correctly).
-Use historical start date (default toggled off): Use this along with bar-replay to backtest specific periods in price (i.e. consolidated vs trending, dull vs volatile).
-Standard formatting options (text color/size, table position, etc).
-Option to show ONLY on hourly chart (default toggled off): since this indicator is of most use by far on the hourly chart (most history, max precision).
// Notes & Tips:
-Make sure Timezone settings match (input setting & chart timezone).
-Play around with custom input day start time. Choose a 'dead' time (overnight) so as to ensure stats are their most meaningful (if you set a day start time when price is likely to be volatile or trending, you may get a biased / misleadingly high readout for the start-of-day/ end-of-day hour, due to price's tendency for continuation through that time.
-If you find a time of day with significantly higher % and it falls either side of your day start time. Try adjusting day start time to 'isolate' this reading and thereby filter out potential 'continuation bias' from the stats.
-Custom input start hour may not match to your chart at first, but this is not a concern: simply increment/decrement your input until you get the desired start time line on the chart; assuming your timezone settings for chart and indicator are matching, all will then work properly as designed.
-Use the the lines and labels along with bar-replay to verify HoD/LoD hours are printing correctly and table is populating correctly.
-Hour 'buckets' represent the start of said hour. i.e. hour 14 would be populated if HoD or LoD formed between 14:00 and 15:00.
-Combined % is simply the average of HoD % and LoD %. So it is the % likelihood of 'extreme of day' occurring in that hour.
-Best results from using this on Hourly charts (sub-hourly => less history; above hourly => less precision).
-Note that lower tier Tradingview subscriptions will get less data history. Premium acounts get 20k bars history => circa 900 days history on hourly chart for ES1!
-Works nicely on Btc/Usd too: any 24hr assets this will give meaningful data (whereas some commodities, such as Lean Hogs which only trade 5hrs in a day, will yield less meaningful data).
Example usage on S&P (ES1! 1hr chart): manual day start time of 11pm; New York timezone; Visual aid lines and labels toggled on. HoD LoD hour timings with 920 days history:
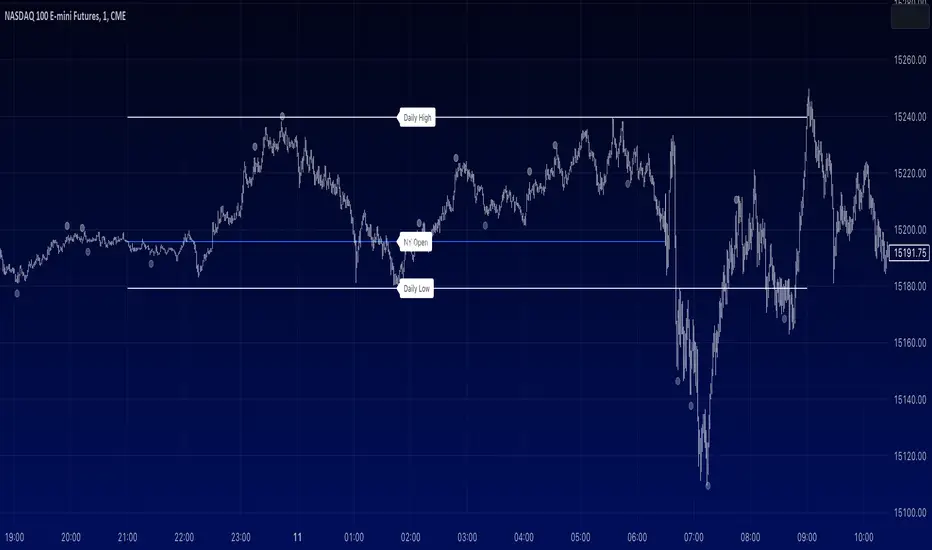
ICT - NY Session Open + Daily High/Low Markers [1m Chart]For ICT lovers, this marks the swing low, swing high of NY opening so you can scalp the open.
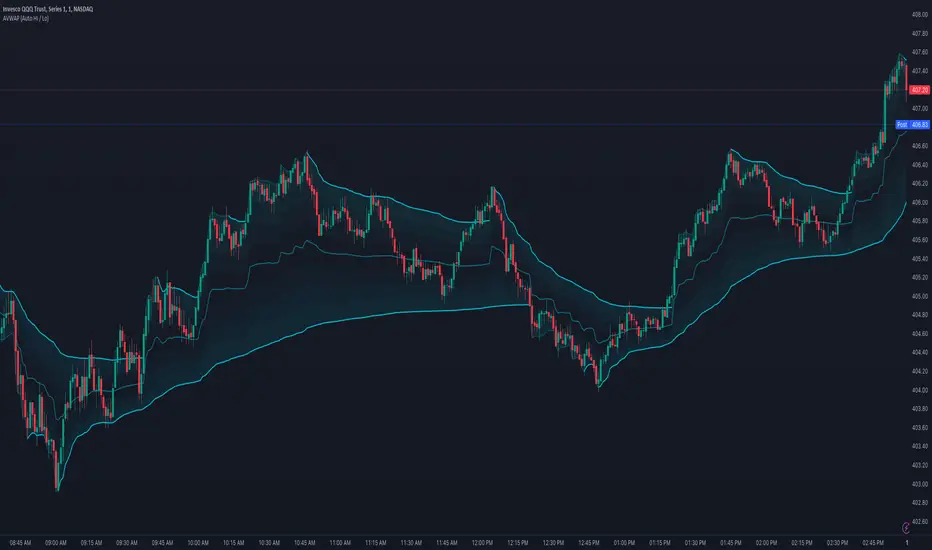
Anchored VWAP (Auto High & Low)OVERVIEW
This script plots, and auto-updates, 3 separate VWAPs: a traditional VWAP, a VWAP anchored to a trends high, and another anchored to a trends low.
VWAP and Anchored VWAPs are commonly used by institutions responsible for the majority of market volume on a given day. Citadel Trading, for example, accounts for approximately 35% of all U.S. listed retail volume , largely executed through program trades over the course of a day, week, or month.
Because VWAP is a prominent market maker tool for executing large trades, day traders can use it to better anticipate trends, mean reversion, and breakouts.
This is most useful on charts with intraday time frames (1 minute, 5 minute etc.) commonly used for day trading. This is not ideal for larger time frames (1 hour or greater) commonly used for swing trading or identifying larger trends.
INPUTS
You can configure:
The size, color, and visibility of 6 different plots (VWAP, High Anchor, Low Anchor, Average of Anchors, Quarter Values, Interim Bands)
How smooth the average displays
INSPIRATION
1. "How To Measure Anything" by Douglas W. Hubbard
2. "Maximum Trading Gains With Anchored VWAP" by Brian Shannon
Better understanding probability and how to analyze risk (first book), as well as the tools market makers use (second book), has completely reframed how I approach day trading.
Hobbiecode - Five Day Low RSI StrategyThis is a simple strategy that is working well on SPY but also well performing on Mini Futures SP500. The strategy is composed by the followin rules:
1. If today’s close is below yesterday’s five-day low, go long at the close.
2. Sell at the close when the two-day RSI closes above 50.
3. There is a time stop of five days if the sell criterium is not triggered.
If you backtest it on Mini Futures SP500 you will be able to track data from 1993. It is important to select D1 as timeframe.
Please share any comment or idea below.
Have a good trading,
Ramón.

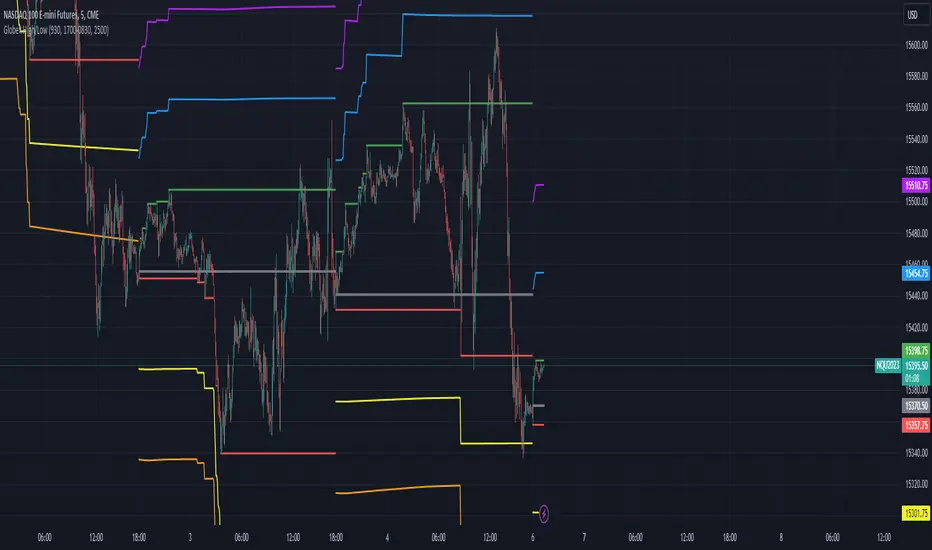
NSDT Custom High and Low LinesFirst, the credit for the original script to plot a High and Low between a certain time goes to developer paaax.
I took that idea, converted it to Pinescript V5, cleaned up the code, and added a few more lines so you can plot different levels based on time of day.
Published open source like the original.
The example shown has:
Blue - plotting from the start of the Futures Asian session to the start of the Futures USA Session. (6:00PM - 9:30AM Eastern)
Yellow - plotting from the start of the Futures Europe session to the start of the Futures USA Session. (3:00AM - 9:30AM Eastern)
Green - plotting from the start of the Futures US Premarket session to the start of the Futures USA Session. (8:00AM - 9:30AM Eastern)
These are great levels to use for breakouts and/or support and resistance.
Combine these levels with the 5 min Open Range levels, as you have some good trades.
Each of the three sessions have individual start and end times that can be modified by the trader, so you can easily mark off important areas for your style of trading.

Pre-market Highs & Lows on regular trading hours (RTH) chartShows pre-market highs and lows on RTH or ETH chart
-Pre-market duration user input (default is 16 'bar hours'; covering the time from S&P RTH close at 4pm >> 9:30am RTH open next day
-Displays on both RTH and ETH charts
-Written for ES (ES1! or e.g ESM2023), but tested and working on SPY, SPX
-Works across timeframes
Example usage on Electronic trading hours (ETH) chart; showing the 'bar hours' user input lookback duration visually

Higher High & Higher Low (Live) ━ [whvntr]This indicator is based on the trading formation Higher high and Higher low. It dynamically displays the current price above the bar on a label.
Features:
• If the current price is lower than the previous high the label color will dim.
• If the current price is lower than the previous low the price figure will turn red.
• Completely customizable
• Inspired by the Price label written by Westy_ , I have written different functions (coding) to make this indicator what it is.
These are not buy and sell signs, it's based on the HH & HL trading formation.

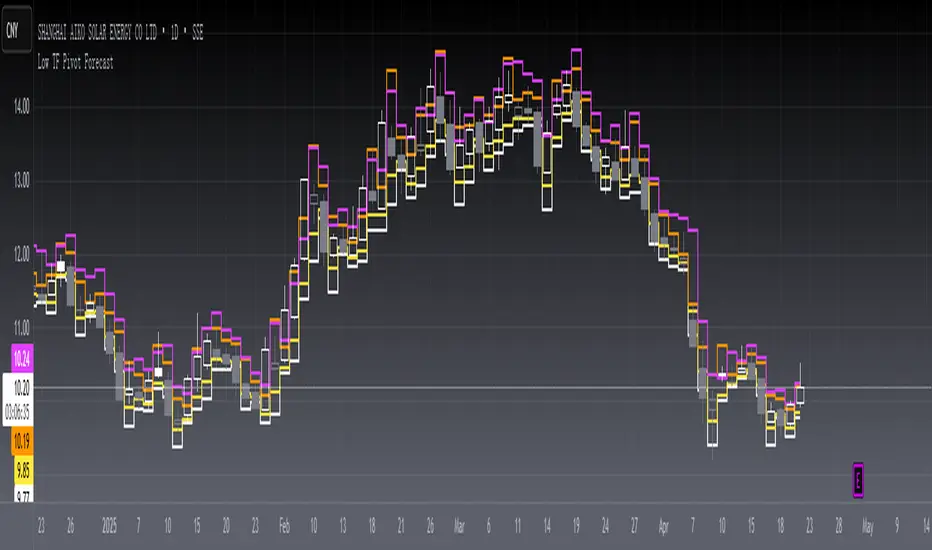
[blackcat] L2 Low TF Pivot Forecast Level 2
Background
A algo for pivot points forecast for each bar and its low tf data.
Function
In financial markets, a pivot point is a price level that is used by traders as an indicator of market movement. Pivot points are averaged from important prices (highest, lowest, closing) based on the market performance of the previous time period. There are many ways to calculate the pivot point. The pivot point is calculated using the highest price (H), the lowest price (L) and the closing price (C) of the previous time period, and sometimes the opening price of the current time period Valence (O) was added to it.
S1 yellow
S2 white
R1 Orange
R2 fuchsia
The smoothing parameter default to 55
The pivot point indicator can be used in two ways. First, the pivot point can be used as a price trend confirmation. It is generally believed that if the price is above the pivot point in the latter period of time, the market is considered to be in a bull market sentiment, otherwise it is considered to be in a bear market sentiment. Second, support and resistance levels are mainly used as exit positions. For example, R1 and R2 can be used as trade targets if the market price breaks above a pivot point. If the market effectively breaks R1 and R2, traders may consider adding to their long positions.
Remarks
Feedbacks are appreciated.
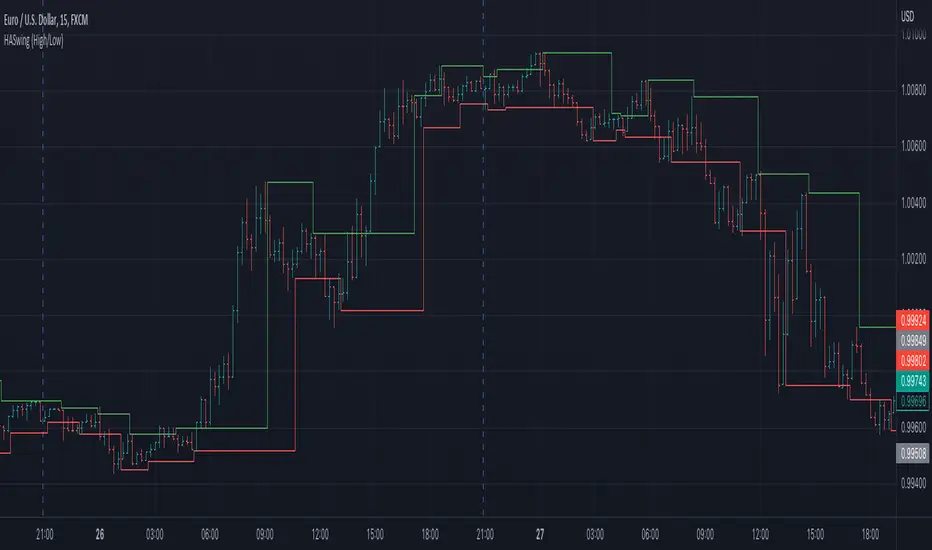
Heiken Ashi Swing High/LowIt uses Heiken Ashi candles to detect recent swing high and low.
It can be used as a stop-loss or support/resistance indicator.
inChart - LibLibrary "inChart"
determine if price value is between chart high + x% and low - x% on the visible chart.
inChart()

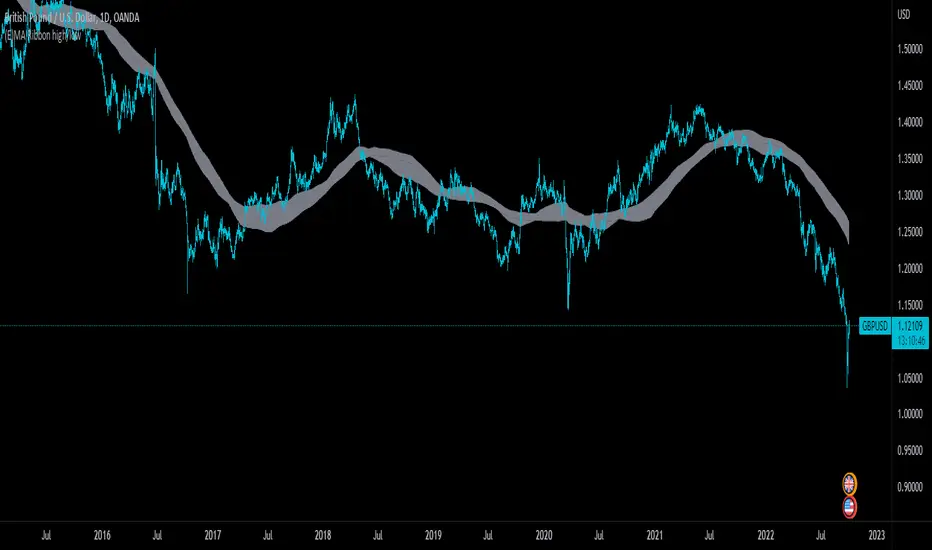
(E)Moving Average Ribbon High/LowThis is a slight modification of the standard Moving Average Ribbon. This script will take the 200 EMA and SMA with source the high and low, not the close.
This band will act as a support and resistance zone and should be used as a confluence with other indicators or support/resistance lines.
I got inspired to create this one, by the YT video "FINALLY! The 200 EMA Confluence Trading Strategy You’ve Been Waiting For" by The Secret Mindset.
In his video he takes only the 200EMA, but this script will take by default also the SMA into account.
In the settings you still can adapt as you wish ;-)
Happy trading!
Visible Range High Low [vnhilton]Inspired by TradingView's "Chart VWAP". Thank you PineCoder for the "VisibleChart" library.
This indicator plots labels for the highest high & lowest low for the visible bars on the chart. TradingView does by default have an indicator similar to this, however it plots labels on the y-axis & cannot be customized.
