MTF High and Low FractionsMTF High and Low Fractions
Description
An experimental script that prints 1/3, 1/4 and 1/8 levels of the previous timeframe's high and low to the current timeframe. The idea is quite simple. It mirrors the the previous high and low with user selected levels. The default setting is the previous daily high and low but can be customized on user discretion.
New levels are printed after the close of the previous timeframe and open of the new timeframe (user's timeframe setting).
How To Use
Levels should not be used blindly. Levels can be used as confluence when aligned with high probability supply and demand zones, support, resistance, order blocks, and so on.
在脚本中搜索"order block"
Swing High/Low Indicator w/ MACD and HTF EMA'sSwing High/Low Indicator w/ MACD and EMA Confirmations by KaizenTraderB
I designed this indicator to be used with a market structure break strategy.
It labels swing highs and lows that are confirmed by the MACD.
It also displays a higher timeframe Fast and Slow EMA to determine directional bias.
Also provides alerts that signal Swing Low breaks in downtrends and Swing High Breaks in uptrends.
It draws a horizontal line on the last Swing High and Low.
Display this indicator on your entry timeframe and choose your Higher Timeframe in settings.
You can also change lookback period for Swing Highs and Lows and EMA's.
When I use this I am looking for the Swing High/Low break in direction of HTF Trend
Then look for pullback between price level of break and areas of liquidity (wicks, order blocks, price congestion) for entry in direction of EMA trend.

TotalCap RSI and Pressure CandleCandles and areas where force is applied.
Special to see divergences and possible Order Blocks
The RSI is applied on the TOTALCAP to be able to visualize when the entire market is in turning conditions

MTF previous high and low quarter levelsDescription
An experimental script that prints quarter levels of the previous timeframe's high and low to the current timeframe. The idea is quite simple and is basically the Fibonacci pivoted on the previous high and low with quarter level settings (0,0.25,0.5,0.75,1 etc). The default setting is the previous daily high and low but can be customized on user discretion.
New quarter levels are printed after the close of the previous timeframe and open of the new timeframe (user's timeframe setting)
How To Use
Levels should not be used blindly. Levels can be used as confluence when aligned with high probability supply and demand zones, support, resistance, order blocks, and so on.
Credit to @HeWhoMustNotBeNamed for the Previous High/Low MTF indicator code and @mrbirman for the idea to put this together.

Liquidity RaidThe market always seeks liquidity. Liquidity rests above previous highs and below previous lows.
The script highlights the breach of a market structure high or low (W/D/4H/1H), and will alert you on the first fractal break in the opposite direction.
The idea is that the raid happens, and you are only alerted once a candle breaks a fractal and closes in the opposite direction.
When a signal is printed, it does not mean to enter immediately. It just means that there is a fractal break in the opposite direction, and that you will need to assess current price action and market structure for a potential trade on pullback.
You still need to take HTF directional bias, market structure, order blocks and imbalances into consideration.
The script is for trading on on smaller time frames (1/2/3/5m).
Fractal periods, lines and colours are all customizable

AleemTalks Crypto MachineOne of best Trend Trading Systems
It Included Moving Averages
Multi Time Frame Analysis
Order blocks
Support and Resistance
To understand it completely
You can Inbox me

Stocky OB v3Highlights engulfing order blocks where price moves away quickly from and highlights important levels.
v3 updated script so alerts actually work

SMT - Smart Money Thursday Boxes
The Smart Money Trading Thursday - is a very specific trading system. You only trade it on a Thursday.
The script/indicator will color Thursdays as two boxes. If you just want one color, use same color for
both boxes. The boxes is there to indicate London/New York sessions.
SETTINGS
In the setting you find a numeric value as 1700-0400:5
The "5" indicate Thursday. You can change that if you prefer to color another specific day.
For example "4" would indicate Wednesday. And you can change the hours to fit your
sessions and trading style.
You can also use the 2 boxes on different days. If you for example would like to color up
London for Wednesday and Thursday. Then set hours to fit London session and adjust the
:5 to 4 on the 1st box and 5 on the 2nd.
HOW TO USE IT?
The Smart Money works in a way retail trading does not. Smart Money has an objective
to locate retail patterns, where there will be a lot of stop loss volume to be grabbed.
So when a retail trader see a setup like a "Double Top / Bottom". The Institutional
will see $$$ of dumb money, ready to be taken. The best moves happen on a Thursday
but if you are a skilled trader, you can see the move also occur on Wednesday or Friday.
The first thing that will happen, is that the Smart Money Breaks out of session. Meaning
they will leave the current weeks high/low range. To start collect negative contracts
of the retail volume.
When you see that happen. And you see a breakout that consist of 4 in a row 1 hour
chart candles. Then you have your first rule meet.
#1 Thursday breakout of current weeks high/low. And the move is a clean 4 hour move
as 4x H1 candles. The move can start within range. But must end clearly outside.
Visual Example:
#2 Next, we await an engulf at peak or near peak. That is where Institutional
may have problem to match any more contracts, and since they used their own
money to make this move. They must now mitigate orders, and return back to
the original retail pattern as most retail traders are now stopped out.
(Normally this is a long/clear candle out of range. they rarely go lower
then retail traders entry in the 1st push. This to not save any souls :)
#3 Price returns back to where the breakout from the retail happens.
You can now take your profit as a Smart Money Trader. Trading with less risk,
you can take profit of the return of that latest 4x H1 candle move. (Order
Block)
CONCLUSION
The best trade is when you can combine a retail pattern, followed by a
breakout which holds 4x 1 hour candles in the outbreak direction.
2nd best is when you have the 4x H1 breakout and really no clear retail
pattern. Still is the same game. Just not as clear as the one above.
Study the steps in this image and you see what to look after:
Good Luck with your trading!
Regards,
The Hunter Trading Group

NANO [v0.1] -- BACKTESTER
Super LTF scalp bot.
Works very well on 1, 3, 5 minute chart.
This cannot be automated because of market fees. But use this in confluence with HTF levels, swing points, order blocks etc and scalp some quick profits.
Settings included are for XBTUSD on the 3 minute. It's quite easy to find settings for other time frames and markets.

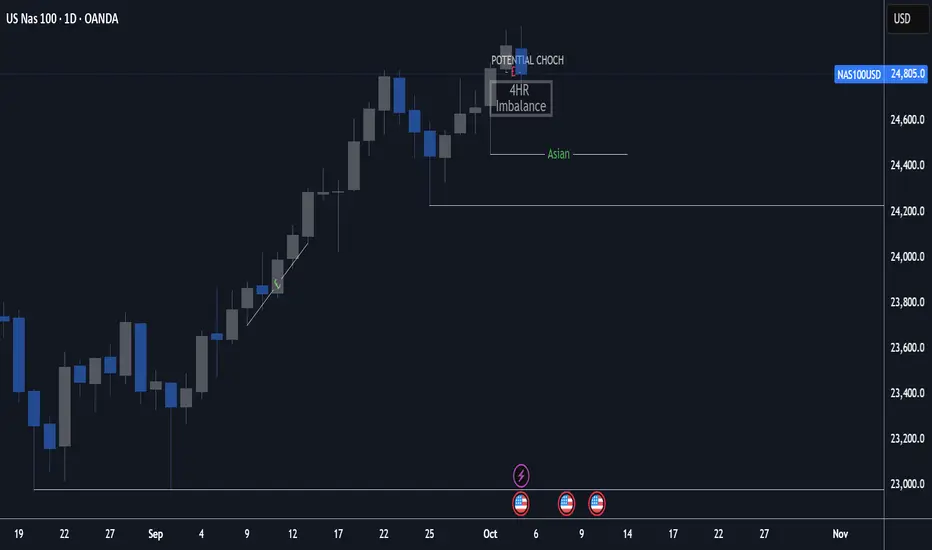
4H + 15m Sell Signals It shows sell positions on the 15 min based on 4 hour ,imbalance, order block and swing high and low frameworks.
Project 6SMC Order-Block + EMA/ADX/RSI/Volume composite — shows Pre-Entry (inside OB), Buy/Sell reversal signals, weak-trend lines and a compact 0–7 confidence score.

BEC Important Price Levels V1BEC IPL V1
price behavior analyzer
Overview
BEC Important Price Levels V1 is designed to identify key structural price reactions in the market — specifically, shakeouts followed by breakout confirmations.
It automatically marks potential reversal and continuation zones based on wick-to-body ratios, break structures, and optional volume behavior.
The indicator helps traders spot high-probability levels where liquidity sweeps or false moves often transition into real trends.
Core Logic
Shakeout Detection
Identifies bullish or bearish shakeouts when a candle shows long wicks relative to its body (configurable with Wick/Body Min Ratio).
Optionally filters shakeouts by relative volume strength (Use Volume Filter).
Break Confirmation
After a shakeout, when the market breaks above/below the shake candle’s extreme, it marks a break event.
These breaks often indicate a strong continuation or reversal shift.
Retest & Important Levels
For each break, a dotted retest line is drawn from the original shake candle’s opposite extreme.
A secondary dotted line highlights the break candle’s high/low — showing the precise short-term level where reactions are likely.
Visual Elements
🟢 Bull Shakeout → green “cross”
🔴 Bear Shakeout → red “cross”
🟩 Bull Break → lime triangle + dotted green support lines
🟠 Bear Break → orange triangle + dotted red resistance lines
Orange dashed lines = high/low of break candles
Use Case
Detect stop-hunt candles or liquidity sweeps followed by valid structure breaks.
Combine with your existing supply-demand, order block, or VSA setups for confluence.
Excellent for identifying the “important price levels” where the market reveals institutional intent.

MTF State of Delivery by @traderprimezOverview
This indicator provides a comprehensive, multi-timeframe view of institutional orderflow, a core concept from Inner Circle Trader (ICT) methodologies.
It is designed to objectively identify the market's "State of Delivery"—whether price is currently in a bullish or bearish orderflow—on both your current chart (Lower Timeframe) and a relevant Higher Timeframe.
By visualizing these key directional shifts, the indicator helps traders align with the dominant market bias, identify high-probability setups, and avoid trading against the underlying institutional intent.
Core Concept: The Orderflow Switch
The entire logic is built upon a specific two-candle price action pattern called a "Switch," which signals a potential turning point in the market.
Bullish Switch: A bullish candle followed immediately by a bearish candle. This duo creates a short-term resistance level. Orderflow is confirmed Bullish when a later bullish candle closes above this level.
Bearish Switch: A bearish candle followed immediately by a bullish candle. This duo creates a short-term support level. Orderflow is confirmed Bearish when a later bearish candle closes below this level.
Features & How to Read the Chart
This indicator plots several visual elements to provide a complete picture of the market's state:
Status Table: Located at the top of the chart, this table provides an at-a-glance summary of the current State of Delivery for both the Higher Timeframe (HTF) and Lower Timeframe (LTF). The status cells dynamically change color to reflect the current bias (Blue for Bullish, Red for Bearish).
Confirmed Orderflow Lines:
Thick Solid Lines: These represent the confirmed orderflow on the Higher Timeframe. A thick blue line indicates the HTF is in a bullish state, while a thick red line indicates a bearish state.
Thin Solid Lines: These represent the confirmed orderflow on your current chart (LTF). A thin blue line confirms a local bullish shift, and a thin red line confirms a local bearish shift.
Pending Switch Levels (Dotted Lines):
These forward-extending dotted lines mark the most recent switch levels that have not yet been broken. They represent the "lines in the sand"—the exact price levels that need to be breached to confirm the next shift in orderflow on both the LTF and HTF.
Multi-Timeframe Analysis
The indicator's power comes from its ability to sync LTF price action with the HTF narrative. It automatically determines the relevant HTF based on your current chart, using the following logical pairings:
1m or 3m chart 15 Minute
5m chart 1 Hour
15m chart 4 Hour
1h chart 1 Day
4h chart 1 Week
1d chart 1 Month
Note: The HTF feature will be inactive on unmapped timeframes.
How to Use in Your Trading
This tool is designed to be a confluence factor in your trading system, not a standalone signal generator.
High-Probability Setups: The strongest signals occur when the LTF confirms an orderflow shift that is in the same direction as the established HTF bias. For example, look for long entries after a thin blue LTF line appears while the dominant HTF line is also blue.
Confirmation: Use the break of a pending (dotted) line as a final confirmation for an entry you have already identified through your own analysis (e.g., at a Fair Value Gap or Order Block).
Risk Management: An opposing orderflow shift can serve as an early warning to manage a trade or take profits. For instance, if you are long and a bearish (red) LTF orderflow is confirmed, it may signal that the short-term momentum is shifting against you.
Settings
The indicator is fully customizable, allowing you to:
Toggle the visibility of the Status Table, HTF/LTF confirmed lines, and HTF/LTF pending lines.
Customize the colors and line widths for all elements to match your chart theme.
Disclaimer: This tool is for educational and analytical purposes only. It is not financial advice. All trading involves substantial risk, and past performance is not indicative of future results. Please perform your own due diligence and risk management.

Smart CRT Indicator📌 Smart CRT Indicator – Spot Trend Reversals and Continuations with Precision
The Smart CRT Indicator is a versatile price action tool that identifies Candle Range Trap (CRT) patterns—powerful setups that often precede either trend reversals or breakout continuations.
It detects and visualizes market conditions where price gets "trapped" within a prior range or breaks out deceptively, giving traders early insight into potential directional moves.
🔍 Key Features:
✅ Bullish & Bearish CRT Signals
Accurately spots both reversal and continuation setups using CRT logic across three core patterns.
✅ Flexible Range Close Filter
Customize how deeply the second candle closes within the first candle's range to fine-tune signal quality.
✅ Trend Filter (Optional)
Choose whether to only show signals aligned with the dominant trend, using a customizable SMA filter.
✅ Visual Range Mapping
Automatically draws range lines to mark key price zones for CRT patterns. Adjustable style, color, and width.
✅ Real-Time Alerts
Get notified instantly when a new CRT pattern appears on your chart.
🧠 CRT Pattern Types Detected:
Inside Bar CRT: A compression pattern inside a larger range that signals potential breakout or reversal.
Multi-Candle CRT: A group of smaller candles shrinking inside an anchor candle—often a sign of building momentum.
Purge CRT: A deceptive breakout beyond the previous candle’s range, followed by an immediate reversal.
⚙️ Best For:
Traders seeking trend continuation breakout setups
Traders looking to fade false moves or catch reversals
Price action traders who rely on candle structure and traps
Swing, intraday, or even scalping strategies
🧩 Tip:
Combine CRT signals with Key Levels, FVG, support/resistance or order block zones for high-probability confluence entries.

Scalper - Pattern Recognition & Price Action with Divergence Scalper - Pattern Recognition & Price Action with Divergence
Overview
An educational indicator designed to demonstrate comprehensive technical analysis concepts through integrated pattern recognition, price action analysis, and divergence detection. This tool combines traditional candlestick patterns with modern institutional concepts and advanced divergence analysis for educational market study.
Educational Purpose & Originality
Core Educational Concepts
This indicator serves as a learning platform for understanding:
- **Pattern Recognition Methodology**: Systematic identification of candlestick formations
- **Price Action Theory**: Modern institutional footprint analysis
- **Divergence Analysis**: Momentum divergence detection across multiple oscillators
- **Confluence Systems**: Multi-signal integration and validation techniques
Original Implementation Features
1. Enhanced Pattern Detection Library
- **Volatility-Filtered Patterns**: ATR-based validation for pattern significance
- **Volume-Confirmed Formations**: Integration of volume analysis with pattern detection
- **Multi-Candle Pattern Recognition**: Three-candle formations and complex patterns
- **Context-Aware Detection**: Patterns validated against market structure
2. Advanced Divergence System
- **Multi-Oscillator Analysis**: RSI, CCI, and MACD divergence detection
- **Four Divergence Types**: Regular bullish/bearish and hidden bullish/bearish
- **Pivot-Based Detection**: Systematic swing high/low identification
- **Weighted Signal Integration**: Divergences integrated into confluence scoring
3. Modern Price Action Concepts
- **Fair Value Gaps (FVG)**: Identification of institutional inefficiencies
- **Order Block Detection**: Volume-validated accumulation/distribution zones
- **Dynamic Support/Resistance**: Touch-count validated levels with ATR tolerance
- **Breakout Analysis**: Volume-confirmed price breakouts
4. Intelligent Confluence System
- **Multi-Signal Aggregation**: Combines patterns, oscillators, divergences, and breakouts
- **Weighted Scoring Algorithm**: Different signal types receive appropriate weighting
- **Visual Confluence Display**: Clear indication of high-probability setups
- **Reason Tracking**: Shows which signals contribute to confluence
How to Use
Initial Configuration
1. **Enable Desired Components**: Toggle individual analysis modules based on learning focus
2. **Adjust Sensitivity Settings**: Configure pattern detection parameters for your market
3. **Select Divergence Options**: Choose oscillators and divergence types to monitor
4. **Set Confluence Requirements**: Define minimum signals needed for confirmation
Component Settings
Moving Average Configuration
- Four customizable MA lines for multi-timeframe trend analysis
- Selectable MA types (SMA, EMA, WMA, VWMA, HMA)
- Independent timeframe settings for each MA
Pattern Recognition Settings
- **Engulfing Patterns**: Strong engulfing with ATR validation
- **Doji Variations**: Standard, gravestone, and dragonfly detection
- **Hammer/Hanging Man**: Context-validated reversal patterns
- **Star Formations**: Morning and evening star patterns
- **Three Soldiers/Crows**: Momentum continuation patterns
Divergence Detection Parameters
- **Lookback Period**: Adjustable swing detection range
- **Minimum Pivot Strength**: Percentage threshold for valid pivots
- **Oscillator Selection**: RSI, CCI, MACD, or combination
- **Divergence Types**: Regular and hidden divergences
Signal Interpretation
Visual Indicators
- **Pattern Labels**: Clear marking of detected formations
- **Divergence Lines**: Visual connection between price and oscillator pivots
- **Support/Resistance Levels**: Dynamic horizontal levels with validation
- **Confluence Signals**: Large "BULL" or "BEAR" labels for high-probability setups
Dashboard Information
- Real-time oscillator values (RSI, CCI, MACD)
- Current signal count for bulls and bears
- Active divergence status
- Confluence confirmation status
Important Educational Considerations
Learning Focus
- **Pattern Study**: Understand how traditional patterns form and their limitations
- **Divergence Concepts**: Learn to identify momentum shifts before price reversals
- **Confluence Theory**: Practice combining multiple analysis techniques
- **Risk Awareness**: No pattern or signal guarantees future price movement
Limitations for Learning
- **Historical Analysis**: Patterns are identified after formation
- **No Predictive Guarantee**: Educational tool for understanding concepts, not predictions
- **Market Context Required**: Patterns should be considered within broader market context
- **Practice Required**: Effective use requires study and practice
Educational Best Practices
1. **Start Simple**: Enable one component at a time to understand each concept
2. **Paper Trade**: Practice identifying signals without real money risk
3. **Study Failed Signals**: Learn why patterns fail to improve understanding
4. **Combine with Other Analysis**: Use alongside fundamental and sentiment analysis
5. **Document Observations**: Keep a journal of pattern occurrences and outcomes
Technical Components
Indicator Architecture
- **Modular Design**: Independent modules for different analysis types
- **Performance Optimization**: Efficient calculation methods for smooth operation
- **Visual Management**: Controlled use of Pine Script drawing objects
- **Array-Based Storage**: Efficient data management for historical analysis
Calculation Methods
- **ATR-Based Validation**: Volatility-adjusted pattern filtering
- **Volume Analysis**: Comparative volume assessment for confirmation
- **Pivot Detection**: Mathematical identification of swing points
- **Statistical Validation**: Touch-count and tolerance-based S/R levels
Divergence Detection Methodology
Regular Divergences (Reversal Signals)
- **Bullish**: Price lower low + Oscillator higher low
- **Bearish**: Price higher high + Oscillator lower high
Hidden Divergences (Continuation Signals)
- **Hidden Bullish**: Price higher low + Oscillator lower low
- **Hidden Bearish**: Price lower high + Oscillator higher high
Validation Criteria
- Minimum pivot strength requirement (percentage-based)
- Lookback period for swing detection
- Multiple oscillator confirmation option
Confluence Scoring System
Signal Categories
1. **Pattern Signals** (Weight: 1): Candlestick formations
2. **Oscillator Signals** (Weight: 1): RSI/CCI extremes
3. **Breakout Signals** (Weight: 1): Volume-confirmed breaks
4. **Regular Divergences** (Weight: 2): Higher probability reversals
5. **Hidden Divergences** (Weight: 1): Trend continuation signals
Confluence Thresholds
- Adjustable minimum signal requirement (2-6 signals)
- Visual indication when threshold is met
- Detailed reason display for educational understanding
Educational Dashboard
Real-Time Metrics
- Oscillator readings (RSI, CCI, MACD)
- ATR volatility measurement
- Bull/Bear signal counts
- Divergence status
- Confluence confirmation
Customization Options
- Position selection (6 screen locations)
- Color customization for all elements
- Enable/disable individual components
Version Information
- **Version 1.1**: Added comprehensive divergence detection system
- **Educational Focus**: Designed for learning technical analysis concepts
- **Integration**: All components work together in confluence system
Disclaimer
This indicator is designed exclusively for educational purposes to demonstrate technical analysis concepts. It is not financial advice and should not be used as the sole basis for trading decisions. Past patterns and signals do not guarantee future results. Trading involves substantial risk of loss. Users should conduct their own research, practice with demo accounts, and consider seeking advice from qualified professionals before making investment decisions.
Learning Resources
The indicator includes extensive inline comments explaining each calculation and concept. Users are encouraged to study the source code to understand the methodology behind each component. This transparency aids in learning how technical indicators work and their limitations.
---
**Note**: This is an educational tool meant to help traders learn pattern recognition and technical analysis concepts. Success requires practice, additional analysis, and proper risk management.

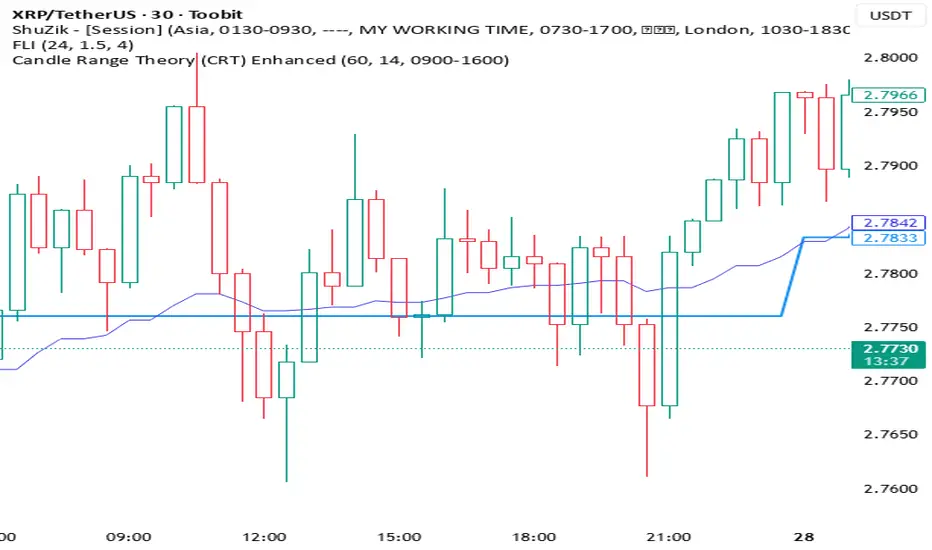
Candle Range Theory (CRT) Enhanced✨ Key upgrades over your version:
Uses multi-timeframe high/low/mid as the reference range.
Adds false breakout candle filter (manipulation logic).
Adds liquidity sweep checks.
Filters out tiny candles (low range = noise).
Adds session filter (only valid during chosen active times).
Plots the HTF midpoint line for reference.
Leaves placeholders for order block / risk management logic.
$ - HTF Sweeps & PO3HTF Sweeps & PO3 Indicator
The HTF Sweeps & PO3 indicator is a powerful tool designed for traders to visualise higher timeframe (HTF) candles, identify liquidity sweeps, and track key price levels on a lower timeframe (LTF) chart. Built for TradingView using Pine Script v6, it overlays HTF candle data and highlights significant price movements, such as sweeps of previous highs or lows, to help traders identify potential liquidity sweep and reversal points. The indicator is highly customisable, offering a range of visual and alert options to suit various trading strategies.
Features
Higher Timeframe (HTF) Candle Visualisation:
- Displays up to three user-defined HTF candles (e.g., 15m, 1H, 4H) overlaid on the LTF chart.
- Customisable candle appearance with adjustable size (Tiny to Huge), offset, spacing, and colours for bullish/bearish candles and wicks.
- Option to show timeframe labels above or below HTF candles with configurable size and position.
Liquidity Sweep Detection:
- Identifies bullish and bearish sweeps when price moves beyond the high or low of a previous HTF candle and meets specific conditions.
- Displays sweeps on both LTF and HTF with customisable line styles (Solid, Dashed, Dotted), widths, and colours.
- Option to show only the most recent sweep per candle to reduce chart clutter.
Invalidated Sweep Tracking:
- Detects and visualises invalidated sweeps (when price moves past a sweep level in the opposite direction).
- Configurable display for invalidated sweeps on LTF and HTF with distinct line styles and colours.
Previous High/Low Lines:
- Plots horizontal lines at the high and low of the previous HTF candle, extending on both LTF and HTF.
- Customisable line style, width, and color for easy identification of key levels.
- Real-Time Sweep Detection:
-Optional real-time sweep visualisation for active candles, enabling traders to monitor developing price action.
Alert System:
- Triggers alerts for sweep formation (when a new sweep is detected).
- Triggers alerts for sweep invalidation (when a sweep is no longer valid).
- Alerts include details such as timeframe, ticker, and price level for precise notifications.
Performance Optimisation:
- Efficiently manages resources with configurable limits for lines, labels, boxes, and bars (up to 500 each).
- Cleans up outdated visual elements to maintain chart clarity.
Flexible Configuration:
- Supports multiple timeframes for HTF candles with user-defined settings for visibility and number of candles displayed (1–60).
- Toggle visibility for HTF candles, sweeps, invalidated sweeps, and high/low lines independently for LTF and HTF.
This indicator is ideal for traders focusing on liquidity hunting, order block analysis, or price action strategies, providing clear visual cues and alerts to enhance decision-making.

Gabriel's Triple Impulsive Candle DetectorTriple Impulsive Candle Detector
Overview, critical for catching impulse moves in either direction.
SPX Income System is a rule-based framework designed to identify frequent, high-probability income opportunities on the S&P 500 cash index (SPX/SPY) using 0-DTE credit spreads. The core engine operates on 30-minute Impulse bars during the morning trade window and can be extended with optional modules for afternoon, overnight, and weekly swing opportunities. The methodology centers on a single, mechanical price event called a Impulse Bar (small wick to body ratio) to minimize discretion and keep execution consistent.
🔶What’s Inside
Core Strategy: SPX Daily Income
Timeframe: 3 kinds of 30-min bars.
Window: 09:30–11:30 ET (new setups only)
Instrument: SPX (cash index, XSP/SPY), executed with $5-wide credit spreads on 0-DTE SPX options
Bullish Setup
Entry on the break of setup bar high
Use an at the money put credit spread
Bearish Setup
Entry on the break of setup bar low
Use an at the money call credit spread
Intent: Enter shortly after setup; manage to >80% max profit or EOD expiration if SPX. If it's another stock, then a 1.5~2x D ATR is suggested.
Signal: An Impulse Bar that closes at/near the high (bullish) or low (bearish) of its 30-min range, verified with Volume above average.
Risk—limited to the risk of the option spread.
The spread is 5 dollars wide
The premium collected is $2.50
$5 - 2.50 = $2.50, or the breakeven point.
Which means what's left is the risk involved.
The risk is $2.50 per spread
🔶Why the 30-Minute Chart?
The 30-minute bar is the “chart of choice” because it filters noise and aligns with morning institutional flows.
On alternate timeframes, price often retraces half the candle body before following through.
On the 30m: the follow-through is more consistent, especially with 2x volume confirmation.
Adding support/resistance levels at the impulse bar hl2 strengthens execution.
This strategy has roots in MTF Crypto, and SPX/SPY TPO-Order Block logic.
🔶Bonus Examples:
🔹Afternoon SPX Income
Second chance window (typically 14:00–15:00 ET) if the morning trade has exited, 60-min bars instead.
🔹ORB 30 – Opening Range Break (first 30 min)
Classic ORB with an income twist for early action when time is limited. This can be entered on the 15 minute candle break.
🔹ORB 60 – Opening Range Break (second 30 min)
A follow-up ORB variant for traders who miss the first window, verified on a 60-min chart. Enter on the final 3 minutes of the hourly candle or wait for a pullback.
🔹B&B – Bed & Breakfast (Overnight)
Identifies income setups via the 10-minute chart in the last 30–60 minutes of the session with next-day open as the exit.
🔹JB – Just Breakfast
Uses the prior day’s end-of-day setup to enter at the opening bell, then manages into the daily income flow. I trade 0-date, and selling an ITM spread either partially or fully then gives me a head start on the daily income potential. This may work better if you either roll or the ORB 30 also meets the criteria.
🔹All-Day-Scalper
Converts income logic into 30-minute scalps using deep 75/80 delta ITM options as synthetic stock (requires >PDT). Meaning that the option will behave as if it is stock. This strategy comes with a warning: it's better if you can day trade.
🔹Tag ’n Turn—Weekly SPX Income Swing
Weekly swing overlay using 30-min Pulse Bars + Bollinger Bands (50) for 3–7 day swings and as a filter for daily income alignment. I use the TTM Squeeze and obtain similar results. Target heuristics (directional days) with a fired squeeze.
Part of my Gamma Scalping System.
🔶The Impulse Bar (10~40% Wick to Body Bar)
An Impulse Bar is a candle that:
Bullish: Closes higher than it opens and within the top ~10% of its high-low range.
Bearish: Closes lower than it opens and within the bottom ~10% of its high-low range.
Practical tip: Many traders mark 0-10-80-100% levels on the candle range (custom Fib or ruler) to quickly validate Pulse Bars. If it's accompanied by a volume spike, then it's better quality.
🔶SPX Daily Income—Rules & Execution
🔹Rules
Chart: 30 min, no indicators required. Pure PA, TPO-based strategy.
New Setups: 09:30–11:30 ET
Instrument: SPX signals, executed via SPX 0-DTE credit spreads ($5 wide, $2 for SPY)
🔹Entries
Bullish: Enter on a break of the setup bar high, use ATM put credit spread
Bearish: Enter on a break of the setup bar low, use ATM call credit spread
🔹Exits
Primary: Close at >80% of max profit (credit received)
Alternate: Hold to EOD expiration
Stop: Risk of the spread (defined by width – credit)
Target Heuristics (directional days)
Optional: 1.5–2× ATR as a reference (mirrors directional follow-through that often accelerates the >80% outcome)
Credit Guidance (typical)
OTM short strike ≈ $2.40
ITM short strike ≈ $2.50–$2.80
2× ITM short strike ≈ $2.80–$3.00
Trade Management (PDT-Aware)
If under PDT, many prefer set-and-forget with GTC buy-back (e.g., $0.20) or EOD expiration.
1:00 PM ET time check
Trending day ±$15–$20 SPX: usually no action, run to expiration
Non-trending day ±$5 SPX: consider taking 40–60% if available (optional) to avoid 50/50 end-of-day decay dynamics
Rationale: Without a favorable trend by ~1 PM, the odds of a late push decline; choosing a controlled partial outcome can improve long-run expectancy and reduce variance.
🔶Examples (Conceptual)
🔹Bullish: A green dot marks a bullish impulse bar; minor follow-through pushes the spread to >80% quickly.
🔹Bearish: A red triangle marks a bearish Impulse Bar; a modest down move is often sufficient for >80–95%.
🔹Tag ’n Turn—Weekly Swing (Filter & Stand-Alone)
Chart: 30-minute
Overlay: Bollinger Bands 50 (mean-reversion lens), or KC or TTM.
Setup: Tag of upper/lower band + Pulse Bar, enter on break of Pulse Bar in that direction
Target: Opposite Bollinger Band
Use Case: 3–7 day swings and a directional filter for Daily Income signals (trade with weekly bias)
🔹Afternoon SPX Income: Same Pulse logic, 14:00–15:00 ET window.
🔹ORB 30 / ORB 60: Uses 30/60-min opening range; can relax Pulse threshold (up to 40% bars) for early positioning when time-constrained.
🔹B&B (Overnight): Lasts 30–60 minutes; closes the next day at open or after the first 30-minute bar.
🔹JB (Just Breakfast): Enter at open using prior day’s signal; optionally roll into Daily Income if eligible.
🔹All-Day-Scalper: Deep ITM options (~0.75–0.80 delta) as synthetic stock.
Entry: Long ITM option
Stop: ~40% of option price
Target: 70–150% or 30-minute timed exit
Note: Time-intensive; for accounts above PDT.
🔹Brokerage: Must efficiently support SPX options; a <10% spread between OI and Volume is ideal. Preferences vary; Tastytrade, Thinkorswim, and Interactive Brokers are common choices. Use what’s reliable, available in your region, and cost-effective.
🔶Alerts (Check-in)
Bullish Impulse Detected (within 09:30–11:30 ET)
Bearish Impulse Detected (within 09:30–11:30 ET)
Afternoon Pulse (14:00–15:00 ET)
ORB 30/60 Trigger
B&B Window Open (last 60 mins)
JB at Open
Tag ’n Turn: Band Tag + Impulse (Bull/Bear)
🔶Inputs (Typical)
Session windows (morning, afternoon, last hour) ~5~15 Average Bar
Impulse threshold (strict 10% vs relaxed up to 40% for ORB variants)
Marker/label styles (bull/bear colors, dots vs arrows)
Filters (optional ATR TP, band touch BB(50-SMA, 2 Stdv.) for Tag ’n Turn)
Alert toggles (on-close for webhooks)
🔶Best Practices
One playbook, many Doors: Start with daily income; add afternoon or B&B/JB only after you’re consistent.
Credit discipline: Don’t chase poor pricing; stick to the credit guidance.
Time awareness: If no trend by ~1 PM ET, consider variance control.
Weekly bias: When using Tag ’n Turn, align daily trades with the weekly swing direction for added confluence.
Risk is defined as width – credit = max risk per spread. Size, accordingly, 1~2%.
🔶Disclosures & Risk
This is not financial advice. Options involve risk and are not suitable for all investors. Past performance (including backtests or theoretical studies) does not guarantee future results. Slippage, fills, assignment risk, and latency can materially impact outcomes. Trade a plan you fully understand and always size for durability. On the Daily, the Impulse bars, are often a signal that you should plan for it to return back to half of the Candle's body, and plan accordingly. Plot a horizontal support/resistance level and see how price reacts to it. Keep house-money, and use 1~2% Risk, reduce exposure when VIX is low and increase it when VIX is high.
TL;DR (Summary)
Signal: 30-min Pulse Bar (strict 10% close in range)
Window: 09:30–11:30 ET (new setups)
Execution: 0-DTE $5-wide SPX credit spreads
Exit: >80% max profit or EOD
Add-ons: Afternoon, ORB 30/60, B&B/JB overnights, All-Day-Scalper, Tag ’n Turn weekly swing/filter
Philosophy: Fully rule-based, minimal discretion, production-line consistency 0-date.

Multi-indicator trading screener with visual overlays V2Special Thanks to community out there.
I just combined famous scripts from different authors.
------------------
More advance and with more protection with indicator priority system which to use under which condition while buying and selling. long or short
------------------
Main Components
1. Order Block Detection
2. Trend Analysis
3. Signal Generators
4. Visual Overlays

智能资金BOS指标“智能资金BOS指标”是一个复杂的主图指标,整合了多种市场分析工具,基于智能资金(Smart Money)理念,分析市场结构(Market Structure)、订单块(OB)、公平价值缺口(FVG)以及溢价/折扣区域
The "Smart Money BOS Indicator" is a complex main chart indicator that integrates multiple market analysis tools. Based on the concept of Smart Money, it analyzes market structure, order block (OB), fair value gap (FVG), and premium/discount areas

OrderVibe indicator (Invite-Only)What it is
OrderVibe is a closed-source tool that visualizes market structure and volatility. It does not generate trade calls or manage orders. It draws zones/levels and optional alerts so traders can build their own process.
How it works - technical overview (conceptual)
* Trend regime filter (optional). Uses a sloped moving-average baseline to qualify trend and can require higher-timeframe (HTF) agreement.
* Momentum gate. A smoothed, rate-of-change–style momentum must align with the trend and exceed a configurable strength threshold.
* Volatility filter. ATR-based bounds suppress setups when volatility is unusually low or high for the instrument.
* Order-block zones (SMC element). Marks candidate OB zones derived from pre-break structure and uses them for confluence; zones invalidate on decisive closes.
* Support/Resistance. Clusters recent pivots into zones using ATR-relative distance, keeping the most relevant areas by recency/proximity.
* Informational entry label. Prints on controlled retests of active zones when trend/momentum/volatility conditions are met. Labels are informational only.
* Baseline stop suggestion. Suggests a protective distance based on ATR or recent swing, whichever is more conservative.
* ATR TP ladder (TP1-TP10). Optional multi-level targets built from ATR multiples; per-level toggles and alerts.
* Cooldown. After a label, a short cooldown prevents duplicates; invalid zones are removed automatically.
* Alerts (optional). New S/R zone, new OB zone, TP reached, and related events.
Why it’s not a simple mashup
* Dual qualification (trend + momentum) with optional HTF agreement.
* Volatility-aware suppression and ATR-normalized zone clustering.
* Integrated ATR TP ladder with per-level controls and cooldown in one workflow.
* Provides clear value beyond classic MA/ATR combinations by combining HTF-aware gating, ATR-relative zone clustering, and structured multi-target management.
How to use
* Works on any symbol; defaults are calibrated for intraday XAUUSD.
* Adjust ATR lengths/ranges and TP multipliers to your instrument.
* Hide unused TP levels; forward-test before using live.
* Educational analytics only; no signals or advice.
Disclaimer
Analytical tool only. This is not financial advice and outcomes are not guaranteed. Use independent judgment and risk management.
Access
Access is invite-only and granted manually on TradingView. For contact details, see my Signature.

PreviousDayHLEQCME_MINI:NQ1!
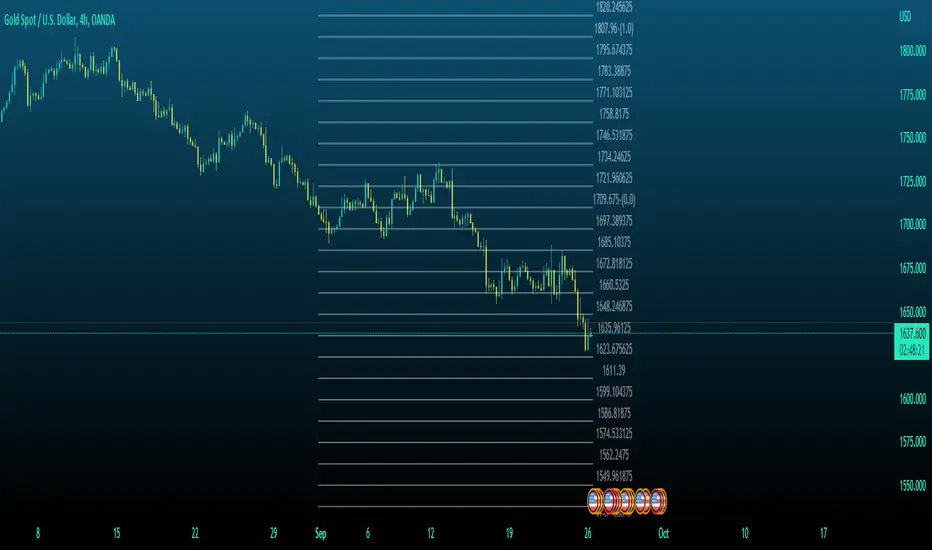
Indicator Overview: The "PreviousDayHLEQ" indicator is an essential tool for traders employing Inner Circle Trader (ICT) methodologies, designed to plot the High (H), Low (L), Equilibrium (EQ, the midpoint between high and low), and Optimal Trade Entry (OTE) levels at 61.8%, 70%, and 79% of the previous trading day's range. It provides a clear visual reference for potential support, resistance, and entry zones based on the prior day's price action, helping traders anticipate continuations or reversals in the current day. This indicator stands out by incorporating directional OTE auto-detection, adjusting levels based on whether the previous day formed a new high or low relative to the day before, offering insights into market bias without manual recalculation.
Core Functionality: It tracks and displays the previous day's high and low, calculating the EQ as the average for balance points, and OTE levels as percentage retracements of the range. The script uses a user-defined trading day definition (with timezone support) to accurately capture the day's extremes, ensuring alignment with global market sessions. This core setup allows traders to quickly identify key ICT levels like fair value gaps or liquidity pools from the prior day.
Unique OTE Auto Detection: One of the indicator's most innovative features is its automatic detection of OTE direction. If the previous day made a new high compared to the day before, OTE levels are calculated downward from the high to the low (bearish bias), highlighting potential short entries. Conversely, a new low triggers upward OTE levels from the low to the high (bullish bias), signaling long opportunities. This auto-detection is unique, as it dynamically adapts to historical price expansion without user input, a capability not found in standard previous day indicators that typically use fixed directions. It empowers ICT traders to gauge carry-over momentum from the prior day, such as in scenarios where a bullish expansion suggests buying dips to the 61.8% level.
Directional Bias Indication: Beyond plotting levels, the OTE calculation inherently indicates the previous day's bias (expansion upward or downward), providing context for current day trades. This unique bias detection helps traders align with market structure, e.g., favoring shorts if OTE is downward-oriented, enhancing decision-making in ICT frameworks like order block identification.
Left-Side Trimming Innovation: The indicator includes a highly unique left-side trimming option, allowing users to restrict the historical extension of lines to a specified number of bars (e.g., the last 8 bars). This reduces visual clutter on charts with long history, focusing attention on recent and relevant price action—a feature rarely seen in previous day indicators, where lines often span the entire chart and obscure current developments. Traders can toggle trimming on/off and adjust the bar count, making it ideal for clean, professional setups.
Customization and Visual Controls: Users can fully customize line colors (separate for high, low, EQ, and each OTE level), styles (solid, dashed, dotted), and label properties (text color, background color, transparency, size). This level of granularity ensures the indicator fits any chart theme or strategy, with options to enable/disable individual elements like EQ or OTE for minimalistic views. The stick-right label option keeps labels visible as the chart updates, preventing overlap.
Auto-Deletion at Trading Day End: Levels can be automatically cleared at the indicator's calculated market close (17:00 NY time), a unique feature that prevents accumulation of outdated data, keeping the chart fresh for the next day. This is particularly useful for day traders who reset their setups daily.
No External Dependencies: The indicator operates solely on chart price data using built-in Pine Script functions, ensuring reliability and compatibility without needing additional libraries or internet access.
How It Works
Previous Day Data Capture: The script identifies the previous trading day using the user-defined timezone and calculates high, low, EQ, and OTE levels based on that day's range.
OTE Calculation: Levels are computed as percentages of the range, with auto-detection switching direction if a new high/low was made relative to the day before.
Drawing and Trimming: Lines are plotted with user-set padding for extension, and trimming cuts the left side to focus on current action.
Update Mechanism: Levels update in real-time as the previous day's data is fixed, but the script refreshes on chart reloads or new days.
Deletion Logic: At market close, if auto-delete is enabled, all elements are removed to prepare for the next cycle.
Uniqueness and Innovation
Session OTE Auto Detection: Automatically determines OTE direction based on previous day's high/low expansion, a rare feature that provides bias insights not available in basic previous day high/low indicators, aiding ICT traders in identifying entry zones with market context.
Left-Side Trimming: This innovation allows customizable historical line length, solving chart clutter issues unique to previous day indicators that typically show full history, enhancing usability for live trading.
Directional OTE with Multi-Level Support: Combines auto-bias detection with three OTE percentages (61.8%, 70%, 79%), offering more granular entry options than single-level tools, tailored for ICT's focus on range retracements.
Independent Customization per Element: Separate controls for high, low, EQ, and OTE colors/styles, plus transparency and size, provide unmatched flexibility compared to rigid indicators.
Auto-Deletion for Cleanliness: Unique cleanup at market close prevents level buildup, a practical feature for multi-day analysis not commonly implemented in similar tools.
How to Use It
Setup: Add to chart, configure timezone (e.g., "America/New_York"), and enable the indicator.
Customization: Adjust line colors (e.g., blue for high), styles (dashed for OTE), and enable trimming (8 bars for focus).
Interpretation: Use OTE for entries (e.g., buy at 61.8% in bullish bias); EQ for reversion.
Tips: Test on historical data; combine with ICT concepts like CISD, FVG etc.
This indicator elevates ICT trading with its auto-detection and trimming. Use with risk management; trading carries risk

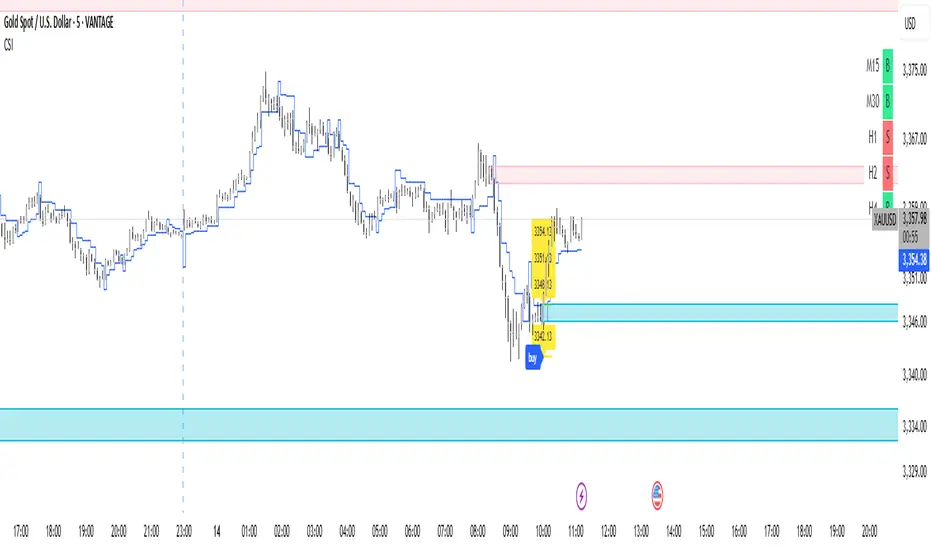
CSI IndicatorThis script provides a visual trend dashboard that may assist scalpers and day traders in identifying potential setups by aligning multiple timeframes.
✅ Trend Dashboard
Located at the top-right corner of the chart, the dashboard includes two key components:
1. CMP (Current Market Price) :
Shows the primary trend signal and current directional bias.
2. VCS (Verified Confirmation Signal) :
Confirms the trend's strength and alignment across higher timeframes.
✅ Basic Entry Rules For :
1. Scalper Trader
* CMP timeframe: M15
* VCS timeframe: M30
* Only enter when CMP = VCS
* If not aligned: Follow display on M15
2. Day Trader
* CMP timeframe: H1
* VCS timeframe: H2
* Only enter when CMP = VCS
* If not aligned: Follow display on H1
✅ Risk Management & Stop Loss (SL)
* Use the blue line as a dynamic SL.
* Consider not placing SL too close, as the line adapts dynamically to price action.
✅ Customize Chart With Optional Tools
* Tiered Take Profit Level
* Custom Stop Loss Level
* Display Order Block Zone