Pivot Points High Low - JVersion**Indicator Name**: Pivot Points High Low (Without Price Labels)
**Overview**
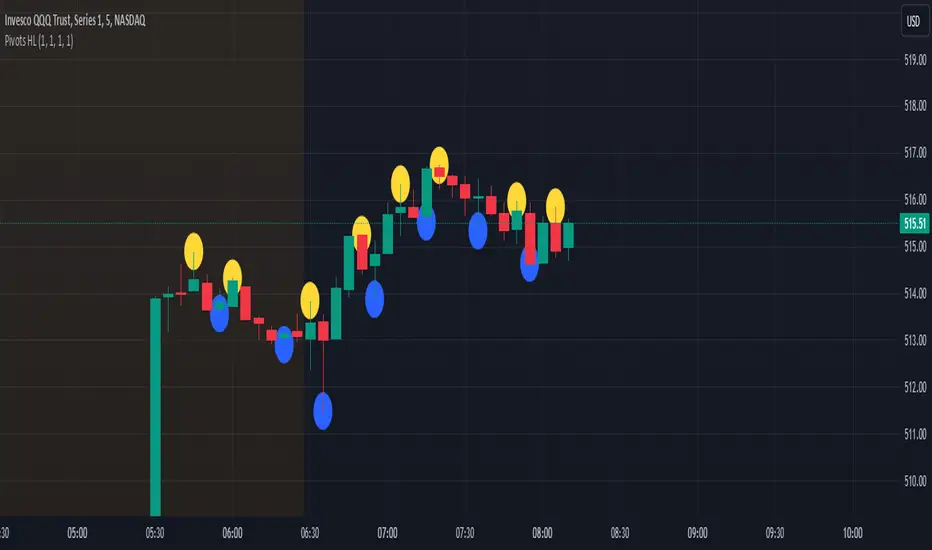
The Pivot Points High Low indicator is designed to identify and mark local highs and lows (or “pivot” points) on a price chart. Unlike other pivot-based indicators that label each pivot with its exact price, this version displays only small circular markers—removing clutter and focusing attention on the pivot locations themselves.
**Key Features**
1. **Pivot Detection**
- The script uses TradingView’s built-in `ta.pivothigh()` and `ta.pivotlow()` functions to determine when the market has formed a pivot high or pivot low.
- You can define how many bars to the left and right are required to confirm a pivot, helping you tailor the indicator to different market conditions and timeframes.
2. **Clean Markers**
- Each confirmed pivot high or low is represented by a circle placed precisely on the candle where the pivot is detected.
- No numeric labels are shown, keeping your chart visually uncluttered while still highlighting important turning points in price.
3. **Customization**
- **Left/Right Pivot Length**: Choose how many bars to the left and right must be lower (for highs) or higher (for lows) to validate a pivot. Larger values mean fewer but more significant pivots; smaller values mean more frequent pivots.
- **Marker Colors**: Independently customize the colors of the high-marker circles and low-marker circles to easily distinguish between local tops and bottoms.
4. **Usage and Interpretation**
- **Identifying Reversals**: As soon as a circle appears at a local high or low, it may indicate a short-term trend reversal or the beginning of a new swing in price.
- **Combine with Other Tools**: Pivot points are more informative when used alongside broader trend analysis, support/resistance identification, or other momentum indicators.
- **Adjusting Sensitivity**: By increasing or decreasing the left/right pivot lengths, you can make the indicator more or less sensitive to small market fluctuations.
5. **Practical Tips**
- **Swing Trading**: Shorter lengths can be used by swing traders looking for quick reversals in lower timeframes.
- **Longer-Term Trends**: Larger lengths are better for position traders or those who prefer to see only major turning points in the market.
- **Clean Chart Layout**: Because text labels are removed, you can visually focus on the circles—especially helpful if you use multiple indicators and prefer a less cluttered chart.
---
By pinpointing local highs and lows without price labels, the **Pivot Points High Low** indicator keeps charts neat yet informative, allowing traders to quickly recognize potential turning points in the market and make more informed decisions.
在脚本中搜索"pivot"
Liquidations Zones [ChartPrime]The Liquidation Zones indicator is designed to detect potential liquidation zones based on common leverage levels such as 10x, 25x, 50x, and 100x. By calculating percentage distances from recent pivot points, the indicator shows where leveraged positions are most likely to get liquidated. It also tracks buy and sell volumes in these zones, helping traders assess market pressure and predict liquidation scenarios. Additionally, the indicator features a heat map mode to highlight areas where orders and stop-losses might be clustered.
⯁ KEY FEATURES AND HOW TO USE
⯌ Leverage Zones Detection :
The indicator identifies zones where positions with leverage ratios of 100x, 50x, 25x, and 10x are at risk of liquidation. These zones are based on percentage moves from recent pivots: a 1% move can liquidate 100x positions, a 4% move affects 25x positions, and so on.
⯌ Liquidated Zones and Volume Tracking :
The indicator displays liquidated zones by plotting gray areas where the price potentually liquidate positons. It calculates the volume needed to liquidate positions in these zones, showing volume from bullish candles if short positions were liquidated and volume from bearish candles for long positions. This feature helps traders assess the risk of liquidation as the price approaches these zones.
⯌ Buy/Sell Volume Calculation :
Buy and sell volumes are calculated from the most recent pivot high or low. For buy volume, only bullish candles are considered, while for sell volume, only bearish candles are summed. This data helps traders gauge the strength of potential liquidation in different zones.
Example of buy and sell volume tracking in active zones:
⯌ Liquidity Heat Map :
In heat map mode, the indicator visualizes potential liquidity areas where orders and stop-losses may be clustered. This map highlights zones that are likely to experience liquidations based on leverage ratios. Additionally, it tracks the highest and lowest price levels for the past 100 bars, while also displaying buy and sell volumes. This feature is useful for predicting market moves driven by liquidation events.
⯁ USER INPUTS
Length : Determines the number of bars used to calculate pivots for liquidation zones.
Extend : Controls how far the liquidation zones are extended on the chart.
Leverage Options : Toggle options to display zones for different leverage levels: 10x, 25x, 50x, and 100x.
Display Heat Map : Enables or disables the liquidity heat map feature.
⯁ CONCLUSION
The Liquidation Zones indicator provides a powerful tool for identifying potential liquidation zones, tracking volume pressure, and visualizing liquidity areas on the chart. With its real-time updates and multiple features, this indicator offers valuable insights for managing risk and anticipating market moves driven by leveraged positions.

Stop Hunts [MK]Liquidity rests above/below previous highs and lows because these are the areas where traders are most likely to leave their orders/stop losses. The market can tap into this liquidity source by going beyond the previous highs and lows, this liquidity can then be used to reverse the market in the opposite direction.
As traders we may want to know if price will continue beyond previous highs and lows, or reverse the market. If price looks to be reversing after tapping into liquidity, this can be a good area to enter a trade. The same area can be used as a take profit level also.
The indicator identifies previous high/lows in two ways:
1. previous high/lows using 'PIVOT POINTS'. Pivots are easy to spot and are obvious within a price trend. Also called 'higher highs", "lower lows" etc. The number of candles required to form the pivot point can be adjusted in the script settings.
see below example of pivot point and stop hunt:
www.tradingview.com
see how price reversed upwards after stop hunt on pivot point above.
2. previous candle high/lows. A previous candles high and low are also good areas of liquidity.
see below example of previous candle stop hunt:
see how price reversed upwards after stop hunt on previous candle low above.
Personally, I use the pivot point stop hunts on lower timeframes and previous candle stop hunts on higher timeframes. However users can adjust on which timeframes to show the indicator depending on their own trading style.
As ever all items within 'settings' are customizable.
The indicator is by no means a 'trading strategy' and users should be fully aware of the stop hunt concept and have conducted extensive back-testing before using with 'live' accounts.
The indicator may also serve as a 'teaching aid' to new students and as a reminder to more experienced traders.

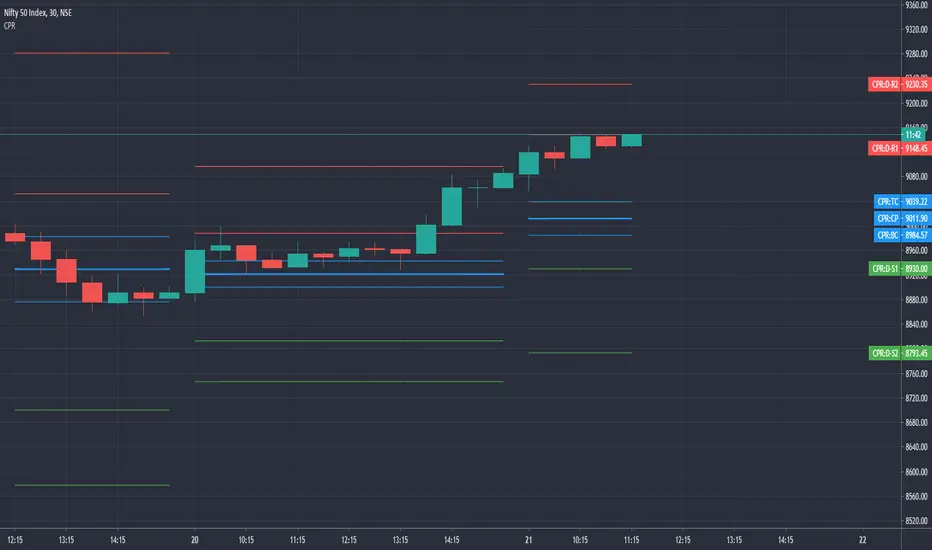
CPR by GuruprasadMeduriThis script will allow to add CPR with Standard Pivot ad 9 levels of support and 9 levels of resistance lines. It has CPR, 3 levels of Day-wise pivots, 3 levels of Weekly pivots and 3 Levels of Monthly Pivots. All the Support and resistance levels can be enabled / disabled from settings. It will allow to select multiple combinations of support and resistance levels across 3 levels at any of the 3 time-frames individually and combined.
These number of combinations will allow user to visualize the charts with desired pivot support & resistance levels on all or any of the 3 time frames.
For Ease of access, listed few points on how the script works..
- CPR and day-wise level 1 & 2 (S1, R1, S2 R2) enabled by default and can be changed from settings
- Day-wise Level 3 (S3 & L3) can be enabled from settings
- Weekly 3 levels and Monthly 3 levels can be enabled from settings
- CPR & pivot levels colored in blue lines
- All support levels colored in Green
- All resistance levels Colored in Red
- Day-wise pivot, support & resistance are straight lines
- Weekly pivot, support & resistance are cross (+) lines
- Weekly pivot, support & resistance are circle (o) lines
- Any combinations can be selected from stettings-> Inputs & style
// - This is an iterative development. Will add more features due course of time. Suggestions are always welcomed!!
Breakouts with timefilter [LuciTech]Here's the updated description with "colors" replaced by "colours" throughout, maintaining the original structure and content:
Breaking Point 2.0
This is a technical analysis overlay indicator designed to identify breakout levels based on pivot highs and lows, with a focus on price action during customizable time windows using London time (UK). It draws horizontal lines at pivot points and plots signals when price breaks above or below these levels, offering traders a tool to monitor potential bullish or bearish movements. The indicator includes options for time filtering and displaying only the most recent breakout.
Features
The Pivot Breakout Lines display horizontal lines at detected pivot highs (bullish) and pivot lows (bearish), coloured green and red by default. These lines extend from the pivot point to the breakout bar and can be set to show only the latest breakout.
The Breakout Signals mark bullish breakouts with an upward triangle below the bar and bearish breakouts with a downward triangle above the bar, using customizable colours.
The Time Filter restricts signals and lines to a specific window (default: 14:30–15:00 UK), which can be toggled on or off. A shaded background highlights this period when enabled.
How It Works
The indicator calculates pivot highs and lows using a user-defined lookback period (default: 5 bars). When price closes above a pivot high, it triggers a bullish signal and draws a line from the pivot to the breakout bar. When price closes below a pivot low, it triggers a bearish signal with a corresponding line.
If the time filter is active, signals and lines only appear within the specified window. Outside this period—or if the filter is disabled—they appear based solely on price action. The indicator maintains up to three recent pivots in memory, removing older ones as new pivots form.
Alerts are available for both bullish and bearish breakouts, triggered when signals occur.
Settings
Length controls the lookback period for pivot detection (default: 5).
Colours Bull/Bear sets the colours for bullish (default: green) and bearish (default: red) lines and signals.
Show Last Breakout toggles whether only the most recent breakout line and signal are displayed (default: false).
Time Filter enables or disables the time restriction (default: true).
Fill Background toggles a shaded area during the time window (default: true), with a customizable colour.
Time Settings define the start hour/minute and end hour/minute for the filter (default: 14:30–15:00).
Interpretation
The Pivot Breakout Lines highlight levels where price has previously reversed, potentially acting as support or resistance. A breakout above a pivot high may suggest bullish momentum, while a breakout below a pivot low may indicate bearish pressure.
The Breakout Signals provide visual cues for these events, useful for timing entries or exits. When "Show Last Breakout" is enabled, the chart focuses on the most recent signal, reducing clutter.
The Time Filter and background shading help traders concentrate on specific trading sessions, such as high-volatility periods. When disabled, the indicator tracks breakouts across all times.

Fractal Levels [BigBeluga]The Fractal Levels - BigBeluga indicator is a specialized tool that detects significant market highs and lows, ranking them by their normalized volume. This indicator is designed to help traders identify crucial price levels that are likely to influence market behavior, enabling better decision-making in trading. By gathering normalized volume around each fractal point, it creates a comprehensive view of the strength and relevance of price reversal points, which can be visualized as numbers or zones on the chart.
🔵KEY FEATURES & USAGE
● High and Low Detection with Volume Ranking:
The indicator detects market highs and lows using a user-defined length setting. For each detected fractal point (high or low), it collects normalized volume from a set number of bars before and after the fractal point (the number is based on the length input). This collection allows the indicator to produce an average of the normalized volume, which is then displayed as a number above or below the corresponding fractal arrows, visually indicating the importance of the high or low.
● Plotting Levels from Fractals:
From these high and low points, the indicator plots key levels. In settings, traders can choose between a wide or tight zone type.
If a price level coincides with multiple pivot points, the indicator highlights this as a significant zone. These zones represent areas where price tends to react, making them critical for identifying potential support and resistance levels.
● Fractal Boxes with Delta Volume Data:
Fractal boxes are shown as gray boxes, representing areas where price pivots occurred, and they also contain delta volume information. Delta volume is calculated by summing the positive and negative volumes within the length range, producing the total delta inside each fractal box. This is particularly useful for analyzing volume shifts around key levels.
● Broken Levels Highlighting:
When a plotted level is broken (price closes above or below it), the level can be removed from the chart automatically. However, in the settings, you can enable a feature to highlight broken levels as gray areas, providing insight into past price behavior. This is helpful for tracking historical support and resistance zones.
> Important note: If no volume data provided indicator wont work
🔵 CUSTOMIZATION
Fractal Length and Filter Settings:
Adjust the Length parameter to control the number of bars used to detect pivot highs and lows. A longer length will result in fewer fractals being identified, focusing on more significant price moves. The Filter option allows you to set a volume threshold, filtering out minor fractals that do not meet the minimum volume requirements.
Levels Detection (Wide or Tight):
Choose between Wide and Tight zones for fractal levels detection. A tight zone focuses on smaller price areas around pivot points, while a wide zone expands the detection range, highlighting larger zones of influence around fractals.
Delta Volume Display for Fractals:
Toggle Delta Volume Fractals to show or hide the delta volume information inside fractal boxes. When enabled, the indicator calculates and displays the total delta volume within the range of bars surrounding each fractal point.
Broken Levels Visibility:
Enable Broken Levels to highlight levels that have been crossed by price. When disabled, broken fractal levels will be removed from the chart after price crosses them.
🔵CONCLUSION
The Fractal Levels indicator provides traders with an advanced way to analyze price highs and lows by combining fractal detection with volume dynamics. By identifying key market levels through normalized volume ranking, delta volume analysis, and level plotting, this tool is invaluable for spotting potential support and resistance zones. Whether you're focusing on short-term trading or longer-term price movements, Fractal Levels offers the precision and flexibility needed to optimize your strategy.

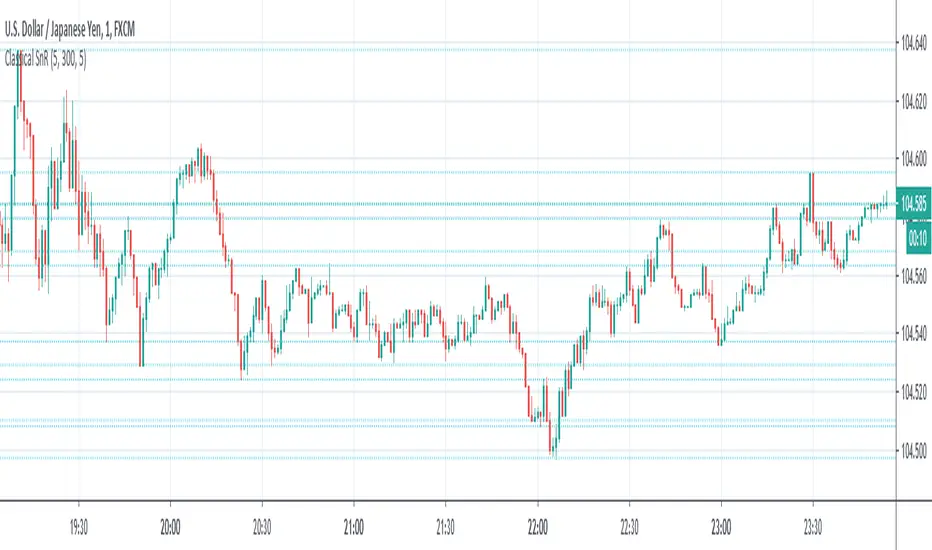
True Strong Classical Support/Resistance LevelsThis script is based on the approach of filtering signals by checking higher timeframes.
So basically setting higher numbers in "Strength Of Levels" option, will make the indicator check for support and/or resistance levels in timeframes higher than the current.
Unfortunately, I was forced to still use inefficient built-in functions pivothigh() and pivotlow(). I hope they fix them up soon!
I'm looking for any opinion about the idea and if you like any of my scripts, anything you send means a lot to me.
This script is published for the third time because of some moderators absurd behavior.
But thank heavens, the code is now more clean and of course the option "Strength Of Levels" accepts float numbers.

Classical Supports & ResistancesThis indicator shows classical resistance and support levels which retraced the chart lately. Notice that the condensed lines laying close together are showing an area of support and/or resistance.
But after all, it was a tedious work creating this indicator because like I've already said, pine script is a very odd and weak language which does not have many ordinary features like useful loops, simple line drawing and even reasonable variable casting!
So I was forced to use its built-in pivothigh() and pivotlow() functions without any handy documentation. I assume that even these functions don't work as expected, and because of that, I embedded "Sensitivity" and "Lookback Time" options in the indicator as a workaround.
Feel free to use it and send me your comments/solutions.
Significant PP - Swing Failure / Stop Run Alerts [QN]Tried to create a script for Swing Failure / Stop Run patterns. It is based on my QuantNomad - "Significant Pivot Reversal" Indicator.
It's quite tricky to code these kinds of patterns, so it's really not ideal. I alert when a candle cross pivot level but close below (above for bottom) it and previous close was below (above) it as well.
You can setup params for pivot points and also by how much it should cross pivot level with "SF ATR Mult".
I have in mind a few other things I'd like to test:
* Different types of pivot points
* Few recent pivot levels at once
* Pivots from higher timeframe
* Different types of "touching" levels
* etc.
Ideally, I want to create a strategy from it, but I'm far from it for now.
Do you have any ideas on how to make it better?
Original Significant Pivot Reversal Indicator:

Structure Pro by MurshidfxInspired by the 'mentfx Structure' indicator created by Anton (mentfx) on TradingView,
## Overview
Structure Pro tracks market structure by maintaining an adaptive dealing range and its midpoint. Swing highs and lows become structural boundaries, and the script responds to confirmed breakouts by recalculating the active range. Labels highlight the latest trend flip so the chart stays readable while the range evolves.
## Core Logic
- Detects swing highs/lows using a configurable pivot strength and promotes confirmed pivots to structural levels.
- Applies a percentage buffer to decide when price truly breaks structure; once triggered, the opposite boundary is recalculated with an anchor search that looks back through historical bars.
- Computes equilibrium as the midpoint between the current structural high and low so you can gauge premium versus discount zones.
- Emits a single BULL or BEAR label when the trend state changes, keeping only the most recent signal on the chart.
## How to Use
1. Open a clean chart and apply only this script.
2. Select a swing strength that matches the scale you want to monitor (lower values for responsive intraday swings, higher values for broader moves).
3. Tune the structure sensitivity percentage if you prefer tighter or looser confirmation before declaring a breakout.
4. Track DRH/DRL for the current dealing range, use the equilibrium line as a mean-reversion guide, and look to the BULL/BEAR label for structure confirmation.
5. Combine the levels with your own execution, risk, and position rules—this script does not manage orders.
## Inputs
- Swing Point Strength: bars required on both sides to confirm a pivot.
- Structure Break Sensitivity: percentage buffer applied to the range before calling a breakout.
- Dealing Range display: toggles for visibility, line width/color, label text, and label size.
- Equilibrium display: line style, width, and color controls.
- Trend Signals: enable/disable labels, adjust text size, and pick label colors.
## Notes
- Designed for live structure tracking; the script relies on confirmed pivots and does not peek into future data.
- Built to be chart-agnostic for standard candles; non-standard chart types can distort the measurements.
- Published open-source so traders can review and verify the implementation details.

ZigZag With ATR Filter [vnhilton](OVERVIEW)
The typical ZigZag indicator, which connects pivot points (see TradingView's Help Center regarding their indicator Pivot Points High Low, for an in depth explanation on how they are calculated) with lines, except instead of a percentage threshold, it uses ATR which adjusts for volatility of the ticker you are viewing. The ZigZag indicator can therefore be used to help visualise price legs and trends on a usually noisy looking chart.
(FEATURES)
- Toggles for pivot point label contents such as the value, the trend, or nothing at all.
- ATR and pivot point periods.
- ATR multiplier minimum threshold to plot pivots and draw lines only when this threshold is met (helps eliminate small, perhaps insignificant price movements, to have a better focus on the overall trend).
- Show the last 2 to 499 ZigZag lines.
- Uptrend, downtrend and range colors for high and low pivot labels, text labels and lines, for both confirmed and real-time plots.
- Label size, and label styles for the high and low pivots.
- Customisable width and styles (Arrow Right, Dashed, Dotted, Solid) for the ZigZag line.
In the main chart picture, labels show both the pivot point value and the trend at that point. In the picture above, on the left shows only the pivot point value, the right shows only the trend.
Picture above shows just the label with 0 contents. Also notice the last recent line being blue instead of green. This is because the current bar hasn't finished so this line is currently live and not confirmed, so is subject to change. Keep in mind even if a pivot point is confirmed, it can be updated by a subsequent higher high/lower low.
Left chart shows a minimum ATR threshold multiplier of 1x; Right chart has 2x ATR minimum threshold. Notice the left chart highlights more price legs as more price legs satisfy a less strict threshold.

Mark StructureMark Structure is building the market swing structure, minor and sub structure and marks all possible insignificant pivots
Building such structure is really complex task to do, that has a lot of obstacles and challenges. I'm doing my best to develop this indicator behaving in absolutely expectable and right way. Fill free to leave any comments or bug reports.
it supports:
- Marking all pivots with labels or join them continuously with trend lines.
- Marking minor and sub structured swings with labels or join them continuously with trend lines. Marking BOS or SMS BOS, which are mbos. Minor and substructure are structures inside swing structure and it can differ from the structure of lower timeframe
- Marking swings of swing structure with labels or join them continuously with trend lines. Marking BOS or SMS BOS of swing structure
- Changing bullish and bearish colors of each kind of structures
- Changing pivot labelings
- Changing colors of BOSs
Remarks:
- As I told you guys before, it has a lot of challenging cases. eg we have swing low and high on the same candle and in order to decide which pivot goes first I take lower time frame data to figure out what pivot is the first, but it happens that on lower time frame the same issue takes place, due to limitation of TradingView I can't go infinitely to lower timeframes to solve this issue, so I mark those cases with labels
- Another issue is very beginning of the trend its hard to detect swing structure there due to missing historical data. so skip a few waves in the very beginning
- Don't expect to have minor and sub structure in each swing waves, its totally fine when you don't have them at all
- Swing structure is the most significant structure and shows real price direction. Trend change is confirmed when for bull->bear the last HLbull LH>HH and HH-HL-HH are confirmed. You can change labelling for unconfirmed swing trend in the settings. By default its already done

Average Daily Range (ADR) (Multi Timeframe, Multi Period)Average Daily Range (ADR)
(Multi Timeframe, Multi Period, Extended Levels)
Tips
• Narrow Zones are an indication of breakouts. It can be a very tight range as well.
• Wider Zones can be Sideways or Volatile.
What is this Indicator?
• This is Average Daily Range (ADR) Zones or Pivots.
• This have Multi Timeframe, Multi Period (Up to 3 Levels) and Extended Target Levels.
Advantages of this Indicator
• This is a Leading indicator, not Dynamic or Repaint.
• Helps to identify the reversal points.
• The levels are more accurate and not like the old formulas.
• Can practically follow the Buy Low and Sell High principle.
• Helps to keep minimum Stop Loss.
Who to use?
• Highly beneficial for Day Traders
• It can be used for Swing and Positions as well.
What timeframe to use?
• Any timeframe.
When to use?
• Any market conditions.
How to use?
Entry
• Long entry when the Price reach at or closer to the Green Support zone.
• Long entry when the Price retrace to the Red Resistance zone.
• Short entry when the Price reach at or closer to the Red Resistance zone.
• Short entry when the Price retrace to the Green Support zone.
• Long or Short at the Pivot line.
Exit
• Use past ADR levels as targets.
• Or use the Target levels in the indicator for breakouts.
• Use the Pivot line as target.
• Use Support or Resistance Zones as targets in reversal method.
What are the Lines?
Gray Line:
• It the day Open or can be considered as Pivot.
Red & Green ADR Zones:
• Red Zone is Resistance.
• Green Zone is Support.
• Mostly price can reverse from this Zones.
• Multiple Red and Green Lines forms a Zone.
• These lines are average levels of past days which helps to figure out the maximum and minimum price range that can be moved in that day.
• The default number of days are 5, 7 and 14. This can be customized.
Red & Green Target Lines:
• These are Target levels.
What are the Labels?
• First Number: Price of that level.
• Numbers in (): Percentage change and Change of price from LTP (Last Traded Price) to that Level.
General Tips
• It is good if Stock trend is same as that of the Index trend.
• Lots of indicators creates lots of confusion.
• Keep the chart simple and clean.
• Buy Low and Sell High.
• Master averages or 50%.

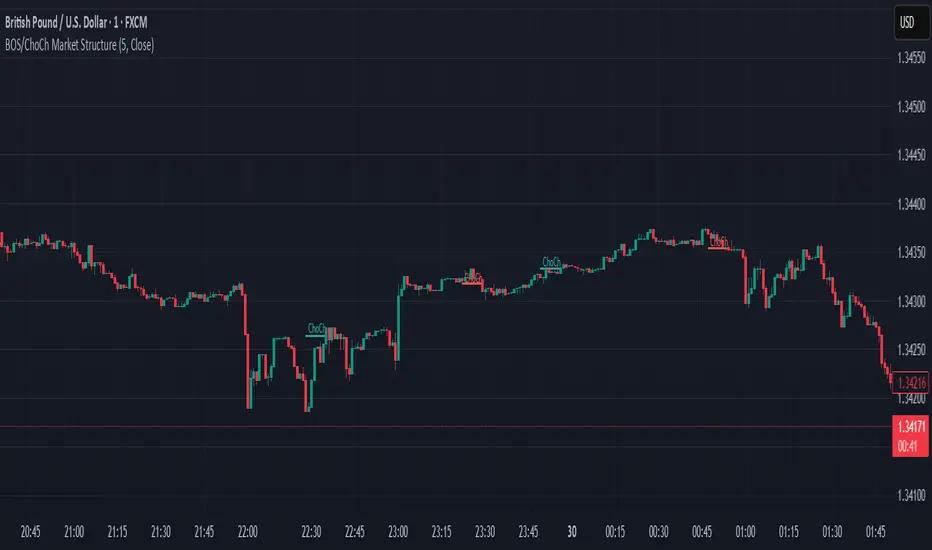
BOS & ChoCh Market StructureBOS/ChoCh Market Structure Indicator
This indicator identifies key market structure shifts using Break of Structure (BOS) and Change of Character (ChoCh) signals based on pivot point analysis.
Concept
Break of Structure (BOS) occurs when price breaks through a significant pivot level in the direction of the current trend, signaling trend continuation. A bullish BOS happens when price breaks above a pivot high while in an uptrend, while a bearish BOS occurs when price breaks below a pivot low during a downtrend.
Change of Character (ChoCh) signals a potential trend reversal. It occurs when price breaks against the prevailing trend - breaking above a pivot high while in a downtrend, or breaking below a pivot low while in an uptrend. This indicates the market structure is shifting.
How It Works
The indicator automatically detects swing highs and lows using configurable pivot strength. When price breaks these levels, it plots:
Color-coded labels (cyan for bullish breaks, red for bearish breaks)
Small horizontal lines marking the exact breakout level
Extended lines from pivot points showing key support/resistance levels
Settings
Pivot Strength - Number of candles on each side required to confirm a swing high/low (default: 5). Higher values identify more significant pivots but produce fewer signals.
Breakout Confirmation - Choose whether breakouts require a candle close beyond the level ("Close") or just a wick touch ("Wick").
Show BOS / Show ChoCh - Toggle visibility of Break of Structure and Change of Character signals independently.
Colors - Customize the colors for bullish (cyan) and bearish (red) signals.
Perfect for swing traders and market structure analysis.
Level Master Pro+ [MMT]Level Master Pro+ Indicator
The Level Master Pro+ is a highly customizable Pine Script indicator designed for TradingView, built to plot key pivot point levels, support and resistance zones, and additional price levels such as previous close, bottom central (BC), and top central (TC) on a chart. This indicator is tailored for traders who rely on pivot-based strategies, offering flexibility in timeframe selection, visual styling, and level visibility to suit various trading styles.
Key Features:
- Pivot Point Levels:
Plots traditional pivot points (P), up to six levels of support (S1–S6) and resistance (R1–R6), previous close (PC), base control (BC), and top control (TC).
Automatically calculates R6 and S6 using the pivot range (high - low) for extended analysis.
Supports customizable timeframes for pivot calculations (default: 1D).
- Customization Options:
Pivot History : Adjust the number of historical pivots displayed (1–200).
Line Styling : Choose line width (1–10), style (solid, dashed, dotted), and transparency (0–100%).
Label Styling : Toggle labels and price values, set label position (left or right), size (tiny to huge), and background transparency.
Color Customization : Assign unique colors to each level (P, S1–S6, R1–R6, PC, BC, TC) with default settings like green for support, red for resistance, and purple for BC/TC.
Extend to Current Bar : Optionally extend pivot lines to the current bar for real-time tracking.
- Visual and Performance Optimization :
Uses an overlay to plot levels directly on the price chart.
Supports up to 500 lines and labels to prevent performance issues.
Efficiently manages historical pivot data by removing outdated graphics when the maximum pivot count is exceeded.
- Dynamic Updates :
Automatically updates pivot lines and labels when a new timeframe period begins (e.g., new day for daily pivots).
Ensures smooth rendering with real-time adjustments for extended lines and label positions.
Use Case:
The Level Master Pro+ is ideal for traders employing pivot point strategies to identify potential support and resistance zones, reversal points, or breakout levels. Its extensive customization options make it suitable for day trading, swing trading, or long-term analysis across various markets (stocks, forex, crypto, etc.).
How It Works:
Data Source : Uses request.security to fetch pivot data based on the selected timeframe.
Level Calculations: Computes traditional pivot points and derives additional levels (R6, S6, BC, TC) using high, low, and close prices from the previous period.
Rendering : Draws lines and labels for each enabled level, with options to extend lines to the current bar or anchor them to the timeframe’s end.
Memory Management : Stores pivot graphics in a matrix and removes older pivots to stay within the user-defined historical limit.
Settings Overview :
Pivot Timeframe : Set the timeframe for pivot calculations (e.g., daily, weekly).
Show Labels/Prices : Enable or disable level labels and price values.
Line Style : Customize line appearance and transparency.
Label Style : Adjust label size and background transparency.
Level Visibility : Toggle visibility for each level (P, S1–S6, R1–R6, PC, BC, TC) and customize their colors.
This indicator empowers traders with a robust tool to visualize critical price levels with precision and flexibility, enhancing technical analysis and decision-making.

Fibonacci Optimal Entry Zone [OTE] (Zeiierman)█ Overview
Fibonacci Optimal Entry Zone (Zeiierman) is a high-precision market structure tool designed to help traders identify ideal entry zones during trending markets. Built on the principles of Smart Money Concepts (SMC) and Fibonacci retracements, this indicator highlights key areas where price is most likely to react — specifically within the "Golden Zone" (between the 50% and 61.8% retracement).
It tracks structural pivot shifts (CHoCH) and dynamically adjusts Fibonacci levels based on real-time swing tracking. Whether you're trading breakouts, pullbacks, or optimal entries, this tool brings unparalleled clarity to structure-based strategies.
Ideal for traders who rely on confluence, this indicator visually synchronizes swing highs/lows, market structure shifts, Fibonacci retracement levels, and trend alignment — all without clutter or lag.
⚪ The Structural Assumption
Price moves in waves, but key retracements often lead to continuation or reversal — especially when aligned with structure breaks and trend shifts.
The Optimal Entry Zone captures this behavior by anchoring Fibonacci levels between recent swing extremes. The most powerful area — the Golden Zone — marks where institutional re-entry is likely, providing traders with a sniper-like roadmap to structure-based entries.
█ How It Works
⚪ Structure Tracking Engine
At its core, the indicator detects pivots and classifies trend direction:
Structure Period – Determines the depth of pivots used to detect swing highs/lows.
CHoCH – Break of structure logic identifies where the trend shifts or continues, marked visually on the chart.
Bullish & Bearish Modes – Independently toggle uptrend and downtrend detection and styling.
⚪ Fibonacci Engine
Upon each confirmed structural shift, Fibonacci retracement levels are projected between swing extremes:
Custom Levels – Choose which retracements (0.50, 0.618, etc.) are shown.
Real-Time Adjustments – When "Swing Tracker" is enabled, levels and labels update dynamically as price forms new swings.
Example:
If you disable the Swing Tracker, the Golden Level is calculated using the most recent confirmed swing high and low.
If you enable the Swing Tracker, the Golden Level is calculated from the latest swing high or low, making it more adaptive as the trend evolves in real time.
█ How to Use
⚪ Structure-Based Entry
Wait for CHoCH events and use the resulting Fibonacci projection to identify entry points. Enter trades as price taps into the Golden Zone, especially when confluence forms with swing structure or order blocks.
⚪ Real-Time Reaction Tracking
Enable Swing Tracker to keep the tool live — constantly updating zones as price shifts. This is especially useful for scalpers or intraday traders who rely on fresh swing zones.
█ Settings
Structure Period – Number of bars used to define swing pivots. Larger values = stronger structure.
Swing Tracker – Auto-updates fib levels as new highs/lows form.
Show Previous Levels – Keep older fib zones on chart or reset with each structure shift.
-----------------
Disclaimer
The content provided in my scripts, indicators, ideas, algorithms, and systems is for educational and informational purposes only. It does not constitute financial advice, investment recommendations, or a solicitation to buy or sell any financial instruments. I will not accept liability for any loss or damage, including without limitation any loss of profit, which may arise directly or indirectly from the use of or reliance on such information.
All investments involve risk, and the past performance of a security, industry, sector, market, financial product, trading strategy, backtest, or individual's trading does not guarantee future results or returns. Investors are fully responsible for any investment decisions they make. Such decisions should be based solely on an evaluation of their financial circumstances, investment objectives, risk tolerance, and liquidity needs.

Resistance Breakout LevelsResistance Breakout Levels
An advanced TradingView indicator that detects significant resistance pivots and marks confirmed breakouts.
Description:
This Pine Script automatically identifies swing-high pivot points as potential resistance levels. It confirms a breakout only after a configurable number of consecutive closes above the pivot, reducing noise and avoiding false signals. Once validated, it draws a horizontal breakout line at the pivot price and adds a label with the breakout value. Traders can choose to display all breakout lines or only the single highest breakout within a specified lookback period. Additionally, a dynamic current price line spans the chart for quick reference.
Features:
• Pivot High Detection for Resistance Levels
• N-Consecutive Close Breakout Confirmation
• Toggle Between All Breakouts or Highest Breakout with Lookback Window
• Full-Width Live Current Price Line
• Customizable Line Colors, Widths, and Extension Direction
• Price Labels Directly on Breakout Lines
User Inputs:
• Pivot Bars (Left/Right): Number of bars used to detect pivot highs
• Consecutive Closes Above: Closes required above pivot to confirm breakout
• Show All Breakouts: Option to plot every confirmed breakout line
• Highest Lookback Bars: Lookback window for retaining only the highest breakout
• Breakout Line Color & Width: Customize breakout line appearance
• Price Line Color & Width: Customize live current price line appearance

Double Tops & Bottoms [QuantVue]This indicator is designed to detect and plot Double Tops and Double Bottoms, by setting the initial high or low using standard pivot points.
Double Tops
A Double Top is a bearish reversal pattern, typically found when an uptrend returns back to a prior peak. It signifies a potential turning point or resistance level and could potentially reverse in direction.
The pattern is confirmed as a Double Top when the price breaks above the resistance level, but closes below it. A decisive close below this level is seen as a confirmation of the bearish trend.
Double Bottoms
A Double Bottom, on the other hand, is a bullish reversal pattern typically found after a downtrend. It signals a potential turning point or support level where the price has bottomed and could potentially reverse upwards.
The pattern is confirmed as a Double Bottom when the price breaks below the support level, but closes above it. A decisive close above this level is viewed as a confirmation of the bullish trend.
Indicator Features
🔹Double Top Detection: When a double top is identified, a downward-pointing triangle will be plotted above the bar, and if the alerts are enabled, a notification will be triggered.
🔹Double Bottom Detection: When a double bottom is identified, an upward-pointing triangle will be plotted below the bar, and if the alerts are enabled, a notification will be triggered.
🔹Pivot Lookback: Defines the number of bars to the left and right of the pivot that must be lower/higher to qualify as a pivot.
🔹Maximum Length Between Tops/Bottoms: Maximum number of bars between two tops/bottoms to be considered a double top or bottom.
🔹Style Settings: Allows the user to customize the appearance of the lines indicating the tops/bottoms. Options include color selection, line style (dotted, dashed, or solid), and line thickness.
🔹Alerts: The user can enable or disable alerts for Double Top and Double Bottom.
Give this indicator a BOOST and COMMENT your thoughts!
We hope you enjoy.
Cheers!

Pivots High/Low 3bar No Period w/ Signals -Tom1traderwww.tradingview.com
This price action indicator calculated on the relationship of 3 adjacent bars/candles adds an extra dimension to my indicator mix and with
a different perspective can help confirm or question an opinion formed by other indications (volume related, momentum, the chart itself and etc.).
Further, I have traded with it a bit now and like it. So much for comfort - I have seen no clear evidence that the movement of the next bar is paying any
attention to indicators, lines or patterns on charts. They are all based on the same historical data whether that data is run through an indicator algorithm
or used to draw (chart style) on a chart. But they make me feel better about my trades and I prefer them to a coin flip. :-)
Pivot High Definition - (Pivot Low is reversed): A three-bar pivot high represents resistance and is formed when sellers turn price from up to down. It is seen where a price bar with a lower high closes below the previous bar's low, where the previous bar's high is higher than the bar that preceded it.
Read more: Price Pivots Circle Big Profits www.investopedia.com
Follow us: Investopedia on Facebook
I see some n period high/low indicators named pivots. This indicator has no period and is based on the relationship of 3 bars usually referred to as Pivots High Low.
Also no relationship to daily calculated "Pivot Points". As such this is a PRICE ACTION indicator. It works the same on ALL TIME FRAMES.
These pivots sometimes do not occur very often and usually are not at tops or bottoms.
This is why I used a combination of most recent PHs and PLs along with
the price to derive the signal.

ZigZag + Fibonacci
⚙️ Main Features
• Automatic ZigZag: Detects the latest high and low pivots based on an adjustable period.
• Dynamic Fibonacci: Automatically draws the 38.2%, 50%, and 61.8% levels based on the last ZigZag movement.
• Display Control:
o Enable or disable the blue line connecting the pivots (ZigZag line).
o Adjust the horizontal length of the Fibonacci lines (in number of bars).
• Customizable Colors:
o Choose different colors for each Fibonacci level.
o Customize the color of the ZigZag line.
________________________________________
🧑🏫 How to Use
1. Add the indicator to your chart on TradingView.
2. Configure the parameters according to your strategy:
o ZigZag Period: defines the sensitivity of the pivots (higher values = wider movements).
o Fibonacci Line Length: how many bars the horizontal lines should extend.
o Show ZigZag Line: check or uncheck to display the blue line between pivots.
o Colors: customize the visual appearance of the Fibonacci levels and ZigZag line.
3. Interpret the Fibonacci levels:
o Use the levels as possible support and resistance zones.
o Combine with other technical signals for more assertive entries and exits.

Auto Trend Channels OXEThis indicator automatically detects and draws trend channels based on swing highs and lows.
How it works:
It identifies pivot points (swing highs/lows) using your chosen lookback period, then connects consecutive pivots to form channels:
Descending channels connect lower highs (resistance line), with a parallel support line projected from the lowest low between those highs
Ascending channels connect higher lows (support line), with a parallel resistance line projected from the highest high between those lows
Key features:
Channels extend forward so you can see where price might interact with them
Broken channels automatically switch to dashed lines and show "✗" labels
Fill shading helps visualize the channel zone
Info table shows current pivot counts
Trading application:
You'd use this for identifying trend direction and potential reversal zones. Price bouncing off channel boundaries = continuation. Price breaking through = potential trend change or acceleration. The "break detection" highlighting makes it easy to spot when a channel has been invalidated.
The pivot length setting is your main control - higher values find longer-term, more significant channels; lower values catch shorter-term moves.

Divergence Detector (MACD + Volume)Divergence Detector (MACD + Volume Confirmation)
This indicator automatically detects bullish and bearish divergences between price and MACD, enhanced with volume confirmation to filter out weak signals.
🔹 Core Logic
Pivot Detection:
The script identifies swing highs and lows (pivots) using customizable left/right lookback values.
Bullish Divergence:
Occurs when price makes a lower low, but MACD makes a higher low.
A label "Bull Div" appears below the bar; if confirmed by high volume, it shows "Bull Div 🔥".
Bearish Divergence:
Occurs when price makes a higher high, but MACD makes a lower high.
A label "Bear Div" appears above the bar; if confirmed by high volume, it shows "Bear Div 📉".
Volume Confirmation:
The indicator checks whether the volume at the pivot bar is above the moving average of volume (customizable length).
This ensures that divergence signals are backed by strong market participation.
Inputs
MACD Fast/Slow/Signal Length – standard MACD parameters
Pivot Lookback Left/Right – defines the swing structure sensitivity
Volume MA Length – defines how volume strength is validated
Output
Labels:
🔹 Bull Div / Bull Div 🔥 → Bullish divergence (confirmed with volume)
🔹 Bear Div / Bear Div 📉 → Bearish divergence (confirmed with volume)
Tips
Works best on higher timeframes and trending markets.
Volume confirmation helps filter false divergences in low liquidity conditions.
Combine with trend or structure indicators for better trade setups.
----------------------------------------------------------------------------------------------
اندیکاتور شناسایی واگرایی MACD با تأیید حجم
این اندیکاتور بهصورت خودکار واگراییهای صعودی و نزولی بین قیمت و MACD را شناسایی کرده و با استفاده از تأیید حجم (Volume Confirmation) سیگنالهای ضعیف را فیلتر میکند.
🔹 منطق عملکرد
شناسایی پیوتها:
نقاط چرخش (سقف و کف) با استفاده از تعداد کندلهای قابل تنظیم در دو سمت شناسایی میشوند.
واگرایی صعودی (Bullish):
زمانی که قیمت کف پایینتر و MACD کف بالاتر میسازد.
برچسب "Bull Div" در زیر کندل نمایش داده میشود؛ اگر حجم بالا باشد، با علامت 🔥 مشخص میگردد.
واگرایی نزولی (Bearish):
زمانی که قیمت سقف بالاتر و MACD سقف پایینتر میسازد.
برچسب "Bear Div" در بالای کندل نمایش داده میشود؛ اگر حجم بالا باشد، با 📉 مشخص میگردد.
تأیید حجم:
اگر حجم در کندل پیوت بالاتر از میانگین متحرک حجم باشد، سیگنال معتبرتر در نظر گرفته میشود.
تنظیمات ورودی
تنظیمات MACD (Fast, Slow, Signal)
پارامترهای شناسایی پیوت (Left / Right)
طول میانگین متحرک حجم (Volume MA Length)
خروجیها
Bull Div 🔥 / Bear Div 📉 برای واگراییهای تأییدشده با حجم
Bull Div / Bear Div برای واگراییهای بدون تأیید حجم
نکات کاربردی
بهترین عملکرد در تایمفریمهای بالا و بازارهای دارای روند
تأیید حجم به حذف سیگنالهای اشتباه در شرایط حجم پایین کمک میکند
برای دقت بیشتر، آن را با اندیکاتورهای روند یا ساختار ترکیب کنید
⚠️ Disclaimer:
This script is provided for educational and informational purposes only.
It does not constitute financial advice, and the author is not responsible for any financial losses caused by its use.
Always confirm signals with your own analysis and other tools before making trading decisions.
⚠️ توجه:
این اسکریپت صرفاً جهت آموزش و اطلاعرسانی طراحی شده و توصیه مالی یا سرمایهگذاری محسوب نمیشود.
نویسنده مسئول هیچگونه ضرر یا زیان احتمالی ناشی از استفاده از آن نیست.
لطفاً پیش از هر تصمیم معاملاتی، تحلیل شخصی خود را انجام داده و از این ابزار در کنار سایر ابزارهای تحلیل و مدیریت ریسک استفاده کنید.

Multi Length Market Structure (BoS + ChoCh)█ OVERVIEW
The "Multi Length Market Structure (BoS + ChoCh)" indicator is a technical analysis tool that identifies key pivot points on the chart and signals market structure breaks (Break of Structure - BoS) and changes in market character (Change of Character - ChoCh). It is designed for traders employing market structure-based strategies, enabling the identification of critical support and resistance levels and potential trend reversal points. The indicator offers flexible pivot length settings, customizable colors, and labels, ensuring clarity and precision on the chart.
█ CONCEPTS
The indicator was developed to simplify the identification of changes in market structure, catering to both short-term and longer-term trading strategies. To this end, it simultaneously displays breakouts for four editable pivot lengths. The lengths represent the delay, measured in the number of candles, after which a pivot is recognized. Pivots with larger values are often turning points on higher timeframes, providing a broader view of the market.
Why are BoS and ChoCh important? A Break of Structure (BoS) indicates trend continuation when the price breaks a key level (e.g., a previous high or low). A Change of Character (ChoCh) signals a potential trend reversal when the price breaks a level in the opposite direction of the prior trend. These signals help traders identify moments when the market changes its dynamics, which is crucial for price action strategies.
█ FEATURES
- Pivot Detection: Identifies pivot points (highs and lows) based on four different pivot lengths (default: 5, 10, 15, 20), enabling market structure analysis with varying sensitivity.
- BoS and ChoCh Signals: Generates Break of Structure (BoS) signals in the form of triangles (green for bullish, red for bearish) and Change of Character (ChoCh) signals when the price breaks a key level in the opposite direction of the prior trend.
- Pivot Labels: Displays labels for highs (HH - Higher High, LH - Lower High) and lows (HL - Higher Low, LL - Lower Low) with the option to select which pivot to display them for.
- Customizable Colors and Styles: Allows configuration of colors for BoS and ChoCh signals and pivot labels.
- Alerts: Built-in alerts for BoS and ChoCh signals for each pivot length, including price and signal type descriptions.
█ HOW TO USE
Adding to the Chart: Add the indicator to your TradingView chart via the Pine Editor or Indicators menu.
Configuring Settings:
- Pivot Lengths: Set four different pivot lengths (Pivot Length 1-4, default: 5, 10, 15, 20) to adjust the sensitivity of pivot detection. Shorter lengths are more sensitive, while longer lengths are more significant. If you want to use only one length, set all pivot lengths to the same value.
- Colors and Styles: Configure colors for BoS signals (green for bullish, red for bearish) and pivot labels.
- Labels: Enable/disable the display of HH/HL/LH/LL labels and choose which pivot to display them for (Pivot 1-4 or none).
- Signals: BoS and ChoCh signals are displayed as triangles (upward for bullish BoS, downward for bearish). Alerts can be configured for each signal type.
Interpreting Signals:
- Bullish BoS Signal: A green triangle below the candle indicates a breakout above a previous high, suggesting bullish trend continuation.
- Bearish BoS Signal: A red triangle above the candle indicates a breakout below a previous low, suggesting bearish trend continuation.
- Bullish ChoCh Signal: A green triangle after breaking a high in a downtrend indicates a potential reversal to bullish.
- Bearish ChoCh Signal: A red triangle after breaking a low in an uptrend indicates a potential reversal to bearish.
- Pivot Levels: Use pivot points as dynamic support and resistance levels. Levels from longer pivots carry greater significance.
Combine signals with other technical analysis tools, such as RSI (to identify overbought/oversold conditions) or MACD (to confirm momentum). Analyze market structure on higher timeframes for stronger signals. Be particularly cautious when entering positions if RSI approaches overbought/oversold zones and divergences appear, as this may indicate a trend change.
█ APPLICATIONS
- Breakout Strategies: Trade based on BoS signals indicating trend continuation. A BoS signal after breaking a high in an uptrend may suggest a strong bullish impulse, especially when supported by a rising MACD.
- Reversal Strategies: ChoCh signals may indicate a potential trend reversal, particularly when confirmed by other indicators, such as RSI divergences or Fibonacci levels.
