Sweep Reversal 5M PRO – by [TuNombre]🔹 **Sweep Reversal 5M PRO – by ** 🔹
This indicator is built to detect high-probability *Institutional Sweeps* using Swing Failure Patterns (SFP), fully filtered with Smart Money Concepts (SMC) logic and volume confirmation.
✅ Identifies key liquidity grabs
✅ Confirms with strong impulse candle + increasing volume
✅ Filters out false signals (doji, weak zones, low volume)
✅ Optimized for the 5-minute timeframe (5M)
✅ Compatible with push alerts to your mobile
---
**How to use it:**
1. Wait for a “BUY” or “SELL” signal on the chart
2. Only enter if the next candle confirms with momentum
3. Place a tight stop just beyond the sweep
4. Recommended Take Profit: 1:1 minimum / 2:1 ideal
---
💡 Inspired by institutional trading (SMC, ICT-style setups)
🔒 Developed by – private or team-based use
📲 Activate alerts to get real-time trade opportunities on your phone
---
⚠️ This script does not repaint.
Built for serious traders who want precision, not noise.
在脚本中搜索"pro"

Daily Levels & Stats Pro - [Aspect] v4.0# Description of the "Daily Levels & Stats Pro - v4.0" Indicator
This indicator is a powerful tool for market analysis through the lens of key daily levels and statistical price movement indicators. It allows you to display important trading session opening levels, daily statistical movements, and high volatility zones on the price chart.
## Main Indicator Functions:
### Key Time Levels:
- **Daily Open (DO)** - daily trading session opening level at 02:00
- **NY Midnight (NYM)** - New York session opening level at 06:00
- **Trade Open (TO)** - active trading opening level at 10:00
### Analysis Zones:
- **Previous Close Zone (PCZ)** - previous day's closing zone (displayed on M5 timeframe)
- **Open Day Zone (ODZ)** - current day's opening zone (displayed on M5 timeframe)
### Statistical Price Movement Levels:
- **Min** - minimum statistical movement from DO
- **Max** - maximum statistical movement from DO
- **Aver** - average statistical movement from DO
- **Dev-** - lower deviation of movement from DO
- **Dev+** - upper deviation of movement from DO
### TO Impulse Movement Statistical Levels:
- **Aver TO** - average statistical movement from TO
- **Dev+ TO** - upper deviation of movement from TO
- **Max TO** - maximum statistical movement from TO
## Indicator Features:
- Complete customization of colors, styles, and line widths for all levels
- Ability to select time for each main level
- Adjustment of the number of bars for level display
- Automatic calculation of level values relative to DO and TO
- Visual display of TO-levels starts 3 bars before the actual TO point, providing better visual perception
- Ability to enable/disable individual levels and zones
- Automatic updates and resets when the day changes
- Adaptive text labels to mark levels
This indicator is excellent for traders who use statistical data and daily support/resistance levels in their trading strategy. It is particularly useful for DAX40 and other highly liquid instruments where daily trading statistics are important for making trading decisions.

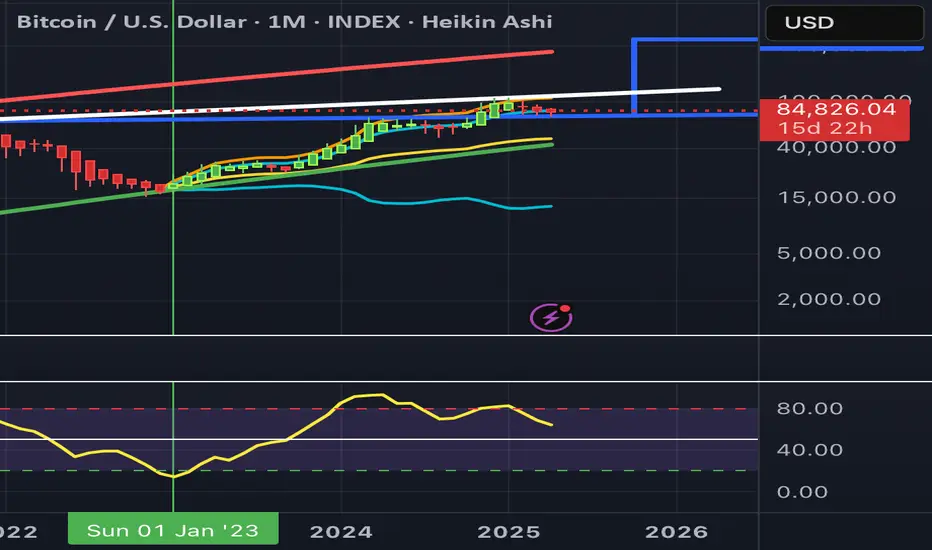
Anchored VWAP Pro (Final Visibility Enhanced)This is a fully customizable Anchored VWAP (Volume Weighted Average Price) indicator designed for traders who prioritize precision, clarity, and macro trend analysis.
Unlike traditional VWAPs tied to daily or session data, this version allows you to manually anchor the VWAP to any candle in history—ideal for macro swing trading, cycle lows, breakouts, and reaccumulation phases.
Features:
• Manual Anchor Date: Set the exact year, month, and day for your VWAP to begin
• Custom Price Source: Choose between HLC3, close, or any OHLC-based input
• VWAP Bands: Two standard deviation bands for identifying overextension or fair value zones
• Full Visual Control:
• Toggle each band on/off individually
• Adjust color, line width, and line style (solid, dotted, dashed)
• Built for Clarity: Designed to stand out on both light and dark charts
This script is ideal for:
• Identifying macro confluence zones
• Defining risk during trend pullbacks
• Confirming breakout legitimacy
• Layering with other tools like Market Cipher, VRVP, and Fib levels
Inspired by the work of LonesomeTheBlue, Algokid, and other pros—this is a cleaner, more flexible and updated alternative for precision trading.
Script created and published by @ImmortalEmerson
For advanced swing traders, crypto analysts, and macro trend specialists.
Rogue ORB PRORogue ORB Pro is a precision-engineered Opening Range Breakout (ORB) indicator built for active intraday traders who need real signals, not noise.
This tool identifies high-probability breakout entries from the opening range, enhanced with optional ATR-based stop loss levels, deviation targets, cooldown filters, and a relative volume gate to filter weak setups.
🔍 Key Features:
Opening Range High/Low: Drawn from a user-defined time window and locked for the day
Deviations: Automatically plots target zones above and below the OR range (e.g. 1, 2 deviations)
Pre-Market Levels: Automatically draws pre market high and low lines at the end of pre market session
Buy/Sell Signals: Triggered on breakout of the OR High/Low with configurable breakout logic (touch or close)
ATR Stop Loss Line: Dynamically drawn at a fixed ATR distance from breakout candle, with optional SL label
Cooldown Period: Prevents back-to-back signals by enforcing a user-defined bar delay between entries, can help with overtrading
Volume Filter: Optional relative volume filter that requires breakout candles to exceed a custom volume threshold
VWAP Overlay: Visual VWAP for directional bias and confluence

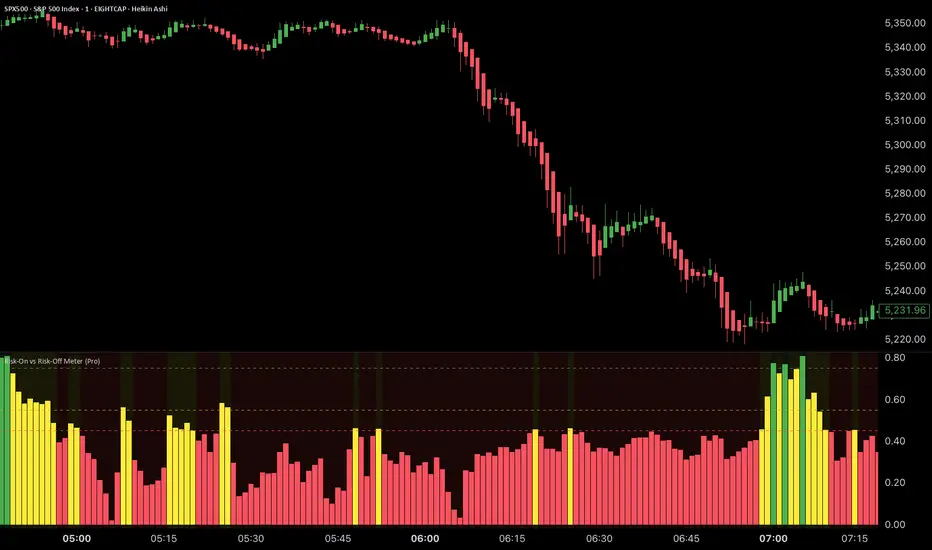
Risk-On vs Risk-Off Meter (Pro)Risk-On vs Risk-Off Meter (Pro)
This macro-based tool analyzes capital flows across key assets to gauge overall market risk sentiment. It does not use ES, SPY, or stock data directly—making it a powerful confirmation tool for ES traders looking to align with macro forces.
🔹 Core Idea:
Tracks capital rotation between copper/gold, bonds, dollar, crude oil, VIX, and yield spreads to generate a normalized risk score (0–1). This score reflects whether macro money is flowing into risk or safety.
🔹 Use:
Use this indicator as confirmation of directional bias when scalping or day trading ES.
– Green Zone (>0.75): Risk-On environment. Favor long setups.
– Red Zone (<0.45): Risk-Off. Favor short setups or stand aside.
– Yellow Zone: Neutral, use caution.
– Divergence Alerts: Signals when ES price disagrees with macro risk trend—potential reversals or exhaustion zones.
HOT TO USE
– Combine with your existing price action or order flow signals
– Avoid trading against the macro sentiment unless strong setup
– Use divergence as a heads-up for fading or exiting trades
This gives you a macro-informed lens to validate or filter your entries.
Volume Pro Indicator## Volume Pro Indicator
A powerful volume indicator that visualizes volume distribution across different price levels. This tool helps you easily identify where trading activity concentrates within the price range.
### Key Features:
- **Volume visualization by price levels**: Green (lower zone), Magenta (middle zone), Cyan (upper zone)
- **VPOC (Volume Point of Control)**: Shows the price level with the highest volume concentration
- **High and Low lines**: Highlights the extreme levels of the analyzed price range
- **Customizable historical analysis**: Configurable number of days for calculation
### How to use it:
- Colored volumes show where trading activity concentrates within the price range
- The VPOC helps identify the most significant price levels
- Different colors allow you to quickly visualize volume distribution in different price areas
Customizable with numerous options, including analysis period, calculation resolution, colors, and visibility of different components.
### Note:
This indicator works best on higher timeframes (1H, 4H, 1D) and liquid markets. It's a visual analysis tool that enhances your understanding of market structure.
#volume #vpoc #distribution #volumeprofile #trading #analysis #indicator #professional #pricelevels #volumedistribution

Sniper Trade Pro (ES 15-Min) - Topstep Optimized🔹 Overview
Sniper Trade Pro is an advanced algorithmic trading strategy designed specifically for E-mini S&P 500 (ES) Futures on the 15-minute timeframe. This strategy is optimized for Topstep 50K evaluations, incorporating strict risk management to comply with their max $1,000 daily loss limit while maintaining a high probability of success.
It uses a multi-confirmation approach, integrating:
✅ Money Flow Divergence (MFD) → To track liquidity imbalances and institutional accumulation/distribution.
✅ Trend Confirmation (EMA + VWAP) → To identify strong trend direction and avoid choppy markets.
✅ ADX Strength Filter → To ensure entries only occur in trending conditions, avoiding weak setups.
✅ Break-Even & Dynamic Stop-Losses → To reduce drawdowns and protect profits dynamically.
This script automatically generates Buy and Sell signals and provides built-in risk management for automated trading execution through TradingView Webhooks.
🔹 How Does This Strategy Work?
📌 1. Trend Confirmation (EMA + VWAP)
The strategy uses:
✔ 9-EMA & 21-EMA: Fast-moving averages to detect short-term momentum.
✔ VWAP (Volume-Weighted Average Price): Ensures trades align with institutional volume flow.
How it works:
Bullish Condition: 9-EMA above 21-EMA AND price above VWAP → Confirms buy trend.
Bearish Condition: 9-EMA below 21-EMA AND price below VWAP → Confirms sell trend.
📌 2. Liquidity & Money Flow Divergence (MFD)
This indicator measures liquidity shifts by tracking momentum changes in price and volume.
✔ MFD Calculation:
Uses Exponential Moving Average (EMA) of Momentum (MOM) to detect changes in buying/selling pressure.
If MFD is above its moving average, it signals liquidity inflows → bullish strength.
If MFD is below its moving average, it signals liquidity outflows → bearish weakness.
Why is this important?
Detects when Smart Money is accumulating or distributing before major moves.
Filters out false breakouts by confirming momentum strength before entry.
📌 3. Trade Entry Triggers (Candlestick Patterns & ADX Filter)
To avoid random entries, the strategy waits for specific candlestick confirmations with ADX trend strength:
✔ Bullish Entry (Buy Signal) → Requires:
Bullish Engulfing Candle (Reversal confirmation)
ADX > 20 (Ensures strong trending conditions)
MFD above its moving average (Liquidity inflows)
9-EMA > 21-EMA & price above VWAP (Trend confirmation)
✔ Bearish Entry (Sell Signal) → Requires:
Bearish Engulfing Candle (Reversal confirmation)
ADX > 20 (Ensures strong trending conditions)
MFD below its moving average (Liquidity outflows)
9-EMA < 21-EMA & price below VWAP (Trend confirmation)
📌 4. Risk Management & Profit Protection
This strategy is built with strict risk management to maintain low drawdowns and maximize profits:
✔ Dynamic Position Sizing → Automatically adjusts trade size to risk a fixed $400 per trade.
✔ Adaptive Stop-Losses → Uses ATR-based stop-loss (0.8x ATR) to adapt to market volatility.
✔ Take-Profit Targets → Fixed at 2x ATR for a Risk:Reward ratio of 2:1.
✔ Break-Even Protection → Moves stop-loss to entry once price moves 1x ATR in profit, locking in gains.
✔ Max Daily Loss Limit (-$1,000) → Stops trading if total losses exceed $1,000, complying with Topstep rules.

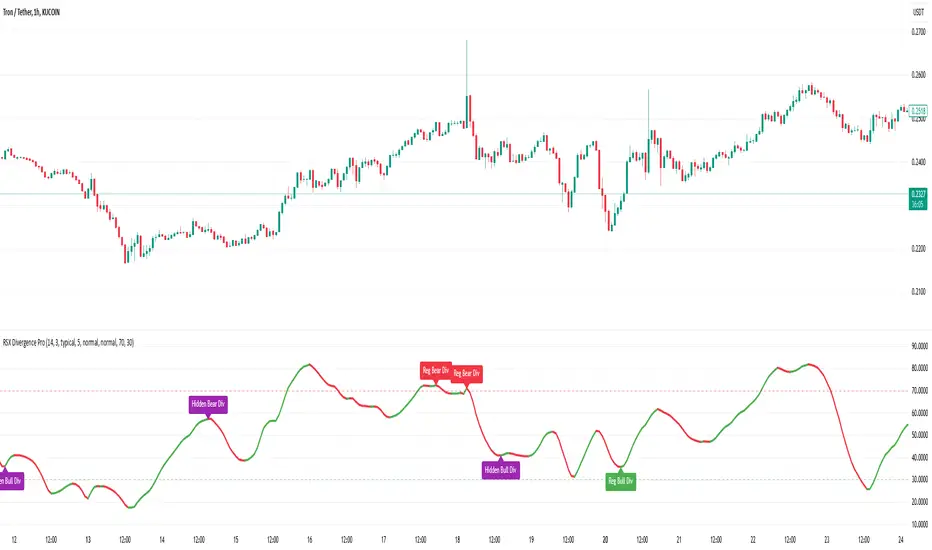
RSX Divergence ProRSX Divergence Pro detects regular and hidden divergences using a smoothed Relative Strength Xtra (RSX) oscillator. It helps traders identify trend reversals and trend continuation signals with clear visual labels. Users can enable/disable divergences, adjust RSX length, customize label colors/sizes, and choose different price types. The indicator also includes dynamic RSX coloration and adjustable overbought/oversold levels for better market insights. Perfect for traders seeking precision in divergence detection and smoother signals than traditional RSI. 🚀
MultiTime Stochastics ProMultiTime Stochastics Pro
This indicator is an enhanced version of the stochastic indicator, featuring two separate stochastics. This functionality allows you to adjust the settings and time frame for each stochastic individually, enabling a more precise analysis of market fluctuations.
The Double Stochastic indicator enables you to simultaneously analyze the market in different time frames with two separate stochastics. One of the standout features of this indicator is that when the chart's time frame changes, each stochastic is displayed according to the time set for it and does not change in other time frames. This feature provides greater flexibility and accuracy in market analysis.
How the Indicator Works
This indicator calculates two separate stochastics:
The first stochastic (K1 and D1) with its own specific time frame and settings.
The second stochastic (K2 and D2) with a different time frame and settings.
These two stochastics are displayed simultaneously on one chart, and overbought and oversold lines are also included.
How to Use
Parameter Adjustment : Adjust the parameters K1 Length, D1 Smoothing, and K1 Time Frame as desired. Do the same for the second stochastic.
Signal Analysis : Analyze buy and sell signals based on the stochastic values and the overbought and oversold lines.
Advantages
Greater Precision : With two separate stochastics, you can follow market fluctuations with greater accuracy.
Flexibility : The ability to individually set the time frame and parameters for each stochastic makes this indicator highly flexible.
Stronger Signals : The simultaneous display of two stochastics allows you to receive stronger buy and sell signals.
Multi-time frame Analysis : The ability to analyze the market in different time frames simultaneously.
This indicator is suitable for traders seeking more precise and flexible market analysis tools. I hope these explanations help you publish your indicator in the best possible way!

Binary Options Pro Helper By Himanshu AgnihotryThe Binary Options Pro Helper is a custom indicator designed specifically for one-minute binary options trading. This tool combines technical analysis methods like moving averages, RSI, Bollinger Bands, and pattern recognition to provide precise Buy and Sell signals. It also includes a time-based filter to ensure trades are executed only during optimal market conditions.
Features:
Moving Averages (EMA):
Uses short-term (7-period) and long-term (21-period) EMA crossovers for trend detection.
RSI-Based Signals:
Identifies overbought/oversold conditions for entry points.
Bollinger Bands:
Highlights market volatility and potential reversal zones.
Chart Pattern Recognition:
Detects double tops (sell signals) and double bottoms (buy signals).
Time-Based Filter:
Trades only within specified hours (e.g., 9:30 AM to 11:30 AM) to avoid unnecessary noise.
Visual Signals:
Plots buy and sell markers directly on the chart for ease of use.
How to Use:
Setup:
Add this script to your TradingView chart and select a 1-minute timeframe.
Signal Interpretation:
Buy Signal: Triggered when EMA crossover occurs, RSI is oversold (<30), and a double bottom pattern is detected.
Sell Signal: Triggered when EMA crossover occurs, RSI is overbought (>70), and a double top pattern is detected.
Timing:
Ensure trades are executed only during the specified time window for better accuracy.
Best Practices:
Use this indicator alongside fundamental analysis or market sentiment.
Test it thoroughly with historical data (backtesting) and in a demo account before live trading.
Adjust parameters (e.g., EMA periods, RSI thresholds) based on your trading style.

MTF RSI+CMO PROThis RSI+CMO script combines the Relative Strength Index (RSI) and Chande Momentum Oscillator (CMO), providing a powerful tool to help traders analyze price momentum and spot potential turning points in the market. Unlike using RSI alone, the CMO (especially with a 14-period length) moves faster and accentuates price pops and dips in the histogram, making price shifts more apparent.
Indicator Features:
➡️RSI and CMO Combined: This indicator allows traders to track both RSI and CMO values simultaneously, highlighting differences in their movement. RSI and CMO values are both plotted on the histogram, while CMO values are also drawn as a line moving through the histogram, giving a visual representation of their relationship. The often faster-moving CMO accentuates short-term price movements, helping traders spot subtle shifts in momentum that the RSI might smooth out.
➡️Multi-Time Frame Table: A real-time, multi-time frame table displays RSI and CMO values across various timeframes. This gives traders an overview of momentum across different intervals, making it easier to spot trends and divergences across short and long-term time frames.
➡️Momentum Chart Label: A chart label compares the current RSI and CMO values with values from 1 and 2 bars back, providing an additional metric to gauge momentum. This feature allows traders to easily see if momentum is increasing or decreasing in real-time.
➡️RSI/CMO Bullish and Bearish Signals: Colored arrow plot shapes (above the histogram) indicate when RSI and CMO values are signaling bullish or bearish conditions. For example, green arrows appear when RSI is above 65, while purple arrows show when RSI is below 30 and CMO is below -40, indicating strong bearish momentum.
➡️Divergences in Histogram: The histogram can make it easier for traders to spot divergences between price and momentum. For instance, if the price is making new highs but the RSI or CMO is not, a bearish divergence may be forming. Similarly, bullish divergences can be spotted when prices are making lower lows while RSI or CMO is rising.
➡️Alert System: Alerts are built into the indicator and will trigger when specific conditions are met, allowing traders to stay informed of potential entry or exit points based on RSI and CMO levels without constantly monitoring the chart. These are set manually. Look for the 3 dots in the indicator name.
How Traders Can Use the Indicator:
💥Identifying Momentum Shifts: The RSI+CMO combination is ideal for spotting momentum shifts in the market. Traders can monitor the histogram and the CMO line to determine if the market is gaining or losing strength.
💥Confirming Trade Entries/Exits: Use the real-time RSI and CMO values across multiple time frames to confirm trades. For instance, if the 1-hour RSI is above 70 but the 1-minute RSI is turning down, it could indicate short-term overbought conditions, signaling a potential exit or reversal.
💥Spotting Divergences: Divergences are critical for predicting potential reversals. The histogram can be used to spot divergences when RSI and CMO values deviate from price action, offering an early signal of market exhaustion.
💥Tracking Multi-Time Frame Trends: The multi-time frame table provides insight into the market’s overall trend across several timeframes, helping traders ensure their decisions align with both short and long-term trends.
RSI vs. CMO: Why Use Both?
While both RSI and CMO measure momentum, the CMO often moves faster with a value of 14 for example, reacting to price changes more quickly. This makes it particularly effective for detecting sharp price movements, while RSI helps smooth out price action. By using both, traders get a clearer picture of the market's momentum, particularly during volatile periods.
Confluence and Price Fluidity:
One of the powerful ways to enhance the effectiveness of this indicator is by using it in conjunction with other technical analysis tools to create confluence. Confluence occurs when multiple indicators or price action signals align, providing stronger confirmation for a trade decision. For example:
🎯Support and Resistance Levels: Traders can use RSI+CMO in combination with key support and resistance zones. If the price is nearing a support level and RSI+CMO values start to signal a bullish reversal, this alignment strengthens the case for entering a long position.
🎯Moving Averages: When the RSI+CMO signals a potential trend reversal and this is confirmed by a crossover in moving averages (such as a 50-day and 200-day moving average), traders gain additional confidence in the trade direction.
🎯Momentum Indicators: Traders can also look for momentum indicators like the MACD to confirm the strength of a trend or potential reversal. For instance, if the RSI+CMO values start to decrease rapidly while both the RSI+CMO also shows overbought conditions, this could provide stronger confirmation to exit a long trade or enter a short position.
🎯Candlestick Patterns: Price fluidity can be monitored using candlestick formations. For example, a bearish engulfing pattern with decreasing RSI+CMo values offers confluence, adding confidence to the signal to close or short the trade.
By combining the MTF RSI+CMO PRO with other tools, traders ensure that they are not relying on a single indicator. This layered approach can reduce the likelihood of false signals and improve overall trading accuracy.

F.B_Vortex Indicator ProThe "F.B_Vortex Indicator Pro" is a technical analysis tool designed to identify trends in financial markets. It calculates two Vortex Indicators (VI) based on price movements, considering positive and negative price changes.
The smoothed VI+ line represents the smoothed negative trend, while the smoothed VI+ line represents the smoothed positive trend.
The crossing of the smoothed VI+ line above the smoothed VI+ line could indicate a potential bullish trend.
Conversely, the crossing of the smoothed VI+ line above the smoothed VI+ line suggests a possible bearish trend.
The "Smoothed VI-" line is also displayed.
When the Smoothed VI- line is above both the smoothed VI+ line and the smoothed VI+ line, it may signal a transition to a bearish main trend or indicate an expected one.
When the Smoothed VI- line is below both the smoothed VI+ line and the smoothed VI+ line, it may indicate a transition to a bullish main trend or suggest an expected one.
Adjustments can be made using input parameters such as length and smoothing periods to tailor the indicator to specific market conditions.

Support & Resistance PROHi Traders!
The Support & Resistance PRO
A simple and effective indicator that helped me a bunch!
This indicator will chart simple support and resistance zones on 2 time frames of your choice.
It uses a 30 day lookback period and will find the last high and low.
Each zone is built from the highest/lowest closure, and the highest/lowest wick, creating a liquid zone between the 2.
It is perfect for people trading support and resistance, watching key areas, scalping zones and much more!
*You can change the time frames you are looking at and the lookback period.
*The example in the picture is looking at the Daily and Weekly zones on BTC.

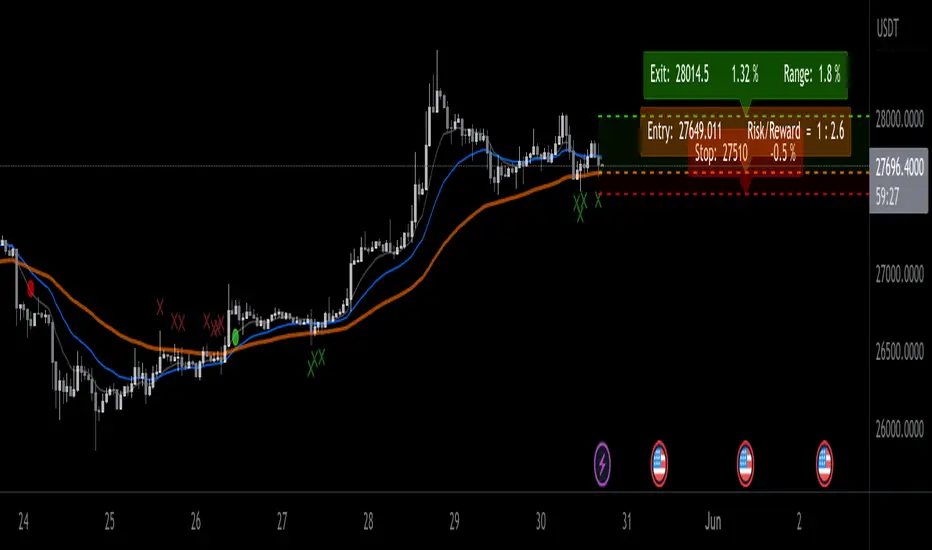
EMA ProHi Traders!
This Improved EMA Cross Pro Indicator does a few things that Ease Up Our Charting.
Personally it Saved me Tons of Time searching for structure highs / lows, measuring ranges and distances from my entry to stop or take profit.
It's like having most of your trade in front of you, charted for you.
Works Across Assets & Time Frames.
The Functions
1. Signals EMA Crosses - green for Bull Cross & Red for Bear Cross
2. Signals Touches to the 55 EMA
a. In a Bull Cross it will only signal touches and closes Above the 55
b. In a Bear Cross it will only signal touches and closes Under the 55
3. Plots Current Horizontals:
a. The current position of the 55
b. The last High & Low
4. Calculation:
a. % from the 55 to the High & Low
b. Risk / Reward Ratio ("Bad Risk Management" message appears if ratio is not favorable)
c. Over Range between the Low and the High
5. Labels - Current prices for all horizontals marked as Entry, Exit & Stop
Notes:
* This Indicator is Interchanging between bull and bear crosses, it recognizes the trend and adapts its high and low output.
* You Can and Should make your personal changes. everything can be changed in the settings inputs.
* You can Turn On & Off most functions in the settings inputs.
BYBIT:BTCUSDT.P
Litt Internals ProThe Litt Internal Pro is based on the four major U.S. Equity Indexes. This is to not be used for any other markets. If you need more information on any of the indexes, you can google or watch YouTube videos on what they are. Typically if we are looking for to be long we want to see all four of the indexes green and have buy ratings. If we are looking to be short we want to see all four of the indexes red and have sell ratings. If you see Overbought or Oversold ratings it may be best to wait for a pullback to get long or not take the trade at all.
For the stocks that you trade, you should know what index they are in. The reason for this is that you can still take trades if not all four indexes are aligned the same color. For example, maybe small caps (IWM) are on a hot streak and seeing buying momentum from institutions meanwhile tech (QQQ), is being sold. If you held a long in a company that is in IWM then you could be more comfortable holding your long position. Meanwhile, if you held a long position in a stock that is in QQQ then you might want to cut your loss or take profit. There are multiple different use cases for this indicator so it is best to look for outside resources on more information on the indexes and what stocks are in each index. This can be a very powerful tool to see sector rotation by hedge funds and institutions.

Scalp ProScalp Pro is a scalping tool that uses the MACD mechanism. MACD lines are smoothed using fibonacci numbers and pi numbers. In this way, the noise on the signal is reduced. A " BUY " signal is generated when the lines cross upwards. If the lines cross down, a " SELL " signal is generated. The logic is very simple and the Indicator is very useful.
I wish you many profitable trades.

Boom Hunter ProBoom Hunter Pro is the ultimate indicator for targeting perfect long entries and epic shorts. Boom Hunter comes with a super fast oscillator that uses Ehlers Early Onset Trend (EOT). This is the Center Of Gravity Oscillator (COG) with a super smoothing filter and a roofing filter. This indicator is tuned for 1 hour charts but can be used on any time frame.
Colored bars can be turned on to assist in finding an entry. Purple signifies a drag and potential dump.
Fibonacci lines can be turned on to track price action and find entries/exit.
This indicator follows the same rules as COG. For more information please see my COG HOWTO here:

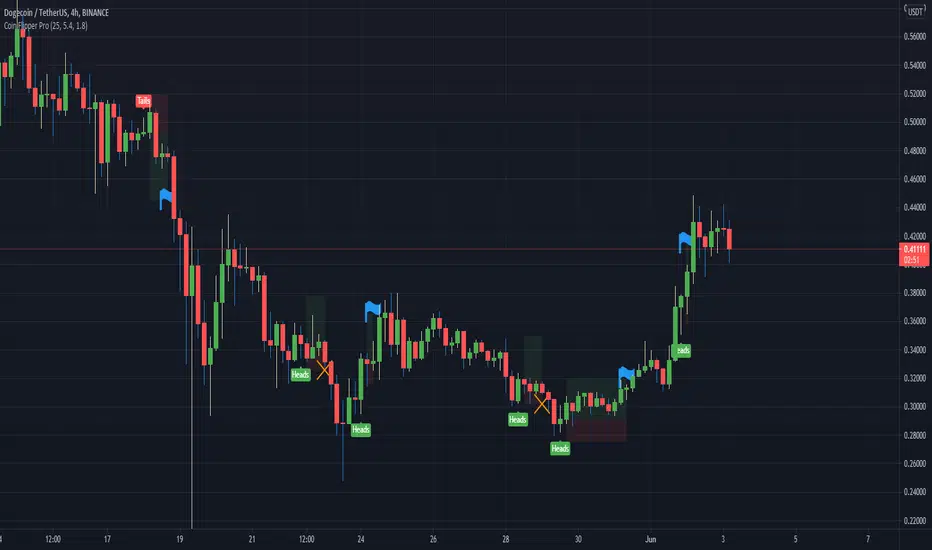
Coin Flipper Pro with strategy testerConverted the script "Coin Flipper Pro" into a Strategy. The same random "Coin Flip" trading fun with new features. Now users can run back test on the random trades and see how adjusting the risk to reward ratio affects the over all win rate and the profit of each trade. The Back test can be enabled or disabled in the settings along with the option to choose specific dates to run the test. Enjoy!

Coin Flipper ProHave you ever wondered how your win rate compares with flipping a coin? Well now you can check with Coin Flipper Pro!
This script produces a random position direction like flipping a coin and sets up a long or short trade based on you desired risk % and target ratio.
Have fun!
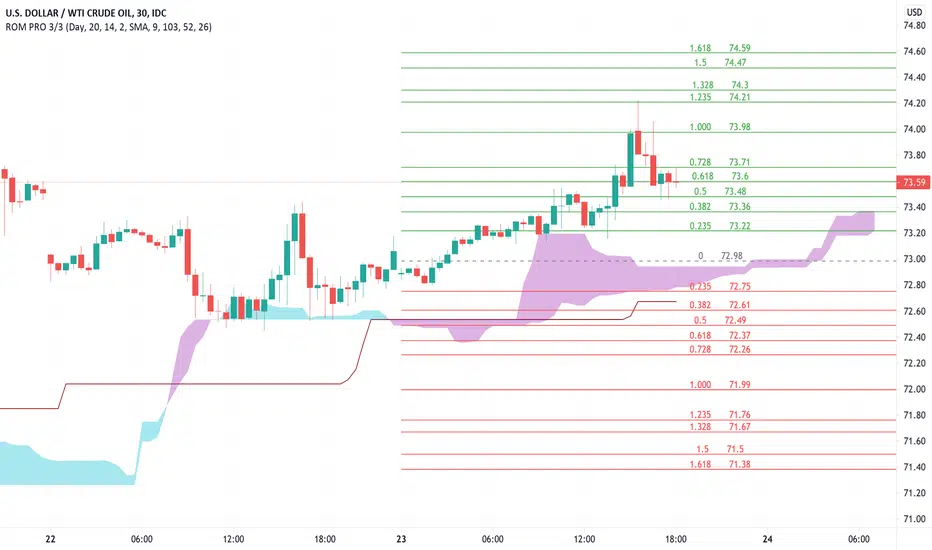
Rain On Me PRO 3/3This is the part 3 of Rain On Me PRO. It follow my two other indicators "Rain On Me" and "Rain On Me V2". This version is called "PRO" because it is less "user-friendly" than the two previous versions. But it is more faster, and cleaner than ever!
This indicator is separated into 3 parts. You can find all parts into my profile in the « Scripts » section. Once the 3 parts together, the indicator is complete.
Here are the features for this part:
-MTF Fibonacci on 10 levels with level 0 in the middle and an "info panel" to indicate you the key levels. You can set an alert for each level cross.
-MTF High/Low (Red dots is last low and green dots is last high).
-Bollinger.
-Ichimoku Cloud with baseline (red) and alerts (SenkouA and SenkouB Cross or Tenkan and Kijun Cross).
Everything is fully customizable in settings.
To place an alert, always choose the "Once per bar" option.
Many functions are still to come. So don't hesitate to report bugs, suggestions and follow me to always be kept informed of the next updates to come!
//ALWAYS DELETE INDICATOR AND ALERTS AND RESET THEM AFTER AN UPDATE!
Thank again everyone for your support!
A BIG THANKS TO QUANTNOMAD FOR GIVING ME ITS AUTHORIZATION TO USE, MODIFY AND REPUBLIC ITS "Ultimate Pivot Points Alerts" script indicator:
Good trade everyone! And remember, money management is the most important!
Rain On Me PRO 2/3This is the part 2 of Rain On Me PRO. It follow my two other indicators "Rain On Me" and "Rain On Me V2". This version is called "PRO" because it is less "user-friendly" than the two previous versions. But it is more faster, and cleaner than ever!
This indicator is separated into 3 parts. You can find all parts into my profile in the « Scripts » section. Once the 3 parts together, the indicator is complete.
Here are the features for this part:
-Support/Resistance and Range lines (Red is Resistance, Yellow is Range, Green is Support).
-MTF Trend Line following the trend with red color for bearish trend and green color for bullish trend (Based on volume so it work only where the volume information flux is available).
-MTF Fractals with alerts. (Zigzag based on high and low).
Everything is fully customizable in settings.
To place an alert, always choose the "Once per bar" option.
Many functions are still to come. So don't hesitate to report bugs, suggestions and follow me to always be kept informed of the next updates to come!
//ALWAYS DELETE INDICATOR AND ALERTS AND RESET THEM AFTER AN UPDATE!
Thank again for your support!
Good trade everyone! And remember, money management is the most important!

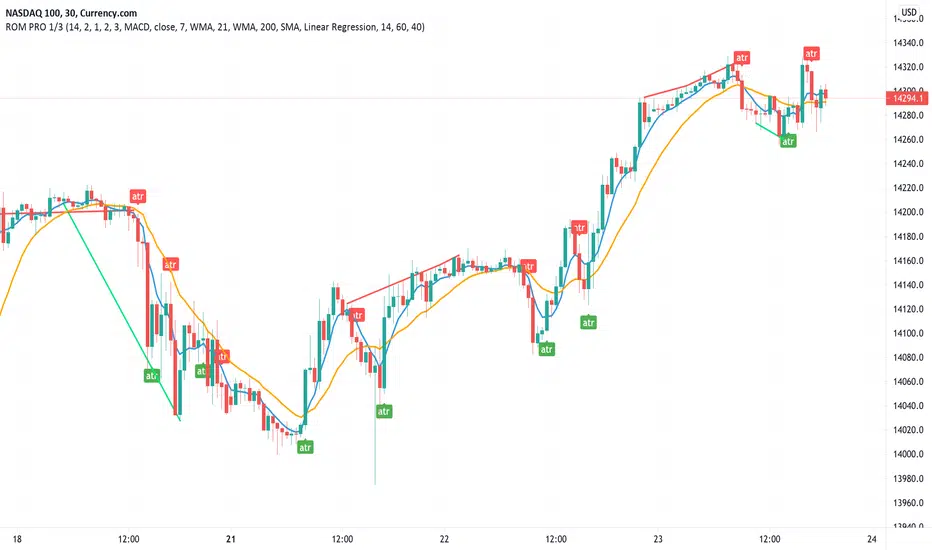
Rain On Me PRO 1/3This is the part 1 of Rain On Me PRO. It follow my two other indicators "Rain On Me" and "Rain On Me V2". This version is called "PRO" because it is less "user-friendly" than the two previous versions. But it is more faster, and cleaner than ever!
This indicator is separated into 3 parts. You can find all parts into my profile in the « Scripts » section. Once the 3 parts together, the indicator is complete..
Here are the features for this part (no-repaint on this one):
-ATR with alerts (Buy and Sell signals).
-VPT with alerts (Buy and Sell signals).
-PSAR with alerts (Buy and Sell signals).
-SuperTrend with alerts (Buy and Sell signals).
-Doji with alert (A yellow arrow show you when a good Doji signal appear).
-Divergences on chart (Red is bearish or green is bullish) with multiple type of divergence (MACD, OBV, RSI or CCI) with alerts.
-Market Range Bar Filter Color. (You have to configure the TimeZone of the market in UTC and then it will show you blank bar where the volatility is low).
-3 Moving Averages with cross alert for MA1 and MA2.
Everything is fully customizable in settings.
To place an alert, always choose the "Once per bar" option.
Many functions are still to come. So don't hesitate to report bugs, suggestions and follow me to always be kept informed of the next updates to come!
//ALWAYS DELETE INDICATOR AND ALERTS AND RESET THEM AFTER AN UPDATE!
Thank again everyone for your support!
Good trade everyone! And remember, money management is the most important!
(NKC) MTF Squeeze Pro MultiTimeframe Squeeze Momentum Pro
Dots indicate squeeze
Fills indicate momentum
