Joel on Crypto - MACD ScalpingJoel on Crypto - MACD Scalping
This is a Scalping indicator primarily intended for the 5 minute time frame.
It is based on the Crypto Scalping YouTuber Joel on Crypto's popular 5 minute scalping strategy and this is the indicator he personally use when Scalping.
This is a Multi-timeframe indicator where if you use it on the 5 minute time frame, the MACD Histogram bars will be based on the 1 minute timeframe.
The purpose of this indicator is not to trade it like a bot. The purpose is to grab the traders attention a time where there COULD be a scalping opportunity.
Use this indicator at your own risk.
在脚本中搜索"scalp"

Scalping trading system based on 4 ema linesScalping Trading System Based on 4 EMA Lines
Overview:
This is a scalping trading strategy built on signals from 4 EMA moving averages: EMA(8), EMA(12), EMA(24) and EMA(72).
Conditions:
- Time frame: H1 (1 hour).
- Trading assets: Applicable to major currency pairs with high volatility
- Risk management: Use a maximum of 1-2% of capital for each transaction. The order holding time can be from a few hours to a few days, depending on the price fluctuation amplitude.
Trading rules:
Determine the main trend:
Uptrend: EMA(8), EMA(12) and EMA(24) are above EMA(72).
Downtrend: EMA(8), EMA(12) and EMA(24) are below EMA(72).
Trade in the direction of the main trend** (buy in an uptrend and sell in a downtrend).
Entry conditions:
- Only trade in a clearly trending market.
Uptrend:
- Wait for the price to correct to the EMA(24).
- Enter a buy order when the price closes above the EMA(24).
- Place a stop loss below the bottom of the EMA(24) candle that has just been swept.
Downtrend:
- Wait for the price to correct to the EMA(24).
- Enter a sell order when the price closes below the EMA(24).
- Place a stop loss above the top of the EMA(24) candle that has just been swept.
Take profit and order management:
- Take profit when the price moves 20 to 40 pips in the direction of the trade.
Use Trailing Stop to optimize profits instead of setting a fixed Take Profit.
Note:
- Do not trade within 30 minutes before and after the announcement of important economic news, as the price may fluctuate abnormally.
Additional filters:
To increase the success rate and reduce noise, this strategy uses additional conditions:
1. The price is calculated only when the candle closes (no repaint).
2. When sweeping through EMA(24), the price needs to close above EMA(24).
3. The closing price must be higher than 50% of the candle's length.
4. **The bottom of the candle sweeping through EMA(24) must be lower than the bottom of the previous candle (liquidity sweep).
---
Alert function:
When the EMA(24) sweep conditions are met, the system will trigger an alert if you have set it up.
- Entry point: The closing price of the candle sweeping through EMA(24).
- Stop Loss:
- Buy Order: Place at the bottom of the sweep candle.
- Sell Order: Place at the top of the sweep candle.
---
Note:
This strategy is designed to help traders identify profitable trading opportunities based on trends. However, no strategy is 100% guaranteed to be successful. Please test it thoroughly on a demo account before using it.

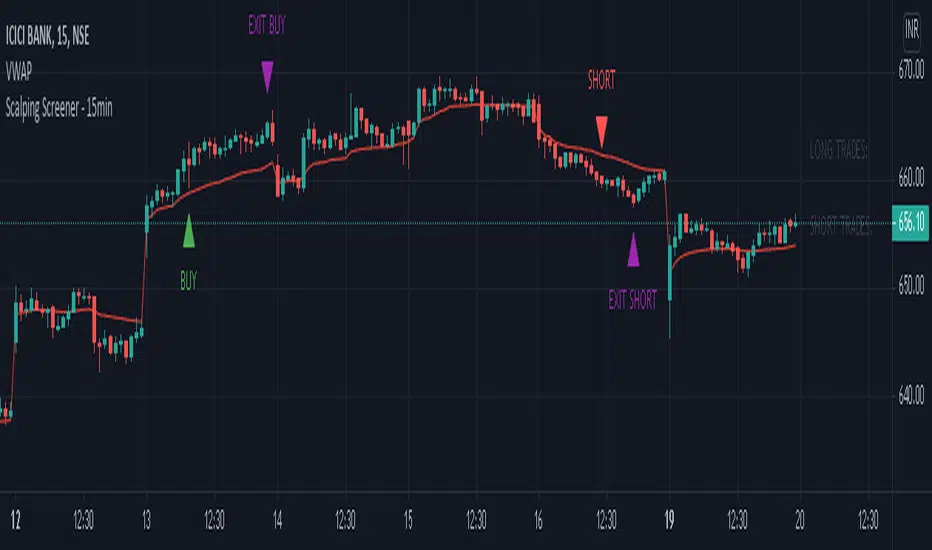
Scalping Screener - 15minSCALPING SCREENER - 15 mins (Indicator Tool)
TIME FRAME to use - 15 mins
DURATION OF TRADE - Using this indicator, Trade must be taken only during market hours and must be closed before market close (must not be carried forrward for next day).
SCALPING - This is a scalping strategy that is intended to make small profits in intraday trading
ENTRY CONCEPT -
- There must be 2 bulish candles and the 2nd candle's high should be greater than first candle's high.
- And If the latest candle high breaks high of the 2nd candle (prev candle), BUY signal is generated.
- Additional filters are added to reduce non-performaing trades.
- visa versa for SHORT signal
EXIT CONCEPT -
- 2nd candles low is the stop loss.
- Difference between 2nd candle high and 2nd candle low is target.
- The script will indicate when to BUY / SHORT and when to EXIT the trade.
INSTRUMENTS TO TRADE -
- High volatility instruments are best to be traded
- Nifty 50 stocks have been added to this indicator for the sake of screener. User can change these stocks with high volatility ones
- There is a limitation to add upto 40 scripts.
SCREENER FUNCTION -
- Right side of the chart has screener section which shows the list of stocks that qualify as per the BUY / SELL signal
NOTE -
The purpose of the scipt is for self learning / improvement and analysis.
Trading is a risky business and a trader must take any trade at their own RISK.
The author shall not be held responsible for Losses / Profits
Scalping Support Resistance StrategyScalping strategy for BTC using one line: Support Resistance.
The strategy draws a line based on the minimum value of the average of High, Low, and Close for a given bar. The entries are carried out on the breakdown of this line. Exits are managed by the specified in the script's inputs take-profit and stop-loss percentages.
From Stream:
www.tradingview.com

Scalping with Bill Williams AlligatorScalping strategy based on Bill Williams Alligator technique but calculated with heikin ashi candles.
This strategy has to be applied to standard candles and low time frames (1min to 5min)
Thanks to all pinescripters mentined in the code for their snippets.
It could be improved with stop loss based on ATR etc.
I have also a study with alerts.
Please use comment section for any feedback or contact me if you need support.

Trench Cross ScalperThe original script was posted on ProRealCode by user Nicolas.
This indicator is an attempt of scalping strategy by crossing the mean high or low weigthed price over a short "n" period. This 2 lines represent the black "trench" on screenshots attached.
When signal line (blue one) crossing the buy trigger one (dotted green one) a buy signal should occur and vice-versa for a sell signal (when crossing the dotted red one). I add an option to draw the white signal line as the close price value of the high/low ones if they are respectively above or below the trench' buy or sell lines trigger.
The yellow green and red brick lines serve as stoploss.
The indicator can be use alone with no price chart as its values are derivated from it, of course if you dont mind about candlesticks informations.
I think enter/exit trades should occur very quickly, as it were designed for scalping trading purpose. I didn't have much time to test it for a long period, so here it is as a concept indicator, despite that, it does have sense.

Scalp Precision Matrix [BullByte]SCALP PRECISION MATRIX (SPM)
OVERVIEW
Scalp Precision Matrix (SPM) is a comprehensive decision-support framework designed specifically for scalpers and short-term traders. This indicator synthesizes five distinct analytical layers into a unified system that helps identify high-quality setups while avoiding common pitfalls that trap traders.
━━━━━━━━━━━━━━━━━━━━━━━━━━━━━━━━━━━━━━━━━━━
THE CORE PROBLEM THIS INDICATOR ADDRESSES
Scalping demands rapid decision-making while simultaneously processing multiple data points. Traders constantly ask themselves: Is momentum still alive? Am I entering near a potential reversal zone? Is this the right session to trade? What is my actual risk-to-reward? Most traders either overwhelm themselves with too many separate indicators (creating analysis paralysis) or use too few (missing crucial context).
SPM was developed to consolidate these essential checks into one cohesive framework. Rather than overlaying disconnected indicators, each component in SPM directly informs and adjusts the others, creating an integrated analytical system.
━━━━━━━━━━━━━━━━━━━━━━━━━━━━━━━━━━━━━━━━━━━
WHY THESE SPECIFIC COMPONENTS AND HOW THEY WORK TOGETHER
The five analytical layers in SPM are not arbitrarily combined. Each addresses a specific question in the scalping decision process, and together they form a logical workflow:
LAYER 1: MOMENTUM FUEL GAUGE
This answers the question: "Does the current move still have energy?"
After any impulse move (a significant directional price movement), momentum naturally decays over time. The Fuel Gauge estimates remaining momentum by analyzing four factors:
Body Strength (30% weight): Compares recent candle body sizes against the historical average. Strong momentum produces candles with large bodies relative to their wicks. The calculation takes the 3-bar average body size divided by the 20-bar average body size, then scales it to a 0-100 range.
Wick Rejection (25% weight): Measures the wick-to-body ratio. When wicks are large relative to bodies, it suggests rejection and weakening momentum. A ratio of 2.0 or higher (wicks twice the body size) scores low; smaller ratios score higher.
Volume Consistency (20% weight): Compares recent 3-bar average volume against the lookback period average. Sustained moves require consistent volume support. Volume dropping off suggests the move may be losing participation.
Time Decay (25% weight): Tracks how many bars have passed since the last detected impulse. Momentum naturally fades over time. The typical impulse duration is adjusted based on the current volatility regime.
These components are weighted and combined, then smoothed with a 3-period EMA to reduce noise. The result is a 0-100% gauge where:
- Above 70% = Strong momentum (green)
- 40-70% = Moderate momentum (amber)
- Below 40% = Weak momentum (red)
- Below 20% = Exhausted (triggers EXIT warning)
The Fuel Gauge also estimates how many bars of momentum remain based on the current burn rate.
IMPORTANT DISCLAIMER : The Fuel Gauge is NOT order flow, volume profile, or depth of market data. It is a technical proxy calculated entirely from standard OHLCV (Open, High, Low, Close, Volume) data. The term "Fuel" is used metaphorically to represent estimated remaining momentum energy.
LAYER 2: TRAP ZONE DETECTION
This answers the question: "Am I walking into a potential reversal area?"
Price tends to reverse at levels where it has reversed before. SPM identifies these zones by detecting clusters of historical swing points:
How it works:
1. The indicator detects swing highs and swing lows using the Swing Detection Length setting (default 5 bars on each side required to confirm a pivot).
2. Recent swing points are stored (up to 10 of each type).
3. For each potential zone, the algorithm counts how many swing points cluster within a tolerance of 0.5 ATR.
4. Zones with 2 or more clustered swing points, positioned between 0.3 and 4.0 ATR from current price, are marked as Trap Zones.
5. A Confluence Score is calculated based on cluster density and proximity to current price.
The percentage displayed (e.g., "TRAP 85%") is a CONFLUENCE SCORE, not a probability. Higher percentages mean more swing points cluster at that level and price is closer to it. This indicates stronger historical significance, not a prediction of future reversal.
CRITICAL DISCLAIMER : Trap Zones are NOT institutional order flow, liquidity pools, smart money footprints, or any proprietary data feed. They are calculated purely from historical swing point clustering using standard technical analysis. The term "trap" describes how price action has historically reversed at these levels, potentially trapping traders who enter prematurely. This is pattern recognition, not market structure data.
LAYER 3: VELOCITY ANALYSIS
This answers the question: "Is price moving favorably right now?"
Velocity measures how fast price is currently moving compared to its recent average:
Calculation:
- Current velocity = Absolute price change from previous bar divided by ATR
- Average velocity = Simple moving average of velocity over the lookback period
- Velocity ratio = Current velocity divided by average velocity
Classification:
- FAST (ratio above 1.5 ): Price is moving significantly faster than normal. Good for momentum continuation plays.
- NORMAL (ratio 0.5 to 1.5) : Typical price movement speed.
- SLOW (ratio below 0.5 ): Price is moving sluggishly. Often indicates ranging or choppy conditions where scalping becomes difficult.
The velocity score contributes 18% to the overall quality score calculation.
LAYER 4: SESSION AWARENESS
This answers the question: "Is this a good time to trade?"
Different trading sessions have different characteristics. SPM automatically detects which major session is active and adjusts its quality assessment:
Session Times (all in UTC):
- A sia Session : 00:00 - 08:00 UTC
- London Session : 08:00 - 16:00 UTC
- New York Session : 13:00 - 21:00 UTC
- London/NY Overlap : 13:00 - 16:00 UTC
- Off-Peak : Outside major sessions
Session Quality Weighting:
- Overlap : 100 points (highest liquidity, best movement)
- London : 85 points
- New York : 80 points
- Asia : 50 points (tends to range more)
- Off-Peak : 30 points (lower liquidity, more false signals)
The session score contributes 17% to the overall quality calculation. Signals are also filtered to prevent firing during off-peak hours.
Note : These are fixed UTC times and may not perfectly match your broker's session boundaries. Use them as general guidance rather than precise timing.
LAYER 5: VOLATILITY REGIME ADAPTATION
This answers the question: "How should I adjust for current market conditions?"
SPM compares current volatility (14-period ATR) against historical volatility (50-period ATR) to categorize the market:
HIGH Volatility (ratio above 1.3): Current ATR is 30%+ above normal. SPM widens thresholds to filter noise and extends target projections.
NORMAL Volatility (ratio 0.7 to 1.3): Typical conditions. Standard parameters apply.
LOW Volatility (ratio below 0.7): Current ATR is 30%+ below normal. SPM tightens thresholds for sensitivity and reduces target expectations. The market state may show AVOID during prolonged low volatility.
This adaptation prevents false signals during erratic markets and missed signals during quiet markets.
━━━━━━━━━━━━━━━━━━━━━━━━━━━━━━━━━━━━━━━━━━━
THE SYNERGY: WHY THIS COMBINATION MATTERS
These five layers are not independent indicators placed on one chart. They form an interconnected system:
- A signal only fires when momentum exists (Fuel above 40%), price is away from danger zones (Trap Zones factored into quality score), movement is favorable (Velocity contributes to score), timing is appropriate (Session is not off-peak), and volatility is accounted for (thresholds adapt to regime).
- The Trap Zones directly influence Entry Zone placement. Entry zones are positioned beyond trap zones to avoid getting caught in reversals.
- Target projections automatically adjust to avoid placing take-profit levels inside detected trap zones.
- The Fuel Gauge affects which signal tier fires. Insufficient fuel prevents all signals.
- Session quality is weighted into the overall score, reducing signal quality during less favorable trading hours.
This integration is the core originality of SPM. Each component makes the others more useful than they would be in isolation.
━━━━━━━━━━━━━━━━━━━━━━━━━━━━━━━━━━━━━━━━━━━
HOW THE QUALITY SCORE IS CALCULATED
The Quality Score (0-100) synthesizes all layers into a single number for each direction (long and short):
For Long Quality Score:
- Fuel Component (28% weight) : Full fuel value if impulse direction is bullish; 60% of fuel value otherwise
- Trap Avoidance (22% weight) : 75 points if no trap zone below; otherwise 100 minus the trap confluence score (minimum 20)
- Velocity Component (18% weight) : Direct velocity score
- Session Component (17% weight) : Current session quality score
- Trend Alignment (15% bonus) : Adds 12 points if price is above the 20-period SMA
For Short Quality Score:
- Same structure but reversed (bearish impulse direction, trap zone above, price below SMA)
The direction with the higher score becomes the current Bias. A 12-point difference is required to switch bias, preventing flip-flopping in neutral conditions.
━━━━━━━━━━━━━━━━━━━━━━━━━━━━━━━━━━━━━━━━━━━
SIGNAL TYPES AND WHAT THEY MEAN
SPM generates four types of signals, each with specific visual representation:
PRIME SIGNALS (Cyan Diamond)
These represent the highest quality confluence. Requirements:
- Quality score crosses above the Prime threshold (default 80)
- Bias aligns with signal direction
- Fuel is sufficient (above 40%)
- Session is active (not off-peak)
- Cooldown period has passed
Prime signals appear as cyan-colored diamond shapes. Long signals appear below the bar; short signals appear above.
STANDARD SIGNALS (Green Triangle Up / Red Triangle Down)
These represent good quality setups. Requirements:
- Quality score crosses above the Standard threshold (default 75) but below Prime
- Same bias, fuel, and cooldown requirements as Prime
Standard signals appear as small triangles in green (long) or red (short).
CAUTION SIGNALS (Small Faded Circle)
These represent minimum threshold setups. Requirements:
- Quality score crosses above the Caution threshold (default 65) but below Standard
- Same additional requirements
Caution signals appear as small, faded circles. These suggest the setup exists but with weaker confluence. Consider these only when broader market context supports them, or skip them entirely during uncertain conditions.
EXHAUSTION SIGNAL (Purple X with "EXIT" text)
This warning appears when the Fuel Gauge drops below 20% from above, indicating momentum has depleted. This is not a trade signal but a warning to:
- Consider exiting existing positions
- Avoid entering new trades in the current direction
- Wait for new momentum to develop
All signals use CONFIRMED bar data only (referencing the previous closed bar) to prevent repainting. Once a signal appears, it will never disappear or change position on historical bars.
━━━━━━━━━━━━━━━━━━━━━━━━━━━━━━━━━━━━━━━━━━━
READING THE CHART ELEMENTS
TRAP ZONES (Red Dashed Box with "TRAP XX%" Label)
These mark price levels where multiple historical swing points cluster. The red dashed box shows the zone boundaries. The percentage is the confluence score indicating cluster strength and proximity.
How to use: When price approaches a trap zone, be cautious about entering in that direction. If your bias is LONG and there's a strong trap zone above, consider taking partial profits before price reaches it or adjusting your target below it.
ENTRY ZONES (Green Solid Box with "ENTRY" Label)
These show suggested entry areas based on the current bias direction. For LONG bias, the entry zone appears below the trap zone (buying the dip beyond support). For SHORT bias, it appears above the trap zone (selling the rally beyond resistance).
How to use: Rather than entering at current price, consider placing limit orders within the entry zone. This positions you beyond where typical trap reversals occur.
TARGET ZONES (Blue Dotted Box with "TARGET" Label)
These project potential take-profit areas based on ATR multiples, adjusted for:
- Current volatility regime (wider in high volatility, tighter in low)
- Impulse direction (larger targets when aligned with impulse)
- Nearby trap zones (targets adjust to avoid placing TP inside trap zones)
How to use: These are suggestions, not guarantees. Consider taking partial profits before the target or using trailing stops once price moves favorably.
STOP LEVEL (Orange Dashed Line with "STOP" Label)
This shows suggested stop-loss placement, calculated as 0.8 ATR beyond the trap zone (or 2.0 ATR from current price if no trap zone exists).
How to use: This provides a reference for risk calculation. The dashboard R:R ratio is calculated using this stop level.
Chart Example: Scalp Precision Matrix displays real-time market analysis through dynamic zones and quality scores. ENTRY/TARGET/STOP zones show potential price levels based on current market structure - they appear continuously as reference points, NOT as trade instructions. Actual trade signals (diamonds, triangles, circles) fire only when multiple conditions align: quality score thresholds are crossed, fuel gauge is sufficient, session is active, and cooldown period has passed. The zones help you understand market context; the signals tell you when to act.
━━━━━━━━━━━━━━━━━━━━━━━━━━━━━━━━━━━━━━━━━━━
UNDERSTANDING THE DASHBOARD (Top Right Panel)
The main dashboard provides comprehensive market context:
Row 1 - Header:
- "SPM " : Indicator name
- Market State : Current overall condition
Market States Explained:
- PRIME : Excellent conditions. Quality score meets prime threshold, session is active. Best opportunities.
- READY : Good conditions. Quality score meets standard threshold. Solid setups available.
- WAIT : Mixed conditions. Some factors favorable, others not. Patience recommended.
- AVOID : Poor conditions. Off-peak session or very low volatility. High risk of false signals.
- EXIT : Fuel exhausted. Momentum depleted. Consider closing positions or waiting.
Row 2-3 - Quality Bars:
- " UP ########## " : Visual meter for long quality (each # = 10 points, . = empty)
- " DN ########## " : Visual meter for short quality
- The number on the right shows the exact quality score
Row 4 - Bias:
- Shows current directional lean: LONG, SHORT, or NEUTRAL
- Color-coded: Green for long, red for short, gray for neutral
Rows 5-7 (Full Mode Only) - Trade Levels:
- Entry : Suggested entry price for current bias direction
- Stop : Suggested stop-loss price
- Target : Projected take-profit price
Row 8 - Risk:Reward Ratio:
- Format : "1:X.X" where X.X is the reward multiple
- Color-coded : Green if 2:1 or better, amber if 1.5:1 to 2:1, red if below 1.5:1
Row 9 - Fuel:
- Shows percentage and estimated bars remaining in parentheses
- Example : "72% (8)" means 72% fuel with approximately 8 bars remaining
- Color-coded : Green above 70%, amber 40-70%, red below 40%
Row 10-11 (Full Mode Only) - Market Conditions:
- Vol : Current volatility regime (HIGH/NORMAL/LOW)
- Speed : Current velocity zone (FAST/NORMAL/SLOW)
Row 12 - Session:
- Shows active trading session
- Color-coded by session type
Row 13 (Full Mode Only) - Remaining:
- Time remaining in current session (hours and minutes)
Row 14 (Conditional) - Trap Warning:
- Appears when a significant trap zone exists in your bias direction
- Shows direction (ABOVE/BELOW) and confluence percentage
━━━━━━━━━━━━━━━━━━━━━━━━━━━━━━━━━━━━━━━━━━━
UNDERSTANDING THE QUICK PANEL (Bottom Left)
The Quick Panel provides essential information at a glance without looking away from price action:
Row 1: Current Bias and Quality Score (large text for quick reading)
Row 2: Market State
Row 3: Fuel Percentage
Row 4: Estimated Bars Remaining
Row 5: Risk:Reward Ratio
Row 6: Current Session
Both panels can be repositioned using the settings, and each can be toggled on/off independently.
━━━━━━━━━━━━━━━━━━━━━━━━━━━━━━━━━━━━━━━━━━━
SETTINGS EXPLAINED
CORE SETTINGS:
Analysis Lookback (Default: 20)
Number of bars used for statistical calculations including average volume and average body size. Higher values create smoother but slower-reacting analysis. Lower values are more responsive but may include more noise.
Swing Detection Length (Default: 5)
Bars required on each side to confirm a swing high or low. A setting of 5 means a swing high must have 5 lower highs on each side. Lower values detect more swings (more trap zones, more sensitivity). Higher values find only major pivots (fewer but more significant zones).
Impulse Sensitivity (Default: 1.5)
Multiplier for ATR when detecting impulse moves. Lower values (like 1.0) detect smaller price movements as impulses, refreshing the fuel gauge more frequently. Higher values (like 2.5) require larger moves, making impulse detection less frequent but more significant.
SIGNAL SETTINGS:
Prime/Standard/Caution Thresholds (Defaults: 80/75/65)
These control the quality score required for each signal tier. You can adjust these based on your preference:
- More conservative : Raise thresholds (e.g., 85/80/70) for fewer but higher-quality signals
- More aggressive : Lower thresholds (e.g., 75/70/60) for more signals with slightly lower quality
Signal Cooldown (Default: 8 bars)
Minimum bars between signals to prevent signal spam. After any signal fires, no new signals can appear until this many bars pass. Increase for fewer signals in choppy markets; decrease if you want faster signal refresh.
Show Prime/Standard/Caution/Exhaustion Signals
Toggle each signal type on or off based on your preference.
ZONE DISPLAY:
Show Trap Zones / Entry Zones / Target Zones / Stop Levels
Toggle each zone type on or off. Turning off zones you don't use reduces chart clutter.
Zone Transparency (Default: 88)
Controls how transparent zone boxes appear. Higher values (closer to 95) make zones barely visible; lower values (closer to 75) make them more prominent.
Zone History (Default: 25 bars)
How far back zone boxes extend on the chart. Purely visual preference.
BACKGROUND:
Background Mode (Options: Off, Subtle, Normal)
Controls whether and how intensely the chart background is colored. Subtle is barely noticeable; Normal is more visible; Off disables background coloring entirely.
Background Type (Options: Bias, Fuel)
- Bias : Colors background based on current directional lean (green for long, red for short)
- Fuel : Colors background based on momentum level (green for high fuel, amber for moderate, red for low)
DASHBOARD / QUICK PANEL:
Show Dashboard / Show Quick Panel
Toggle each panel on or off.
Compact Mode
When enabled, the main dashboard shows only essential rows (quality bars, bias, R:R, fuel, session) without entry/stop/target levels, volatility, velocity, or time remaining.
Position Settings
Choose where each panel appears on your chart from six options: Top Right, Top Left, Bottom Right, Bottom Left, Middle Right, Middle Left.
ALERTS:
Alert Prime Signals / Standard Signals / Fuel Exhaustion
Enable or disable TradingView alerts for each condition. When enabled, you can set up alerts in TradingView that will notify you when these conditions occur.
━━━━━━━━━━━━━━━━━━━━━━━━━━━━━━━━━━━━━━━━━━━
RECOMMENDED TIMEFRAMES AND USAGE
OPTIMAL TIMEFRAMES:
- 1-minute to 5-minute : Best for active scalping with quick entries and exits
- 5-minute to 15-minute : Balanced scalping with slightly more confirmation
- 15-minute to 1-hour : Short-term swing entries, fewer but more significant signals
Zone visualizations only appear on intraday timeframes to prevent chart clutter on higher timeframes.
BEST PRACTICES:
1. Trade primarily during LONDON, NEW YORK, or OVERLAP sessions. The indicator weights these sessions higher for good reason - liquidity and movement are typically better.
2. Prioritize PRIME signals. These represent the highest confluence and have proven most reliable. Use STANDARD signals as secondary opportunities. Treat CAUTION signals with extra scrutiny.
3. Respect the Fuel Gauge. Avoid entering new positions when fuel is below 40%. When the EXIT signal appears, seriously consider closing or reducing positions.
4. Pay attention to TRAP warnings. When the dashboard shows a trap zone in your bias direction, be cautious about holding through that level.
5. Verify R:R before entry. The dashboard shows the risk-to-reward ratio. Ensure it meets your minimum requirements (many traders require at least 1.5:1 or 2:1).
6. When state shows AVOID or EXIT, step back. These conditions typically produce poor results.
7. Combine with your own analysis. SPM is a decision-support tool, not a standalone system. Use it alongside your understanding of market structure, news events, and overall context.
━━━━━━━━━━━━━━━━━━━━━━━━━━━━━━━━━━━━━━━━━━━
PRACTICAL EXAMPLE
Scenario : You're watching a 5-minute chart during London session. A cyan diamond (Prime Long signal) appears below the bar.
Before entering, you check the dashboard:
- State shows "PRIME" - conditions are favorable
- Fuel shows "72% (8)" - plenty of momentum remaining (approximately 8 bars)
- R:R shows "1:2.3" - acceptable risk-to-reward ratio
- Session shows "LONDON" - active session with good liquidity
- No TRAP warning in dashboard - no immediate resistance cluster in your way
- Entry zone visible on chart at a lower price level
- Stop and Target zones clearly marked
With this confluence of factors, you have context for a more informed decision. The signal indicates quality, the fuel suggests momentum remains, the R:R is favorable, and no immediate trap threatens your trade.
However, you also notice the target zone sits just below where a trap zone would be if there were one. This is by design - SPM adjusts targets to avoid placing them inside reversal zones.
This multi-factor confirmation delivered in a single glance is what SPM provides.
Chart Example :This chart demonstrates how the Scalp Precision Matrix identifies key market transitions. After a strong bullish impulse (cyan PRIME signal at ~08:30), price reached a historical reversal cluster (TRAP ZONE at 92,300). The indicator detected momentum exhaustion (purple EXIT signal) as fuel dropped below 20%, warning traders to exit longs. Now showing a SHORT bias with entry/stop/target zones clearly marked. The 92% trap zone confluence indicates a strong cluster of previous swing highs where price historically reversed.
━━━━━━━━━━━━━━━━━━━━━━━━━━━━━━━━━━━━━━━━━━━
DATA WINDOW VALUES
For detailed analysis and strategy development, SPM exports the following values to TradingView's Data Window (visible when you hover over the chart with the indicator selected):
- Long Quality Score (0-100)
- Short Quality Score (0-100)
- Fuel Gauge (0-100%)
- Risk:Reward Ratio
These values can be useful for understanding how the indicator behaves over time and for developing your own insights about when it works best for your trading style.
━━━━━━━━━━━━━━━━━━━━━━━━━━━━━━━━━━━━━━━━━━━
NON-REPAINTING CONFIRMATION
All signals in SPM are generated using CONFIRMED bar data only. The signal logic references the previous closed bar's values ( and in Pine Script terms). This means:
- Signals appear at the OPEN of the new bar (after the previous bar closes)
- Signals will NEVER disappear once they appear
- Signals will NEVER change position on historical bars
- What you see in backtesting is what you would have seen in real-time
The dashboard and zones update in real-time to provide current market context, but the trading signals themselves are non-repainting.
━━━━━━━━━━━━━━━━━━━━━━━━━━━━━━━━━━━━━━━━━━━
IMPORTANT DISCLAIMERS
TERMINOLOGY CLARIFICATION:
This indicator uses terms that might imply access to data it does not have. To be completely transparent:
- "Trap Zones" are calculated from historical swing point clustering. They are NOT institutional liquidity pools, order blocks, smart money footprints, or any form of order flow data. The term "trap" is metaphorical, describing how price has historically reversed at these levels.
- "Fuel Gauge" is a technical momentum proxy. It is NOT order flow, volume profile, depth of market, or bid/ask data. It estimates momentum remaining based entirely on standard OHLCV price and volume data.
- "Quality Scores" are weighted combinations of the technical factors described above. A high score indicates multiple conditions align favorably according to the indicator's logic. It does NOT predict or guarantee trade success.
- The percentages shown on trap zones are CONFLUENCE SCORES measuring cluster density and proximity. They are NOT probability predictions of reversal.
TRADING RISK WARNING:
Trading involves substantial risk of loss and is not suitable for all investors. This indicator is a technical analysis tool designed to assist with decision-making. It does not constitute financial advice, trading advice, or any other sort of advice. Past performance of any signal or pattern does not guarantee future results. Markets are inherently unpredictable.
Always use proper risk management. Define your risk before entering any trade. Never risk more than you can afford to lose. Consider consulting with a licensed financial advisor before making trading decisions.
━━━━━━━━━━━━━━━━━━━━━━━━━━━━━━━━━━━━━━━━━━━
ORIGINALITY STATEMENT - NOT A MASHUP
Scalp Precision Matrix is an original work that combines several analytical concepts into a purpose-built scalping framework. While individual components like ATR calculations, pivot detection, session timing, and trend alignment exist in various forms elsewhere, the specific implementation here represents original synthesis:
- The Fuel Gauge decay model with its four-component weighted calculation
- The Trap Zone cluster detection with confluence scoring
- The multi-factor quality scoring system that integrates all layers
- The trap-aware entry and target zone placement logic
- The volatility regime adaptation across all components
- The session weighting is integrated into the quality assessment
The indicator does not simply overlay separate indicators on one chart. It creates interconnected layers where each component informs and adjusts the others. This integration is the core originality of SPM.
━━━━━━━━━━━━━━━━━━━━━━━━━━━━━━━━━━━━━━━━━━━
For best results, combine SPM with your own market understanding and always practice proper risk management.
-BullByte

Scalper's toolkit - ATR WidgetWidget specifically designed for scalping. Many settings to fit the instrument and view preferences to make it fit into your chart window how you like, even on mobile.
** I have 5 other features to add into this in the very near future, as I use this as my primary tool for Risk reward. This script will be updated in the near future as more features are coded into it. See bottom for notes on plans
Features:
Displays a quick view of the ATR value on the chart, in decimal PIPs or directly in Points - a key value for scalping using the DOM for point value settings and one click trading on fast time frames.
Automatic calculation of stop and target distance for a predetermined Risk Reward Ratio (Set with the settings panel), and then also displayed in PIPs or Points for easy use in quick trading.
Works on most all instruments/pairs/cryptos with multiple precision levels for correct values to be shown in the widget.
Fully customizable -
ATR period Base setting, just like a normal ATR indicator
Display in : PIPs or Points
ATR based stop distance, using a multiplier. 2 is the most common multiplier used, and the default setting.
Risk Reward Calculation using the Stop Loss value.
-Quickly helps with proper target and stop sizing for the volatility in the price on the current trade entry point.
-Set to any ratio you wish, from 1:0.1 all the way to 1:100 or more, unlimited R ratio settings to fit your strategy and risk tolerances.
Position anywhere on the chart window with 9 preset locations available (Pine script limitation)
Show as a column layout or a row layout
Customize the Size, with 5 preset widget sizes, from tiny to huge (Pine script limitation)
-Mobile Friendly - Tiny or Small may be too small on PC, but can be used for Mobile so the widget does not become too large over the chart.
Custom text, background, and boarder colors
Custom Boarder Size - 0 size is no boarder
Set up:
-Open the settings panel.
First section is the basic settings for the ATR - the length (Default is 14) and to use a PIP value display, or Point value display.
Here you also see a "Precision" Setting. **Because each instrument returns different precision ATR values, it is difficult to determine with code what those values will be ahead of time to do the math in the background. Even some 2 decimal instruments return 5 decimal ATR values, so this setting filters that** Just use the dropdown and choose how many decimal places the instrument has from 2 - 5 decimals
The second section is for risk and reward calculations, and can be disabled if you do not want to see these values.
The first value is the "ATR Multiplier" Typically, a 2x multiplier is used on the ATR to determine how far away to place your stop loss from the entry, placing it out of harm's way from normal market activity.
The second value is the Reward target distance, based from the stop loss size. This quickly calculates your target to match your intended reward ratio, saving some manual work to calculate this by hand every trade.
** Note: because of the math used in the code, you may see odd values on some instruments, like indexes. If you have the precision correct, try changing the "Show in Pips" to "Show in Points", as this may solve the issue.
The last two sections are purely for how the widget looks and how/where it shows on the screen. These can be set however you like. To have no boarder, just set the "Frame size" value to 0.
Additional Updates planned:
Pip value calculation (2 feature uses)
-This will serve 2 purposes. The widget will calculate the value of the trade based on the lot size. It will also have a risk limit, so if the ATR get's too high for the current risk settings, It will show red to warn you of a high risk situation before you trade.
Example, you have a set limit of 3 dollars per trade using .02 lot sizing. If the ATR get's too high, The Stop value will be more risk than you would like to use at that trade sizing. Reduce the trade size, or wait for ATR to come lower.
Purpose 2: lot size calculation, so if you wanted to maximize the use of risk available. If you wanted to risk 600 for example, it would use the ATR you have set for the risk, and determine the proper lot size for the amount of volatility in the market. This way, you Risk Exactly, or as close as possible to 600 for the the current trade conditions.
Extra use for this value: Show the Current trade amounts at risk and for gain in money values on the side of the pip/point value. Know what you're risking and also trading for in monetary value.
ATR candle Comparison- Early momentum Detection (2 feature uses)
Will show an additional section on the bottom of the widget to show how each candle compares to the one before, up to the last 5, and show if ATR went down, up, or stayed the same over the last 5 candles.
Show an additional symbol to indicate the current candle status in comparison to the close of the last candle. Real time of if the ATR is getting larger, smaller, or staying the same.

Scalp Boost LONG✦ Overview
Scalp Boost LONG is a visual tool designed to highlight potential short-term upward impulses.
A signal is generated only when multiple market conditions align at the candle close, combining momentum dynamics, local probability shifts, and abnormal volume behavior.
The indicator does not repaint.
✦ Concept
The tool focuses on selective situations where the market shows signs of micro-breakout potential.
If all internal conditions are confirmed — a LONG event is displayed.
If not — the chart remains clean.
This builds a low-noise signal model, prioritizing quality over frequency.
✦ Signal Logic
The LONG signal requires confirmation of all core conditions:
• Local impulse dynamics
Identifies short-term acceleration suggesting a breakout from a compressed price structure.
• Probability beyond a statistical zone
Uses relative breakout probability instead of fixed levels, checking whether price exceeds expected local ranges.
• Abnormal volume activity
Highlights candles with monetary flow above a custom threshold, signaling increased market interest.
• Anti-overheat filter
Conditions avoiding exhausted or low-momentum phases where continuation is less likely.
Only when all filters are aligned a LONG marker appears.
✦ Visual Structure
The chart display is intentionally minimal:
• ROC Curve
Subdued line, showing short-term momentum without distraction.
• LONG Marker
Green triangle below the candle on confirmed events.
• Candle Highlight
Soft background highlight on the signal bar.
• Volume Marker
Small red dot at the bottom of candles with abnormal monetary flow.
All visual elements appear only on candle close.
✦ Alerts
A clean event structure is available for notifications:
LONG Signal
This allows receiving alerts during chart analysis or in automated workflows while keeping full control over decision-making.
✦ Notes & Guidelines
This tool:
is not a trading system,
does not provide targets or stops,
may trigger against the dominant trend,
should be combined with the user’s own methodology.
Signals are rare by design.
Do not interpret each event as a trend continuation — it highlights conditions, not outcomes.
✦ Suggested Use
-(Non-mandatory ideas for advanced users)
-identifying potential micro-breakouts,
-timing entries around volume spikes,
-adding context to scalping models,
-filtering impulsive moves from noise.
-suitable for a 5-minute timeframe
The indicator can be helpful as a confirmation layer, not a standalone decision tool.

Scalp ProScalp Pro is a scalping tool that uses the MACD mechanism. MACD lines are smoothed using fibonacci numbers and pi numbers. In this way, the noise on the signal is reduced. A " BUY " signal is generated when the lines cross upwards. If the lines cross down, a " SELL " signal is generated. The logic is very simple and the Indicator is very useful.
I wish you many profitable trades.

Scalping Entry/Exit Indicator by DiGetImagine having a tool that not only spots high-probability entry signals but also visually marks them on your chart with color-coded cues and automated alerts. The Scalping Entry/Exit Indicator by DiGet does exactly that—by fusing a range of classic candlestick patterns (such as Bullish Hammers, Engulfing patterns, and Morning/Evening Stars) with dynamic risk management levels, this script empowers you to make swift and informed trading decisions. Whether you're an active trader or an algorithm enthusiast, this indicator offers both precision and clarity in identifying scalp opportunities, making your chart analysis more efficient and visually engaging.
Indicator Breakdown
Input Parameters:
The indicator accepts a customizable risk-reward ratio, an ATR period for volatility measurement, and a lookback period to scan for valid candlestick patterns.
ATR & Candle Calculations:
It computes the Average True Range (ATR) to dynamically set stop-loss and take-profit levels. Additionally, it determines the body and wick sizes of each candlestick to help identify key reversal patterns.
Pattern Detection:
Multiple bullish patterns (Hammer, Engulfing, Morning Star) and bearish patterns (Shooting Star, Engulfing, Evening Star) are detected. There’s also a simplified version of the Head & Shoulders pattern, offering further validation for reversal signals.
Signal Generation & Trade Levels:
The script consolidates the pattern signals into combined “buy” and “sell” triggers. It then calculates the respective stop-loss (SL) and take-profit (TP) levels based on the current price and ATR, providing a robust risk management framework.
Visual Aids & Alerts:
To enhance usability, the indicator changes the chart’s background color to green for buy signals and red for sell signals. It also draws labels, lines (representing SL and TP), and markers directly on the chart, along with alert conditions to notify traders of actionable signals.
This indicator is an excellent addition to your TradingView toolkit—ideal for scalpers and short-term traders seeking clarity, precision, and automated signal generation on their charts.
Enjoy trading with confidence and precision!

yuthavithi's BB ScalperA trend based BB scalper. It uses day time frame data to determine trend. When price moves above sma, it is up trend , otherwise it is down trend. the trading signal is determined in lower time frame using bband. In up trend, it will only buy and close when price reaches bb upper band. In downtrend it will do the opposite

Scalping PullBack Tool R1 by JustUncleLDescription
This study project is a Scalping Pullback trading Tool that incorporates the majority of the indicators needed to analyse and scalp Trends for Pull Backs and reversals on 1min, 5min or 15min charts. The set up utilies Heikin Ashi candle charts. Incorporated within this tool are the following indicators:
1. Major industry (Banks) recognised important EMAs in an EMA Ribbon:
Green = EMA89
Blue = EMA200
Black = EMA633
2. The 36EMA (default) High/Low+Close Price Action Channel (PAC).
3. Fractals
4. HH, LH, LL, HL finder to help with drawing Trend lines and mini Trend Lines.
5. Coloured coded Bar high lighting based on the PAC:
blue = bar closed above PAC
red = bar closed below PAC
gray = bar closed inside PAC
red line = EMA36 of bar close
Setup and hints:
Set the chart to Heikin Ashi Candles.
Add "Sweetspot Gold10" indicator to the chart as well to help with support and resistance finding and shows where the important "00" and "0" lines are.
When price is above the PAC(blue bars) we are only looking to buy as price comes back to the PAC
When price is below the PAC(red bars), we are only looking to sell when price comes back to the PAC
What we’re looking for when price comes back into the PAC we draw mini Trendlines utilising the Fractals and HH/LL points to guide your TL drawing.
Now look for the trend to pull back and break the drawn TL. That's is when we place the scalp trade.
So we are looking for continuation signals in terms of a strong, momentum driven pullbacks (normally short term 10-20 pips) of the EMA36.
The other EMAs are there to check for other Pullbacks when EMA36 is broken.
Other than the SweetSpot Gold10 indicator, you should not need any other indicator to scalp the pullbacks.
References:
Fractals V8 by RicardoSantos
Price Action Trading System v0.3 by JustUncleL
SweetSpot Gold10 R1 by JustUncleL
www.swing-trade-stocks.com
www.forexstrategiesresources.com

ScalpSwing Pro SetupScript Overview
This script is a multi-tool setup designed for both scalping (1m–5m) and swing trading (1H–4H–Daily). It combines the power of trend-following , momentum , and mean-reversion tools:
What’s Included in the Script
1. EMA Indicators (20, 50, 200)
- EMA 20 (blue) : Short-term trend
- EMA 50 (orange) : Medium-term trend
- EMA 200 (red) : Long-term trend
- Use:
- EMA 20 crossing above 50 → bullish trend
- EMA 20 crossing below 50 → bearish trend
- Price above 200 EMA = uptrend bias
2. VWAP (Volume Weighted Average Price)
- Shows the average price weighted by volume
- Best used in intraday (1m to 15m timeframes)
- Use:
- Price bouncing from VWAP = reversion trade
- Price far from VWAP = likely pullback incoming
3. RSI (14) + Key Levels
- Shows momentum and overbought/oversold zones
- Levels:
- 70 = Overbought (potential sell)
- 30 = Oversold (potential buy)
- 50 = Trend confirmation
- Use:
- RSI 30–50 in uptrend = dip buying zone
- RSI 70–50 in downtrend = pullback selling zone
4. MACD Crossovers
- Standard MACD with histogram & cross alerts
- Shows trend momentum shifts
- Green triangle = Bullish MACD crossover
- Red triangle = Bearish MACD crossover
- Use:
- Confirm swing trades with MACD crossover
- Combine with RSI divergence
5. Buy & Sell Signal Logic
BUY SIGNAL triggers when:
- EMA 20 crosses above EMA 50
- RSI is between 50 and 70 (momentum bullish, not overbought)
SELL SIGNAL triggers when:
- EMA 20 crosses below EMA 50
- RSI is between 30 and 50 (bearish momentum, not oversold)
These signals appear as:
- BUY : Green label below the candle
- SELL : Red label above the candle
How to Trade with It
For Scalping (1m–5m) :
- Focus on EMA crosses near VWAP
- Confirm with RSI between 50–70 (buy) or 50–30 (sell)
- Use MACD triangle as added confluence
For Swing (1H–4H–Daily) :
- Look for EMA 20–50 cross + price above EMA 200
- Confirm trend with MACD and RSI
- Trade breakout or pullback depending on structure

Scalping with Williams %R, MACD, and SMA (1m)Overview:
This trading strategy is designed for scalping in the 1-minute timeframe. It uses a combination of the Williams %R, MACD, and SMA indicators to generate buy and sell signals. It also includes alert functionalities to notify users when trades are executed or closed.
Indicators Used:
Williams %R : A momentum indicator that measures overbought and oversold conditions. The Williams %R values range from -100 to 0.
Length: 140 bars (i.e., 140-period).
MACD (Moving Average Convergence Divergence) : A trend-following momentum indicator that shows the relationship between two moving averages of a security's price.
Fast Length: 24 bars
Slow Length: 52 bars
MACD Length: 9 bars (signal line)
SMA (Simple Moving Average) : A trend-following indicator that smooths out price data to create a trend-following indicator.
Length: 7 bars
Conditions and Logic:
Timeframe Check :
The strategy is designed specifically for the 1-minute timeframe. If the current chart is not on the 1-minute timeframe, a warning label is displayed on the chart instructing the user to switch to the 1-minute timeframe.
Williams %R Conditions :
Buy Condition: The strategy looks for a crossover of Williams %R from below -94 to above -94. This indicates a potential buying opportunity when the market is moving out of an oversold condition.
Sell Condition: The strategy looks for a crossunder of Williams %R from above -6 to below -6. This indicates a potential selling opportunity when the market is moving out of an overbought condition.
Deactivate Buy: If Williams %R crosses above -40, the buy signal is deactivated, suggesting that the buying condition is no longer valid.
Deactivate Sell: If Williams %R crosses below -60, the sell signal is deactivated, suggesting that the selling condition is no longer valid.
MACD Conditions :
MACD Histogram: Used to identify the momentum and the direction of the trend.
Long Entry: The strategy initiates a buy order if the MACD histogram shows a positive bar after a negative bar while a buy condition is active and Williams %R is above -94.
Long Exit: The strategy exits the buy position if the MACD histogram turns negative and is below the previous histogram bar.
Short Entry: The strategy initiates a sell order if the MACD histogram shows a negative bar after a positive bar while a sell condition is active and Williams %R is below -6.
Short Exit: The strategy exits the sell position if the MACD histogram turns positive and is above the previous histogram bar.
Trend Confirmation (Using SMA) :
Bullish Trend: The strategy considers a bullish trend if the current price is above the 7-bar SMA. A buy signal is only considered if this condition is met.
Bearish Trend: The strategy considers a bearish trend if the current price is below the 7-bar SMA. A sell signal is only considered if this condition is met.
Alerts:
Long Entry Alert: An alert is triggered when a buy order is executed.
Long Exit Alert: An alert is triggered when the buy order is closed.
Short Entry Alert: An alert is triggered when a sell order is executed.
Short Exit Alert: An alert is triggered when the sell order is closed.
Summary:
Buy Signal: Activated when Williams %R crosses above -94 and the price is above the 7-bar SMA. A buy order is placed if the MACD histogram shows a positive bar after a negative bar. The buy order is closed when the MACD histogram turns negative and is below the previous histogram bar.
Sell Signal: Activated when Williams %R crosses below -6 and the price is below the 7-bar SMA. A sell order is placed if the MACD histogram shows a negative bar after a positive bar. The sell order is closed when the MACD histogram turns positive and is above the previous histogram bar.
This strategy combines momentum (Williams %R), trend-following (MACD), and trend confirmation (SMA) to identify trading opportunities in the 1-minute timeframe. It is designed for short-term trading or scalping.

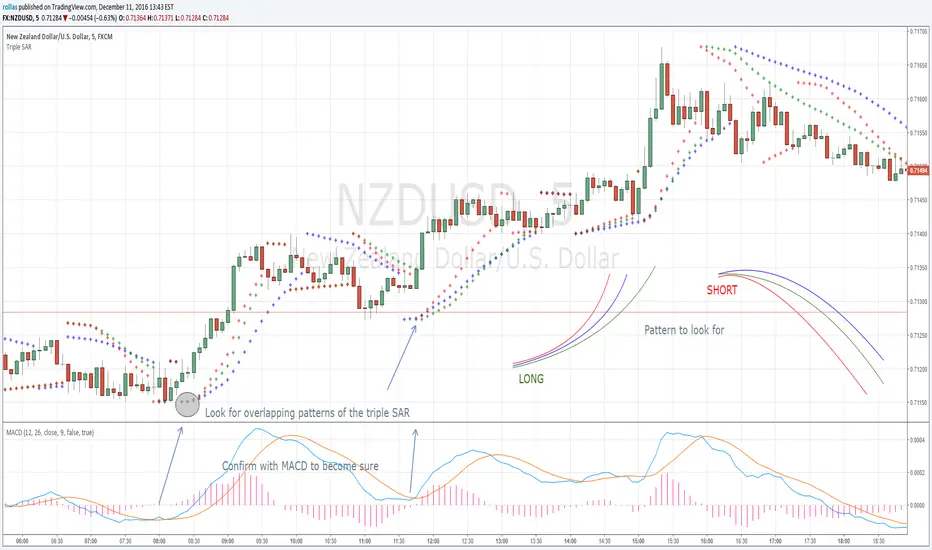
Triple SAR Scalping 5MTriple SAR scalping method must be used with a 5 minute chart. Look for the patterns that 3 bands overlap. Close deal within 4-5 pip profit or build your own style after getting comfortable with this technique and share your approach with us for maybe higher profits.
Scalping Trading System bot Crypto and StocksThis is a trend trading strategy scalping bot that can work with any type of market. However I concluded my tests so far with Crypto, Stocks and Forex, and with optimizations always could be found some profitable settings.
Indicators
SImple Moving Average
Exponential Moving Average
Keltner Channels
MACD Histogram
Stochastics
Rules for entry
long= Close of the candle bigger than both moving averages and close of the candle is between the top and bot levels from Keltner. At the same time the macd histogram is negative and stochastic is below 50.
short= Close of the candle smaller than both moving averages and close of the candle is between the top and bot levels from Keltner. At the same time the macd histogram is positive and stochastic is above 50.
Rules for exit
We exit when we meet an opposite reverse order.
This strategy has no risk management inside, so use it with caution !

Scalping The Bull - BTC Chart for Trend AnalysisName: BTC Chart for Trend Analysis
Category: Scalping, Trend Analysis .
Timeframe: 1M, 5M, 30M, 1D depending on the specific technique.
Technical Analysis: The indicator supports the operations of the trader named "Scalping The Bull" who uses BTC as an Index for Crypto trading.
Suggested usage: When trading on altcoins, to check whether or not they are trending with Bitcoin and whether those anticipate its movements.
It is therefore possible to see Bitcoin specifically if it makes red or green candles and how it is positioned with respect to the EMA 5, 10, 60, 223, however configurable from the panel.
Used in conjunction with Scalping The Bull Indicator or PRO Indicator, on the main panel.
Configuration:
EMA Length:
- EMA 1: by default 5, configurable
- EMA 2: by default 10, configurable
- EMA 3: by default 60, configurable
- EMA 4: by default 223, configurable
Colors can be modified from "Settings" > "Style"
Designed to be used with the following the indicator:

Scalping The Bull IndicatorName: Scalping The Bull Indicator
Category: Scalping, Trend Following, Mean Reversion.
Timeframe: 1M, 5M, 30M, 1D depending on the specific technique.
Technical Analysis: The indicator supports the operations of the trader named "Scalping The Bull" which uses price action and exponential moving averages.
Suggested usage: Altcoin showing strong trends for scalping and intra-day trades. Trigger points are used as entry and exit points and to be used to understand when a signal has more power.
It is possible to identify the following conformations:
Shimano: look at the price records of a consecutive series of closings between the EMA 60 and the EMA 223 when a certain threshold is reached. Use the trigger points as price structures to identify entry and exit zones (e.g. breakout of the yesterday high as for entry point) .
Bomb: look at the price registers a percentage variation in a single candle, greater than a threshold such as 2%, in particular on shorter timeframes and around the trigger points.
Viagra: look at there is a consecutive series of closes below the EMA 10.
Downward fake: look when, after a cross under (Death Cross), the price returns above the EMA 223 using the yesterday high as a trigger point.
Emergence: look at the EMA 60 is about to cross over the EMA 223.
Anti-crossing: look at, after an important price rise and a subsequent retracement, the EMA 60 is about to cross under the EMA 223 but a bullish impulse brings the price back above the EMAs.
For Sales: look at two types of situations: 1) when the price falls by more than 10% from the opening price and around the yesterday’s low or 2) when the price falls and then reaches, in the last 5 days, a bigger percentage and then breaks a trigger point.
Colour change: look at the opening price of the session - indicated as a trigger point.
Third touch of EMA 60: look for 3 touches below the EMA 60, and enter when there is a close above the EMA 60.
Third touch of EMA 223: look for 3 touches when there are 3 touches below the EMA 223, and enter when there is a close above the EMA 60.
Bud: look at price when it crosses upwards the average 10 and subsequently at least 2 "rest" candles are between the maximum and minimum of the breaking candle.
Fake on EMA 10: look for the open of a candle higher than the EMA 10, the minimum of the candle lower and the closing price returns above the EMA 10..
For Stop Loss and Profit Targets consider a proper R/R depending on Risk Management, using price structures such as the low of the entering candle and a quick Position Management moving quickly the Stop-Loss at Break-Even.
Configuration:
Market
EMA: The indicator automatically configure itself on market it knows (Binance, Piazza Affari and NASDAQ) otherwise it can be configured manually fo Crypto market (5/10/60/223) or Stock Market (5/10/50/200).
Additional Average: You can display an additional average, e.g. 20-period average.
Chart elements:
Session Separators: indicates the beginning of the current session (in blue)
Background: signals with the background in green an uptrend situation ( 60 > 223) and in red background a downtrend situation (60 < 223).
Trigger points:
Today's highs and lows: draw on the chart the opening price of the daily candle and the highs and lows of the day (high in purple, low in red and open in green)
Yesterday's highs and lows: draw on the chart the opening price of the daily candle, the highs and lows of the previous day (high in yellow, low in red).
Credits
Massimo : for refactoring and suggestions.

Scalping The BullNome: Scalping The Bull (Indicatore)
Categoria: Scalping, Trend Following, Mean Reversion.
Timeframe: 1M, 5M, 30M, 1D, secondo la conformazione specifica.
(follow description in english)
Analisi tecnica: l’indicatore supporta le operatività descritte nei video di YouTube del canale “Scalping The Bull”. Di norma si basa su price action e medie mobili esponenziali.
Le varie tecniche che possono essere usate insieme all’indicatore sono sintetizzate nei settaggi dell’indicatore e si può fare riferimento ai video specifici per la spiegazione completa.
Utilizzo consigliato: Altcoin che presentano forti trend per scalping e operazioni intra-day.
Configurazione: È possibile configurare lo strumento in maniera semplice e completa.
Medie:
Medie per mercato: e’ possibile utilizzare le medie mobili esponenziali (EMA) esclusivamente per il mercato Crypto (5/10/60/223).
Media addizionale: e’ possibile visualizzare una media aggiuntiva, e.g. a 20 periodi.
Elementi del grafico:
Sfondo: segnala con lo sfondo del grafico in verde una situazione di uptrend ( EMA 60 > EMA 223) e in rosso sfondo rosso una situazione di downtrend (EMA 60 < EMA 223).
Separatori di sessioni: indica l’inizio della sessione corrente.
Punti Trigger:
Massimi e minimi di oggi: disegna sul grafico il prezzo di apertura della candela daily e i massimi e i minimi di giornata.
Massimi minimi di ieri: disegna sul grafico il prezzo di apertura della candela daily, i massimi e i minimi del giorno prima.
(English description)
Name: Scalping The Bull (Indicator)
Category: Scalping, Trend Following, Mean Reversion.
Timeframe: 1M, 5M, 30M, 1D depending on the specific signal.
Technical Analysis: The indicator supports the operations described in the YouTube videos of the channel "Scalping The Bull". Usually it is based on price action and exponential moving averages.
The various techniques that can be used in conjunction with the indicator are summarized in the indicator settings and you can refer to the specific videos for the full explanation.
Suggested usage: Altcoin showing strong trends for scalping and intra-day trades.
Configuration:
Exponential Moving Averages
Per market: you can display averages exclusively for the Crypto market (5/10/60/223).
Additional Average: You can display an additional average, e.g. 20-period average.
Chart elements:
Session Separators: indicates the beginning of the current session.
Background: signals with the background in green an uptrend situation ( 60 > 223) and in red background a downtrend situation (60 < 223).
Trigger points:
Today's highs and lows: draw on the chart the opening price of the daily candle and the highs and lows of the day.
Yesterday's highs and lows: draw on the chart the opening price of the daily candle, the highs and lows of the previous day.

Scalping The Bull - Two EMA StrategyName: Scalping The Bull - Two EMA "Gianno-Nano" Strategy from the Meeting
Category: Trend Follower
Operating mode: Spot or Future, only long or swing trading
Trades duration: Multiday
Timeframe: 4H
Suggested usage: Mid-term trading, when the market is in trend and it is showing high volatility.
Entry: When fast EMA crosses over slow EMA.
Exit: When fast EMA crosses under slow EMA then Exit Long or Entry Short (for reversal strategy).
Usage:
⁃ It can be useful to use alerts or web-hooks to automate this strategy.
⁃ This is a raw system that can be improved in different ways (e.g. Stop-loss, take-profit, position sizing) or studying more the behaviour of the coin.
Configuration:
- N/A
Backtesting
⁃ Exchange: BINANCE
⁃ Pair: NEOUSDT
⁃ Timeframe: 4H
⁃ Fee 0.075%
⁃ Slippage 0
- Start : 2017-12-03
How you or we can improve? Source code is open so share your ideas!

Scalping IchimokuBased on the Ichimoku Cloud indicator, the Scalping Ichimoku is a strategy applied in a simple form.
How the strategy works?
The indicator will watch two filters from the Ichimoku Cloud indicator. The first one is when the price crosses the cloud (over or under). The second filter is when the conversion line crosses the baseline (over or under). When both filters happen, no matter the order or when the indicator will print an arrow signal.
Buy Signal
A buy signal, or arrow up, will appear when the price crosses over the cloud and when the conversion line crosses over the baseline.
Sell Signal
A sell signal, or arrow down, will appear when the price crosses under the cloud and the conversion line crosses under the baseline.
Exit Points
Show Exit Spots enabled. The indicator will print possible exit spots for the last entry, based on the cross from conversion with baseline. In case the cross is against the latest entry signal, it will show an "X"
One Signal At Time
The indicator will print only one signal in a single direction. It will never print the same signal as the last signal
Exit and Entry Spot At The Same Candle
In the chart, when the entry spot and an exit spot appear in the same candle, the exit spot will appear with a different color. This means that the entry spot is more accurate.
This strategy was designed for scalping, no matter the time frame or market, but it may work for swing traders as well.

Scalping using RSI 2 indicator with TSLThis strategy implements a simply scalping using the RSI (calculated on two periods), the slopes of two MAs ( EMA or SMA ) having different lengths (by default, I use 50 and 200).
A trailing stop loss (%) is used.
Entry conditions:
.) Fast MA > Slow MA and Price > Slow MA and RSI < Oversold Threshold ------> go Long
.) Fast MA < Slow MA and Price < Slow MA and RSI > Overbought Threshold ------> go Short
Exit conditions:
.) Long entry condition is true and (close >= TP or close <= TSL ) ----> close short position
.) Short entry condition is true and (close <= TP or close >= TSL ) ----> close long position
The strategy performed best on Bitcoin and the most liquid and capitalized Altcoins but works excellent on volatile assets, mainly if they often go trending.
Works best on 3h - 4h time frame.
There's also an optional Volatility filter, which opens the position only if the difference between the two slopes is more than a specific value, which can be set in the study inputs. The purpose is not opening positions if the price goes sideways and the noise is way > than the signal.
Note:
.) the RSI length is 2;
.) the oversold Threshold is 90%;
.) the overbought Threshold is 10%;
.) by default, the trailing stop loss per cent is 1%;
.) by default, the fast MA length is 50;
.) by default, the slow MA length is 200;
.) by default, the MA used is EMA.
Cheers.
