Scalping, Swing Pro: Urban Towers + Bollinger(0.5)+ WMA by KidevThis indicator combines narrow Bollinger Bands (σ = 0.5) with a Weighted Moving Average (WMA-96) to provide traders with a reliable framework for identifying both short-term scalps and medium-term swing setups.
Bollinger Bands (0.5σ):
Traditional Bollinger Bands at 2σ cover ~95% of price movement, while 0.5σ bands narrow the focus to ~50% of price activity. This tighter structure makes them ideal for detecting volatility contractions, consolidations, and early breakout signals.
WMA-96 as Trend Reference:
The 96-period WMA acts as a slower, more stable directional guide. Unlike shorter WMAs, this longer setting filters noise and serves as a reference line for the dominant trend. Traders can use it as an anchor for intraday or swing positions.
Scalping & Swing Benefits:
Price holding above the WMA-96 while staying near the upper 0.5σ band often signals strength.
Contractions (squeezes) in the 0.5σ band followed by expansion frequently mark breakout zones.
Pullbacks toward the WMA-96 combined with band signals can act as re-entry or risk-defined trade areas.
This script provides a balanced view of momentum and stability — the 0.5σ bands reveal short-term volatility shifts, while the WMA-96 grounds the trader in the prevailing trend.
在脚本中搜索"scalping"

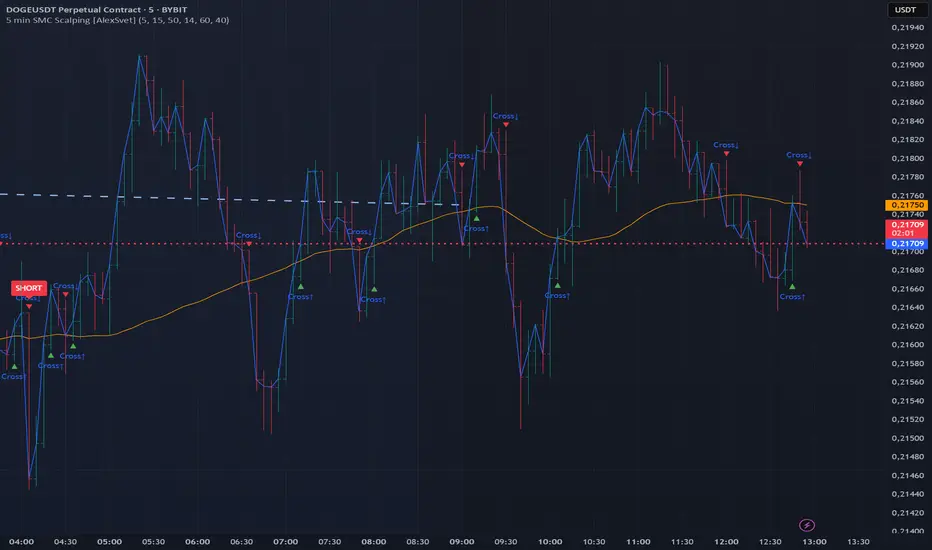
5 min SMC Scalping [AlexSvet]Scalping for 5 minute chart.
SMC based signals.
Light and clear indicator.
Scalping Indicator v6This Script Show You Recent Scalping Trades u can get instantly we have use the knowledge we gain across the time we might be right or wrong do your own research and use this indicator on ur own risk

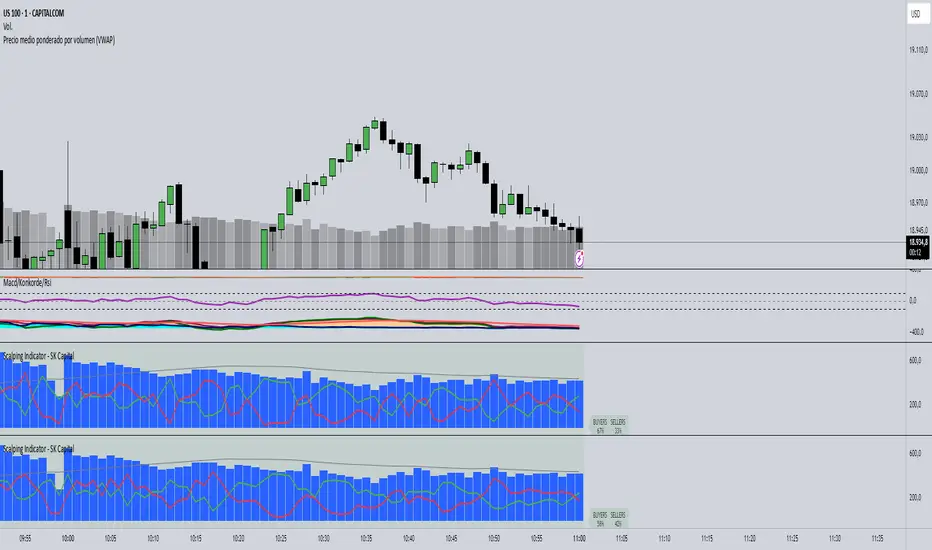
Scalping Indicator - SK CapitalThe Scalping Indicator - SK Capital is a professional-grade tool designed to empower intraday traders with real-time volume sentiment analysis and trend confirmation. Built on Pine Script v6, this indicator combines essential elements of technical trading—such as VWAP/EMA crossovers and volume decomposition—into one streamlined visualization.
Key Features:
Buyers vs. Sellers Visualization: Accurately estimates and displays the percentage of buying and selling volume within each candle. These are plotted with color-coded lines (green for buyers, red for sellers) and highlighted with a fixed summary label at the top for instant comparison.
Dynamic Sentiment Label: A prominent label at the top of the chart dynamically updates with the percentage of buyers and sellers per bar. The label’s background color shifts to green or red based on volume dominance and stays neutral when balanced, providing instant visual feedback.
Volume Histogram with Average Overlay: The total volume is represented by blue histogram bars, while a gray SMA line tracks the 50-period average volume to contextualize current activity.
Customizable Settings: Input fields allow traders to adjust the smoothing period for volume analysis, the EMA crossover length, and label font size for visual clarity.
This indicator is ideal for scalpers and short-term traders who rely on swift, data-driven decisions based on volume dynamics and trend signals. Whether you're analyzing one-minute candles or broader intraday timeframes, this script provides critical context in a compact, intuitive layout.
Scalping Strategy (5min)This indicator is designed for scalping strategies on a 5-minute timeframe. It generates signals based on two RSI crossovers and incorporates moving averages to identify trends. Additionally, a Bollinger Band is included to eliminate the need for an additional Bollinger Band on the chart.
Please note that this indicator does not guarantee 100% accurate signals and may produce false signals. It is recommended to use this indicator in conjunction with other indicators such as Stochastic, MACD, SuperTrend, or any other suitable indicators to enhance the accuracy of trading decisions.
1) Signal Generation: The indicator generates buy and sell signals based on two RSI crossovers. A buy signal is generated when the fast RSI crosses above the slow RSI, indicating potential bullish momentum. Conversely, a sell signal is generated when the fast RSI crosses below the slow RSI, suggesting potential bearish momentum.
2) To adjust the indicator to your specific chart and trading preferences, you have the flexibility to modify the RSI and moving average (MA) values. By changing the RSI values (slow RSI length and fast RSI length), you can fine-tune the sensitivity of the RSI crossovers to suit different timeframes and market conditions. Similarly, adjusting the MA values (slow MA period and fast MA period) allows you to adapt the indicator to the desired trend identification and short-term trend confirmation.
3) Pay attention to trades that are confirmed by the short-term moving average (MA) aligning with the desired direction. For buy signals, ensure that the short MA is tending upward, indicating a potential uptrend. For sell signals, confirm that the short MA is trending downward, suggesting a potential downtrend.
4) Moving Averages: The indicator uses a 200-period moving average (MA) to identify the overall trend and a short-term MA for additional confirmation.
5) Bollinger Band: The included Bollinger Band is not directly used in the indicator's calculations. However, it is provided for convenience so that users don't need to add another Bollinger Band to their chart separately.
6) Exercise caution when the short MA is below the 200-period MA but showing signs of attempting an upward move. These situations may indicate a potential reversal or consolidation, and it is advisable to avoid taking trades solely based on the 200-period MA crossover in such cases.
Remember that these guidelines are intended to provide additional insights and should be used in combination with your trading judgment and analysis.

scalping with market facilitationThis strategy is for scalping low timeframes for 10 pips. I have yet to see a strategy with this unique combo of indicators.
First we have volume indicator market facilitation, where we are looking for volume and mfi to be up, then we want the adx 5 to be above level 30 and above its ema period 3, then if these conditions are good we take shorts when ema 8 is below ema 100 and longs when ema8 is above ema 100 with parabolic sar in its propet place, also to verify trend we have obv over or under its ema of 55 and macd line over its signal line.
I have heikenashi bars on with the regular priceline showing so j see actual price levels, when i get a buy signal i set a buystop above the high of that bar and have a stoploss of 7.5 pips and a take profit of 10 pips, reverse for sells, i have to use metatrader to trade so i use this as my signals to trade.
Note this is not advice trade at your own risk no guarantees in anything in life, but i wanted to share this for it is helping me with my trades to be more strict and semi mechanical. I use it for forex time frames 1 3 5 15 mjn

Scalping Trading System bot Crypto and StocksThis is a trend trading strategy scalping bot that can work with any type of market. However I concluded my tests so far with Crypto, Stocks and Forex, and with optimizations always could be found some profitable settings.
Indicators
SImple Moving Average
Exponential Moving Average
Keltner Channels
MACD Histogram
Stochastics
Rules for entry
long= Close of the candle bigger than both moving averages and close of the candle is between the top and bot levels from Keltner. At the same time the macd histogram is negative and stochastic is below 50.
short= Close of the candle smaller than both moving averages and close of the candle is between the top and bot levels from Keltner. At the same time the macd histogram is positive and stochastic is above 50.
Rules for exit
We exit when we meet an opposite reverse order.
This strategy has no risk management inside, so use it with caution !

scalping against trapped countertrendAbstract
This script attempts to find the end of countertrend.
This script uses oscillators to measure long term and short period trends. When the long term trend keeps positive and clear short term period is over, this script provides a buy signal.
This script does not contain pullback, cut loss and re-enter. You need to add it manually.
Introduction
Many traders want to buy when long term trend is bullish and short term pullback is over.
This is because we can take advantage to the emotion of countertrend traders.
Countertrend traders realizes their profit is finite and therefore want to protect their profit well and limit their loss.
This script is inspired by a searchable trading strategy video.
The video mentioned 4 points.
(1) long term trend. The video did not spend much ink on this point. You can use any method to observe.
(2) clear pullback bar (at least 50% body)
(3) weak bar after clear pullback
(4) entry trigger buy stop
This script attempts to quantize these points to determine trading direction.
This script is originally designed for timeframes lower than examples in the video but you can apply it on any timeframe.
Computing and Adjusting
(1) long term trend
This script uses smoothed stochastic.
(2) clear pullback bar
Since this script is originally designed for timeframes lower than examples in the video, so the condition becomes:
RSI is low enough
(3) weak bar after clear pullback
RSI goes back from low level.
(4) entry trigger buy stop
This script does not include this condition.
You can decide enter when buy stop or pullback.
Parameters
x_src : the value for computing oscillators
x_len_a : how many bars for measuring short term trend
x_len_b : how many bars for measuring long term trend
x_k_b : smooth long term trend, the average value of stochastic values
x_changk = check if clear short term pullback appears recently. 1 means do not use, larger numbers means how long of periods to check.
x_rsi_ct : threshold of short term pullback clear
x_rsi_ft : threshold of short term pullback end
Reading numbers in Strategy Tester
Most possible loss :
(1) to find rational pullback. Generally 1/3 to 2/3 atr.
(2) to find cut loss distance. Generally 1 to 2 atr.
Most possible profit :
to find if trading the opposite direction against this script is profitable.
Conclusion
This script can suggest us trading direction.
Waiting for pullback can reduce risk, compared to buy stop.
This script does not provide good signals in sideways markets.
Reference
A searchable trading strategy video

scalping low lag tema etalCredit for original idea goes to 1 min forex scalping by mikegoryunov
Changes include several lower lag filters (See line 3 for a list)
and values for profit, loss, and trail_points (See lines 48:53)
a, b, & c represent fast, medium, and slow filters. Basic idea is to monitor
crossovers of the three filters to determine buy/sells. Exits occur quickly within
the next time interval.
Note that this may be used for stocks and forex. The time interval can vary widely.
I have concerns about how to incorporate transaction costs with so many transactions.

Scalping Line Indicator"A derivated indicator of the stair step moving average exploration. This time, the stairstep MA (the main trend) represent the center of the oscillator.
The signal line (maroon line) is the difference between this center and a simple moving average of 7 periods by default.
Trade signals seems pretty effective on tick charts representation. Take long when signal line cross above zero and short below it. Of course, as always objectives and stoploss protection are your responsabilities
You can play with different parameters to sweet any other instruments."
Coded referring the"Scalping Line Indicator" from prorealcode for Tradingview users after one of my followers asked me to do so.

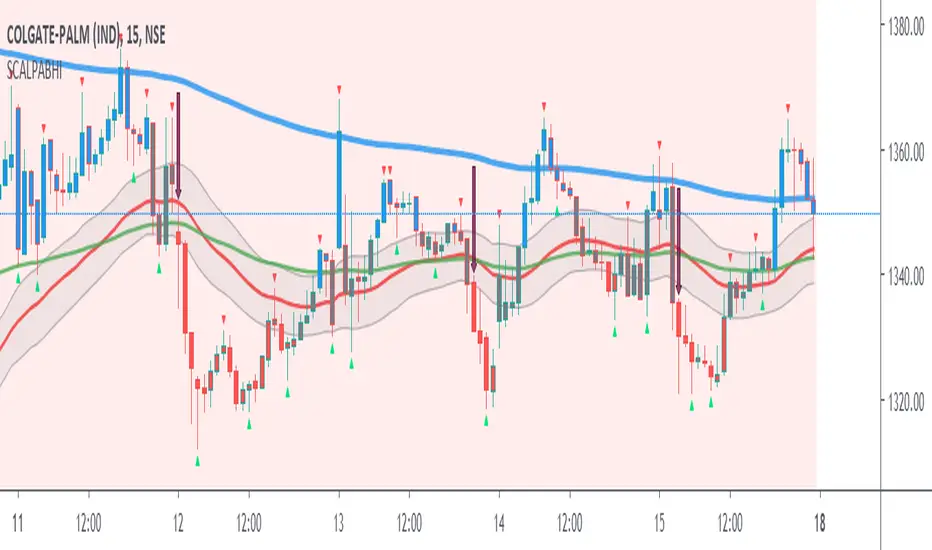
Scalping PullBack by AbhiSetup and hints:
When price is above the PAC(blue bars) we are only looking to buy as price comes back to the PAC, when price is below the PAC(red bars), we are only looking to sell when price comes back to the PAC
What we’re looking for when price comes back into the PAC we draw mini Trendlines (TL) utilising the Fractals and HH/LL points to guide your TL drawing.
Now look for the trend to pull back and break the drawn mini TL. That's is where we can place the scalp trade.
So we are looking for continuation signals in terms of a strong, momentum driven pullbacks of the PAC EMA(34).
The other EMAs are there to check for other Pullbacks when PAC EMA (34) is broken.
Other than the "SweetSpot Gold RN" indicator, you should not need any other indicator to scalp for pullbacks.
If you want to trade shallower Pullbacks for quicker scalps, try reducing the PAC and EMA combination lengths for example:
- 21 PAC and 55, 144, 377 for fast, medium, slow EMAs
- 13 PAC and 34, 89, 233 for fast, medium, slow EMAs
Each alert should be evaluated on it's own merits, the alerts are designed to highlight possible scalping trades from Pullback recoveries around the PAC.
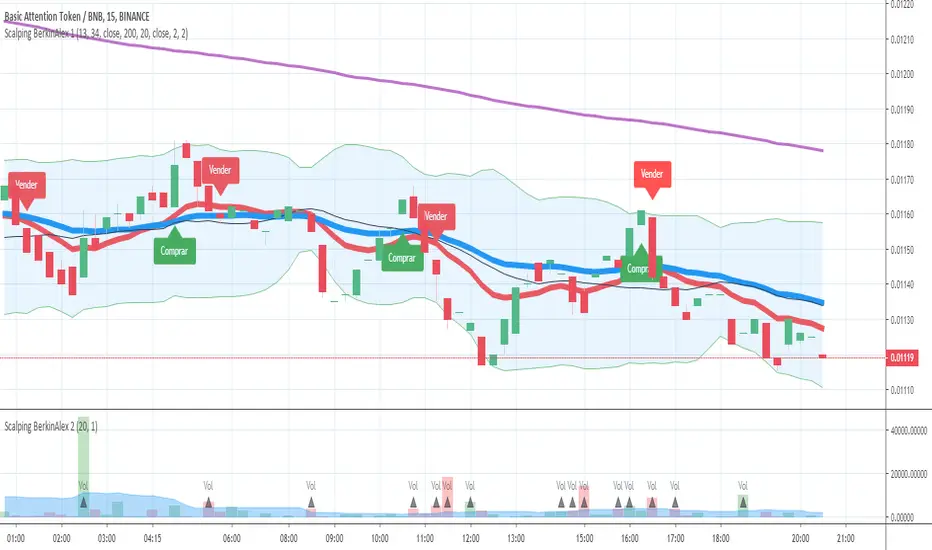
Scalping BerkinAlex 2
--------Inglés---------
Updated to Pine Script v4.
Errors found fixed.
---------Español---------
Actualizado a Pine Script v4.
Errores encontrados solucionados.

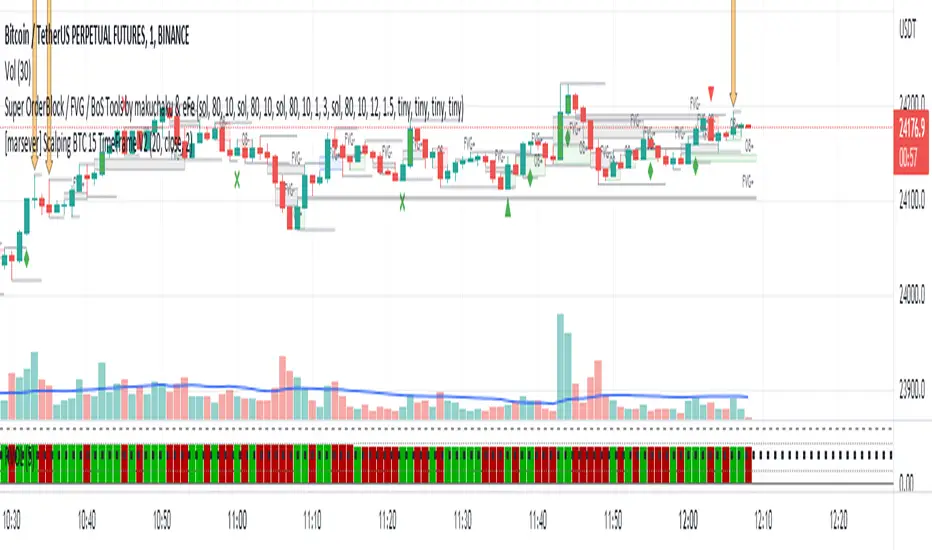
Scalping BTC 15 TimeFrameGreen arrow = enter LONG
Orange arrow = enter SHORT
LONG = SL under LOW of candle marked with GREEN arrow
SHORT = SL upon HIGH of candle marked with ORANGE arrow


Scalping Basics, Indicator v8Update to:
1) Added toggle to show/hide historical lines
2) Extended lines to increase visibility
3) Fixed bug that caused aftermarket/premarket values to sometimes display incorrectly

Scalping Basics, Indicator v8update to:
1) added toggle to show/hide historical lines
2) extended lines to increase visibility
3) fixed bug that caused aftermarket/premarket values to sometimes display incorrectly

