Koncorde Crossing Screener (UP/DOWN) AlertThis indicators works on Koncorde Crossing Pattern, generating alerts when Cross is Up (buy) and Down (sell).
在脚本中搜索"screener"

Premarket Gapper Swing Filter (Long) – v6here’s a plug-and-play Pine Script v5 “screener” you can drop on any chart to flag pre-market gainers that also meet swing-friendly trend/liquidity filters. It works as a chart-level scanner (since Pine can’t screen the whole market by itself): add it to a watchlist; symbols that qualify will light up and you can set alerts to ping you right at the opening bell.

Weekly Breakout Screenermencari harga saham yang kuat breakout harga mingguan. potensi swing trading

No Supply (Low-Volume Down Bars) — IdoThis indicator flags classic Wyckoff/VSA “No Supply (NS)” events—down bars that print on unusually low volume, suggesting a lack of sellers rather than strong selling pressure. NS often appears near support, LPS, or within re-accumulation ranges as a test before continuation higher.
Signal definition (configurable):
Down bar: choose Close < PrevClose or Close < Open.
Low volume: Volume < SMA(Volume, len) × threshold (e.g., 0.7).
Optional volume lower than the prior two bars (reduces noise).
Optional narrow spread: range (H–L) below its average.
Optional close position: close in the upper half of the bar.
Optional trend filter: only mark NS above or below an EMA (or any).
Optional wide-bar exclusion: skip unusually wide bars.
Visuals & outputs
Blue dot below each NS bar (optional bar tint).
Separate pane showing Relative Volume (vol / volSMA) to gauge effort.
Built-in alertcondition to trigger notifications when NS prints.
Inputs (high level)
lenVol: Volume SMA length.
ratioVol: Volume threshold vs. average (e.g., 0.7 = 70%).
usePrev2: Require volume below each of the prior two bars.
useNarrow + lenRange + ratioRange: Narrow-bar filter.
useClosePos + minClosePos: Close in upper portion of the bar.
downBarMode: Define “down bar” logic.
trendFiltOn, trendLen, trendSide: EMA trend filter.
useWideFilter, lenRangeWide, wideThreshold: Skip wide bars.
How to use (Wyckoff/VSA context)
Treat NS as a test of supply: price dips, but volume is light and close holds up.
Stronger when it prints near support/LPS within a re-accumulation structure.
Confirmation (recommended): within 1–3 bars, see demand—e.g., break above the NS high with expanding volume (above average or above the prior two bars). Many traders place a buy-stop just above the NS high; common stops are below the NS low or the most recent swing low.
Scanning tip
TradingView’s stock screener can’t consume Pine directly.
Use a Watchlist Custom Column that reports “bars since NS” to sort symbols (0 = NS on the latest bar). A companion column script is provided separately.
Notes & limitations
Works on any timeframe (intraday/daily/weekly), but context matters.
Expect false positives around news, gaps, or illiquid symbols—combine with structure (trend, S/R, phases) and risk management.
© moshel — Educational use only; not financial advice.

LBR Oscillator with Signals & AlertsLinda Bradford Raschke MacD indicator. Has alerts and can be used in the pine screener on different timeframes.

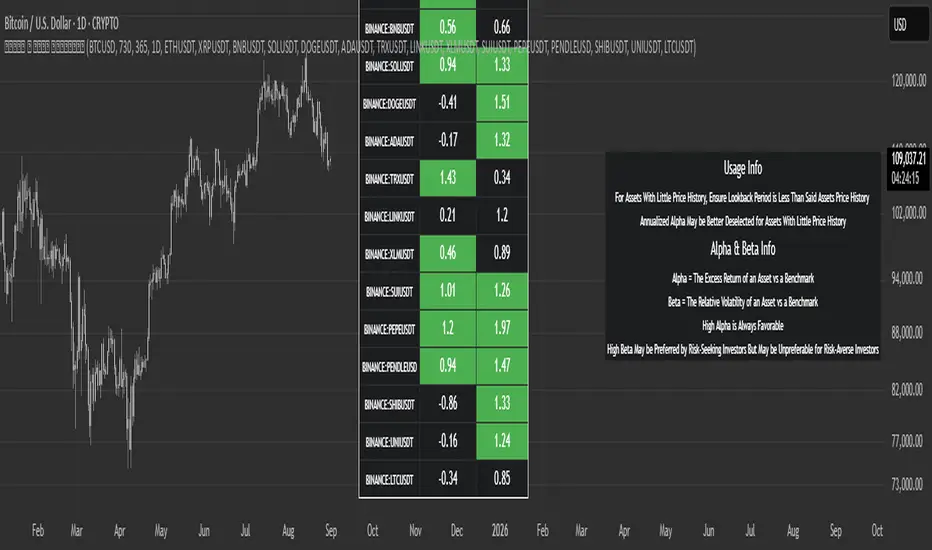
Crypto Early Momentum — Screener v6 (robust)Screens Crypto Pairs for momentum and assigns a momentum score.

BNF 25/50 MA Pullback Screener (Uptrend-Below / Downtrend-Above)Buy candidates: stocks in an uptrend (25MA > 50MA, optional rising slopes) that are currently pulled back below the MAs.
• Sell/short candidates: stocks in a downtrend (25MA < 50MA, optional falling slopes) that are currently pushed above the MAs.
It plots the MAs, paints the background for trend context, drops signals on the chart, shows a status panel, and exposes alert conditions so you can screen your watchlist via alerts.

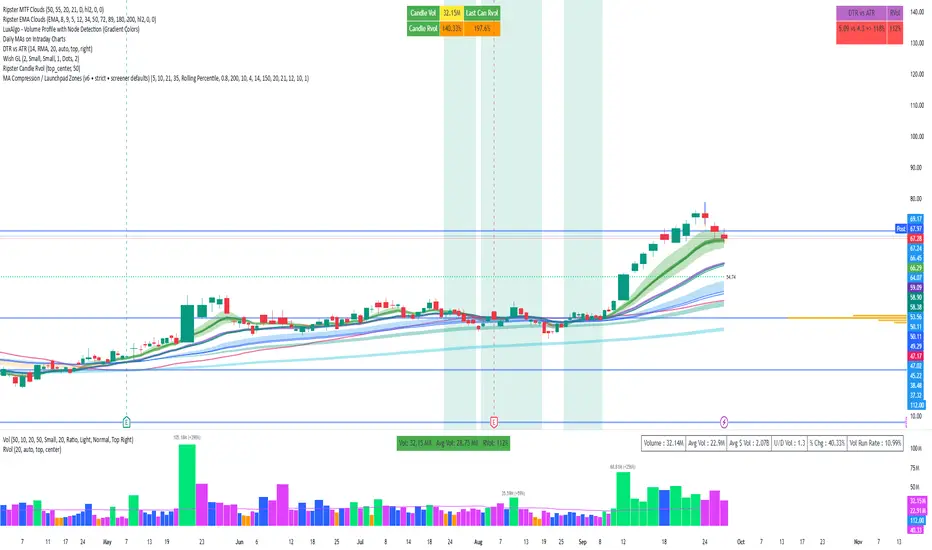
MA Compression / Launchpad Zones v6MA Compression / Launchpad Zones (v6 • strict • screener defaults)
Scenario Screener — Consolidation → Bullish SetupThe script combines multiple indicators to filter out false signals and only highlight strong conditions:
Consolidation Check
Uses ATR % of price → filters out stocks in tight ranges.
Uses Choppiness Index → confirms sideways/non-trending behavior.
Momentum Shift (Bullish Bias)
MACD Histogram > 0 → bullish momentum starting.
RSI between 55–70 → strength without being overbought.
Stochastic %K & %D > 70 → confirms strong momentum.
Volume & Accumulation
Chaikin Money Flow (CMF > 0) → buying pressure.
Chaikin Oscillator > 0 (debug only) → accumulation phase.
Trend Direction
+DI > -DI (from DMI) → buyers stronger than sellers.
ADX between 18–40 → healthy trend strength (not too weak, not overheated).
Breakout Filter (Optional)
If enabled, requires price to cross above 20 SMA before signal confirmation.
📈 Outputs
✅ Green label (“MATCH”) below the bar when all bullish conditions align.
✅ Background highlight (light green) when signal appears.
✅ Info Table (top-right) summarizing key values:
Signal = True/False
MACD, CMF, Chaikin values

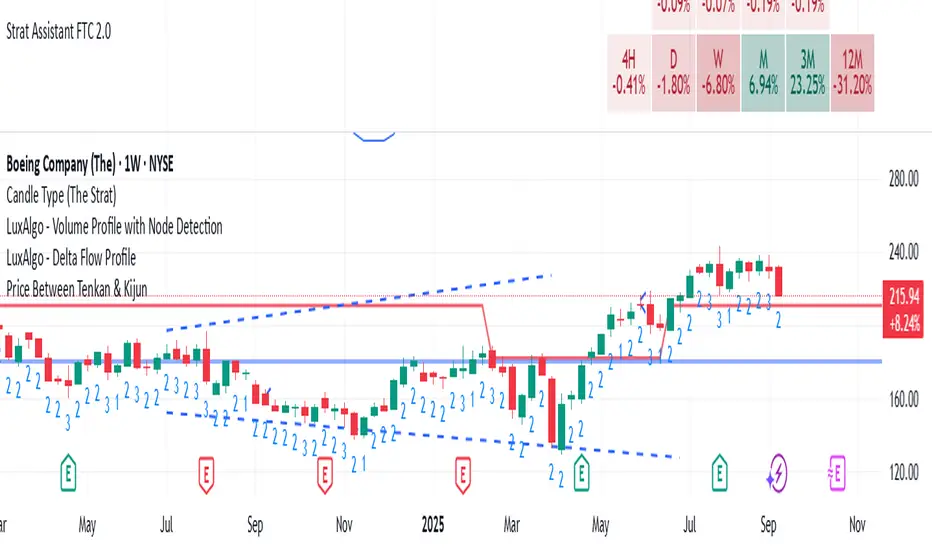
Price Between Tenkan & KijunThis is to find stocks that either breaking up or down from a large screener list
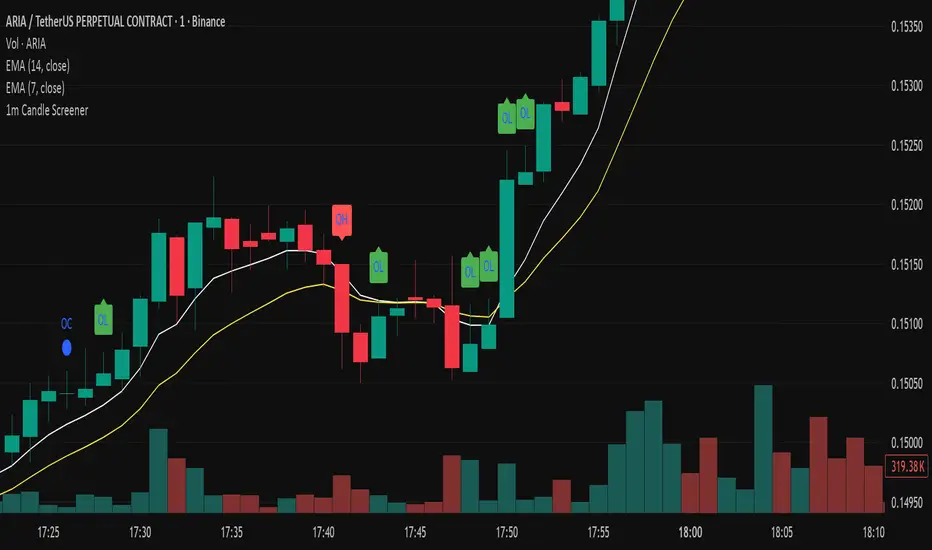
Precision Candle Marker – OL/OH/OC ScreenerThis indicator highlights high-probability precision candles on any perpetual contract, designed especially for scalpers and short-term traders.
It marks three unique candle setups on the 1-minute chart (works on other timeframes too):
🟢 Open = Low (OL) → Strong bullish momentum, buyers took control instantly.
🔴 Open = High (OH) → Strong bearish momentum, sellers took control instantly.
🔵 Open = Close (OC) → Doji / indecision candle, potential reversal or continuation signal.
Use cases:
Identify breakout entry points in uptrend/downtrend.
Filter noise and focus on precision candles.
Combine with trend indicators (EMA, VWAP, RSI) for confirmation.
This tool is best suited for scalping perpetual contracts (e.g., BTCUSDT, ETHUSDT) but works on any symbol and timeframe.
MA20 & MA50 RisingMA20 & MA50 Rising Scanner
Detects when both the 20-period and 50-period simple moving averages turn upward on the most recent bar. Designed as a lightweight screener column for TradingView’s watchlists.
Overview
This indicator plots a binary flag (0 or 1) per symbol, where
- 1 means SMA(20) > SMA(20) and SMA(50) > SMA(50)
- 0 means one or both moving averages did not rise
Add it as a custom column in your watchlist to instantly surface stocks with both short- and medium-term trend acceleration.
How It Works
- Calculates ma20 = simple moving average of the last 20 closes
- Calculates ma50 = simple moving average of the last 50 closes
- Compares each with its prior value (ma20 and ma50 )
- Sets flag to 1 only when both are higher than yesterday’s values
When you filter your watchlist for flag == 1, you see only symbols whose 20- and 50-period SMAs both rose on the latest bar.

Strat Failed 2-Up/2-Down Scanner v2**Strat Failed 2-Up/2-Down Scanner**
The Strat Failed 2-Up/2-Down Scanner is designed for traders using The Strat methodology, developed by Rob Smith, to identify key reversal patterns in any market and timeframe. This indicator detects two specific candlestick patterns: Failed 2-Up (bearish) and Failed 2-Down (bullish), which signal potential reversals when a directional move fails to follow through.
**What It Does**
- **Failed 2-Up**: Identifies a bearish candle where the low and high are higher than the previous candle’s low and high, but the close is below the open, indicating a failed attempt to continue an uptrend. These are marked with a red candlestick, a red downward triangle above the bar, and a table entry.
- **Failed 2-Down**: Identifies a bullish candle where the high and low are lower than the previous candle’s high and low, but the close is above the open, signaling a failed downtrend. These are marked with a green candlestick, a green upward triangle below the bar, and a table entry.
- A table in the top-right corner displays the signal type ("Failed 2-Up" or "Failed 2-Down") and the ticker symbol for quick reference.
- Alerts are provided for both patterns, making the indicator compatible with TradingView’s screener for automated scanning.
**How It Works**
The indicator analyzes each candlestick’s high, low, and close relative to the previous candle:
- Failed 2-Up: `low > low `, `high > high `, `close < open`.
- Failed 2-Down: `high < high `, `low < low `, `close > open`.
When these conditions are met, the indicator applies visual markers (colored bars and triangles) and updates the signal table. Alert conditions trigger notifications for integration with TradingView’s alert system.
**How to Use**
1. Apply the indicator to any chart (stocks, forex, crypto, etc.) on any timeframe (e.g., 1-minute, hourly, daily).
2. Monitor the chart for red (Failed 2-Up) or green (Failed 2-Down) candlesticks with corresponding triangles.
3. Check the top-right table for the latest signal and ticker.
4. Set alerts by selecting “Failed 2-Up Detected” or “Failed 2-Down Detected” in TradingView’s alert menu to receive notifications (e.g., via email or app).
5. Use the signals to identify potential reversal setups in conjunction with other Strat-based analysis, such as swing levels or time-based strategies.
**Originality**
Unlike other Strat indicators that may focus on swing levels or complex candlestick combinations, this scanner specifically targets Failed 2-Up and Failed 2-Down patterns with clear, minimalist visualizations (bars, triangles, table) and robust alert functionality. Its simplicity makes it accessible for both novice and experienced traders using The Strat methodology.
**Ideal For**
Day traders, swing traders, and scalpers looking to capitalize on reversal signals in trending or ranging markets. The indicator is versatile for any asset class and timeframe, enhancing trade decision-making with The Strat’s pattern-based approach.

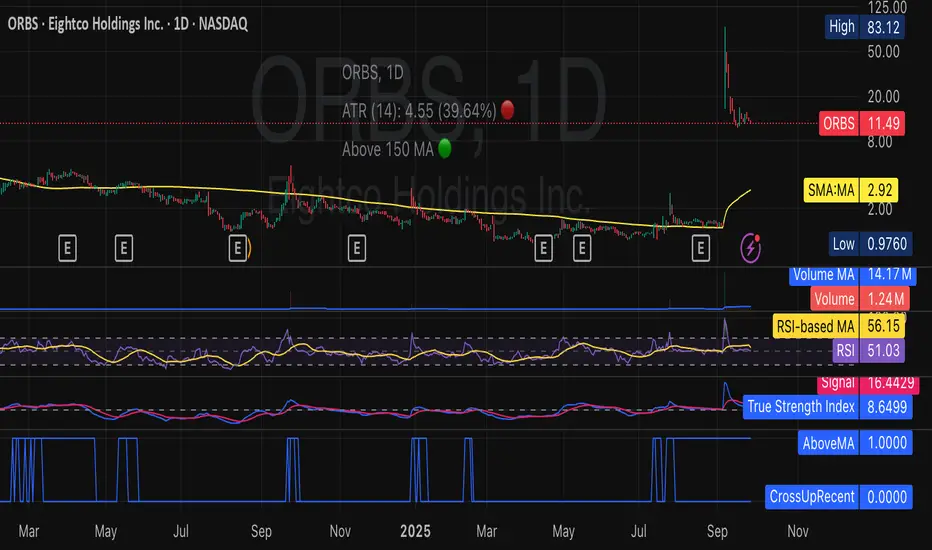
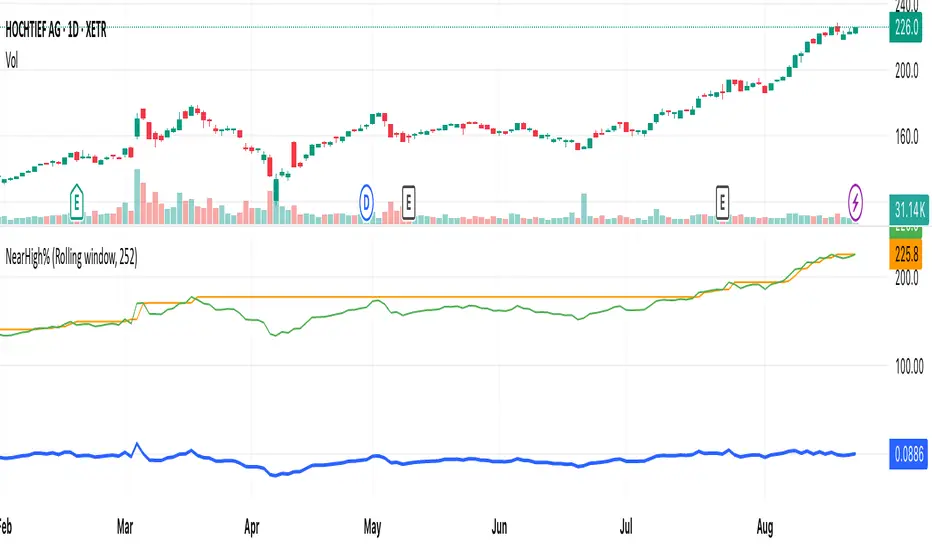
Near New High ScreenerA simple indicator intended to be used in a pinescript scanner to find stocks that are re reaching highs after a pullback or base formation. To use add it as a favourite indicator so it can be selected in a pinescript scanner.
In the settings you can select whether to use the highest high or highest close for the previous high (defaults to close) and whether to use the all time high or the high from the last X days (defaults to 252 days).
Once opened in a pine scanner apply to a watchlist and scan. Stocks with a positive % have broken out from a previous high today, those with a negative % are that % away from the previous high.
You can sort by the “Pct from Prev High%” column or use the scanner filter to filter for stocks between two values, for example between 0 and -5% to find stocks near a new high, or >0 to find stocks that have broken out today.
Reversal Radars — Berk v2.0 (Bottom & Top)1) Combined script (Dip+Tepe)
Title:
Reversal Radars — Berk v2.0 (Bottom & Top)
Description (EN):
What it does
Two high-probability reversal detectors in one indicator: a Bottom Reversal Radar (long bias) and a Top Reversal Radar (short/hedge bias). Each radar aggregates multiple conditions into a single score and triggers when Score ≥ Threshold.
How it works
RSI regime shift: Bottom = recovery after oversold (touched 30, crosses up 35). Top = roll-over from overbought (touched 70, crosses down 65).
MACD cross: Bull (up) for bottoms, Bear (down) for tops.
EMA8 filter: Close above (bottom) / below (top) EMA(8).
Structure break (BOS): Close above recent swing high / below recent swing low (lookbackBars, using precomputed highest/lowest to avoid inconsistencies).
EMA200 proximity: Price within a configurable band (default −5% … +2%).
Volume expansion: Volume ≥ SMA(20) × multiplier (default 1.5×).
Divergence: Pivot-confirmed (3/3) bullish (bottom) or bearish (top) RSI divergence.
Scoring: RSI shift +2, divergence +2, MACD +1, EMA8 +1, BOS +1, Volume +1, EMA200 band +1.
Signals & Alerts
Bottom: label “DÖNÜŞ↑” and alert “Dipten Dönüş — Ana Sinyal” when scoreLong ≥ thrLong.
Top: label “DÖNÜŞ↓” and alert “Tepeden Dönüş — Ana Sinyal” when scoreShort ≥ thrShort.
Use Once per bar close for stable alerts.
Inputs
lenRSI, rsiOS=30, rsiRecover=35, rsiOB=70, rsiFall=65, volLen=20, volMult=1.5, lookbackBars=5, ema200 band (−5…+2%), thrLong/thrShort, toggles for Bottom/Top.
Timeframes & tips
Best on Daily/4H. Tighten thresholds (e.g., 4) and raise volume multiplier (1.8–2.0×) on lower TFs or thin liquidity.
No-repaint note
Evaluated on bar close; pivot divergences confirm with a natural ~3-bar delay.
Disclaimer
Educational use only. Not financial advice.
Tags: reversal, divergence, rsi, macd, ema, volume, trend, screener, stocks, crypto, bist
2) Bottom-only (Dip)
Title:
Bottom Reversal Radar — Berk v1.4
Description (EN):
Purpose
Scores bottoming conditions and triggers when Score ≥ Threshold (default 3).
Components
RSI recovery after oversold (30→35), MACD bull cross, close above EMA8, BOS above recent swing high, near-EMA200 band (−5…+2%), volume ≥ SMA(20)×1.5, and pivot-confirmed (3/3) bullish RSI divergence. Weights: RSI +2, Divergence +2, others +1.
Usage
Add to chart, set alert “Dipten Dönüş — Ana Sinyal”, Once per bar close. Works on any timeframe (need ≥200 bars for EMA200). Daily/4H recommended.
No-repaint
Bar-close evaluation; divergence confirms with ~3 bars.
Tags: bottom, reversal, rsi, macd, ema, volume, divergence
3) Top-only (Tepe)
Title:
Top Reversal Radar — Berk v1.0
Description (EN):
Purpose
Detects topping risk and triggers when Score ≥ Threshold (default 3) for exits/hedges.
Components
RSI roll-over from overbought (70→65), MACD bear cross, close below EMA8, BOS below recent swing low, near-EMA200 band, volume ≥ SMA(20)×1.5, and pivot-confirmed (3/3) bearish RSI divergence. Weights: RSI +2, Divergence +2, others +1.
Usage
Add to chart, set alert “Tepeden Dönüş — Ana Sinyal”, Once per bar close. Daily/4H preferred; tighten thresholds on lower TFs.
No-repaint
Bar-close evaluation; divergence confirms with ~3 bars.
Tags: top, reversal, rsi, macd, ema, volume, divergence


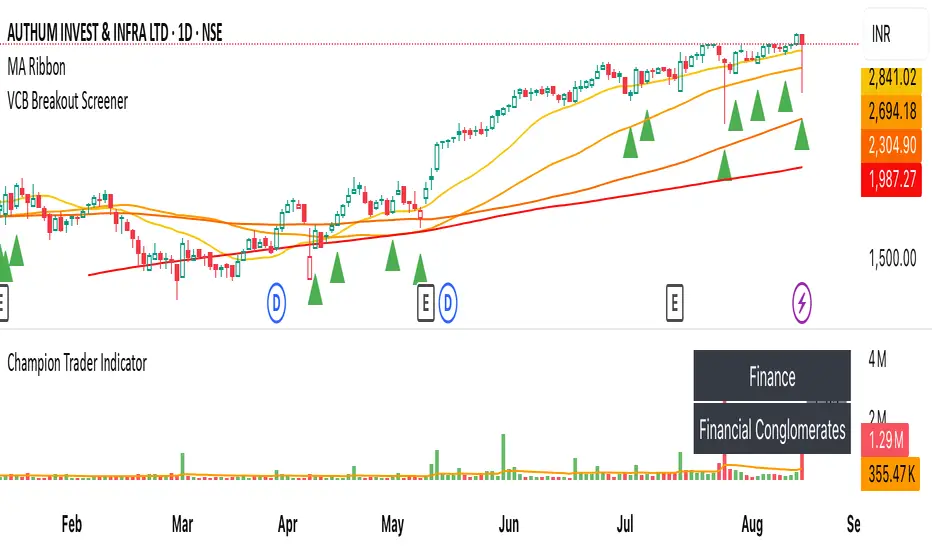
VCB Breakout Screener -PrajaktVCP Breakout Scanner
🔹 How it works
✅ Checks liquidity (vol * price > 100Cr).
✅ Ensures price > SMA50 and SMA100 or SMA200.
✅ ATR filter (short-term > 85% of longer-term).
✅ Price near 40–70% range of the candle.
✅ PGO (close vs SMA/ATR) < 2.5.
✅ RSI(7) < 60.
✅ Plots a green triangle below candles that qualify.
✅ You can set alerts with VCB Breakout condition met!.
Confluence HunterUnlock powerful trade setups with our custom BBWP + RSI Oversold Screener!
This indicator combines Bollinger Band Width Percentile (BBWP) to detect periods of extreme low volatility with RSI oversold signals, helping you pinpoint high-probability breakout opportunities before they happen. When the market’s energy is compressed and price is sitting in oversold territory, it often signals a sharp move is coming—this tool lets you spot those moments instantly. Perfect for swing traders and crypto scalpers who want to catch explosive moves early, it’s your edge in spotting volatility squeezes before the crowd.

EMA Cross Approach ScreenerWorks best on D/4H. Signals when the price of a stock is below the 200ema and the 9 and 20 are sloping up approaching the 200 while being 5% or less than from the 200. Helps the trader find a good buying point while keeping risk minimum.

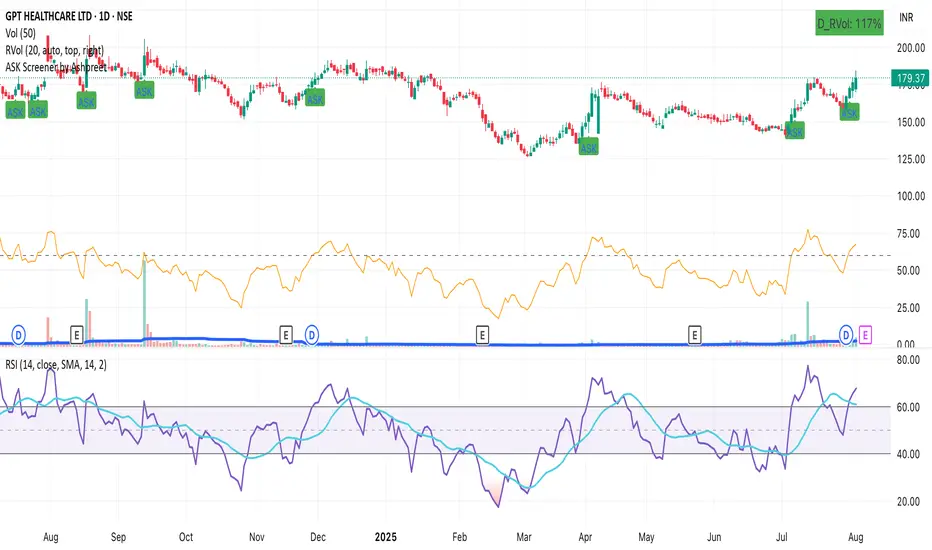
ASK Screener by AshpreetThe ASK Indicator is a custom-built breakout and trend continuation system designed for swing traders seeking high-probability entries with strong risk-reward ratios. Built using a combination of moving averages, momentum filters, volume confirmation, and price structure, this indicator helps identify stocks poised for explosive moves.
It uses three key moving averages: the 44-period SMA (medium trend), 20-period DEMA (short-term strength, custom-coded), and 50-period WEMA (institutional trendline). Trades are only triggered when the price is above 50 WEMA, and the 20 DEMA is above the 44 SMA.
Momentum is confirmed using RSI(14) within a healthy zone of 40–60, ensuring the stock is not overbought or oversold. To focus on breakout candidates, the stock must be trading within 10% of its 52-week high, and the weekly candle range must be under 10%, signaling compression before expansion.
A valid ASK Signal occurs when these conditions are met along with a breakout above the previous day’s high and volume exceeding 1.5× the 20-day average. Once triggered, the indicator auto-plots the stop-loss (1× ATR) and two profit targets: 1:2 (TP1) and 1:4 (TP2).
Additionally, the system detects a narrow range setup, where the last 3 daily candles are inside the previous 3-day range — a powerful consolidation signal. Alerts for both ASK entries and narrow ranges are included.
This system is ideal for positional and short-term swing traders who want to combine structure, momentum, and volume in one powerful tool.
Open Interest Screener (Fixed Zones)📌 Purpose
This indicator scans Open Interest (OI) changes across selected exchanges and highlights significant spikes or drops directly on the chart using dynamic shaded zones.
It is designed to help traders detect unusual market positioning changes that may precede volatility events.
🧠 How It Works
1. Data Sources
Supports multiple exchanges: BitMEX USD, BitMEX USDT, Kraken USD (toggle on/off in settings).
Automatically adapts symbol prefix based on the chart’s base asset.
2. Spike / Drop Detection
OI % Change is calculated over a configurable lookback (Bars to look back).
Spike Up: OI increases by more than Threshold %.
Spike Down: OI decreases by more than Threshold %.
3. Dynamic Zones
When a spike occurs, a green zone (increase) or red zone (decrease) is drawn on the chart.
Zone height is dynamic, based on price high/low ± 5%, preventing chart distortion.
Minimum spacing (Zone Spacing) prevents clustering.
📈 How to Use
Green Zones: Large OI increase can signal fresh positioning (possible breakout setups).
Red Zones: Large OI decrease can signal liquidation events or position unwinds.
Combine with price action, funding rates, or volatility measures for higher confidence.
Recommended Timeframes: Works best on 15m, 1h, 4h.
Markets: Crypto derivatives (OI data available).
⚙️ Inputs
Bars to Look Back
OI % Change Threshold
Zone Width
Exchange toggles (BitMEX USD/USDT, Kraken USD)
⚠️ Disclaimer
This script is for educational purposes only and does not constitute financial advice.
Always test thoroughly before live trading.
