Advanced Smart Trading Suite with OTE═══════════════════════════════════════
ADVANCED SMART TRADING SUITE WITH OPTIMAL TRADE ENTRY
═══════════════════════════════════════
A comprehensive institutional trading system combining multiple advanced concepts including multi-timeframe liquidity analysis, order blocks, fair value gaps, and optimal trade entry zones. Features optional anti-repainting controls for confirmed signal generation.
───────────────────────────────────────
WHAT THIS INDICATOR DOES
───────────────────────────────────────
This all-in-one trading suite provides:
- Multi-Timeframe Liquidity Detection - HTF (Higher Timeframe), LTF (Lower Timeframe), and current timeframe liquidity sweep identification
- Order Blocks - Institutional accumulation/distribution zones with enhanced detection
- Fair Value Gaps (FVG) - Price imbalance detection
- Inverse Fair Value Gaps (iFVG) - Counter-trend imbalance zones
- Optimal Trade Entry (OTE) Zones - Fibonacci retracement-based entry zones (0.618-0.786)
- Trading Sessions - Asian, London, and New York session visualization
- Anti-Repainting Controls - Optional confirmed signals with adjustable confirmation bars
- Comprehensive Alert System - Notifications for all major events
───────────────────────────────────────
HOW IT WORKS
───────────────────────────────────────
ANTI-REPAINTING SYSTEM:
This indicator includes optional anti-repainting controls that fundamentally change how signals are generated:
Confirmed Mode (Recommended):
- Signals wait for confirmation bars before appearing
- No repainting - what you see is final
- Adjustable confirmation period (1-5 bars)
- Slight lag in signal generation
- Better for backtesting and systematic trading
Live Mode:
- Signals appear immediately as patterns develop
- May repaint as new bars form
- Faster signal generation
- Better for discretionary real-time trading
The confirmation system affects all features: liquidity sweeps, order blocks, FVGs, and OTE zones.
LIQUIDITY SWEEP DETECTION:
Three-Tier System:
1. Current Timeframe Liquidity:
- Detects swing highs/lows on chart timeframe
- Configurable lookback and confirmation periods
- Session-tagged for context (Asian/London/NY)
2. HTF (Higher Timeframe) Key Liquidity:
- Default: 4H timeframe (configurable to Daily/Weekly)
- Strength-based filtering using ATR multipliers
- Distance-based clustering prevention
- Only strongest levels displayed (top 1-10)
- Labels show timeframe and strength rating
3. LTF (Lower Timeframe) Key Liquidity:
- Default: 1H timeframe (configurable)
- Precision entry/exit levels
- Strength-based ranking
- Distance filtering to avoid clutter
Sweep Detection Methods:
- Wick Break: Any wick beyond the level
- Close Break: Close price beyond the level
- Full Retrace: Break and close back inside (stop hunt detection)
Buffer System:
- Configurable ATR-based buffer for sweep confirmation
- Prevents false positives from minor price fluctuations
ORDER BLOCKS (Enhanced):
Detection Methodology:
- Identifies the last opposing candle before significant structure break
- Bullish OB: Last red candle before bullish break
- Bearish OB: Last green candle before bearish break
Enhanced Filters:
1. Size Filter:
- Minimum order block size (ATR-based)
- Ensures significant zones only
2. Volume Filter:
- Requires above-average volume (configurable multiplier)
- Confirms institutional participation
3. Imbalance Filter:
- Requires strong directional move after OB formation
- Validates true institutional activity
Violation Detection:
- Wick-based: Any wick through the zone
- Close-based: Close price through the zone
- Automatic removal of broken order blocks
FAIR VALUE GAPS (FVG):
Bullish FVG: Gap between candle 3 low and candle 1 high (three-bar pattern)
Bearish FVG: Gap between candle 3 high and candle 1 low
Requirements:
- Minimum gap size (ATR-based)
- Clear price imbalance
- No overlap between the three candles
Fill Detection:
- Configurable fill threshold (default 50%)
- Tracks partial and complete fills
- Removes filled gaps to keep chart clean
INVERSE FAIR VALUE GAPS (iFVG):
What are iFVGs:
- Counter-trend FVGs that form after original FVG is filled
- Indicate potential reversal or continuation failure
- Form within specific timeframe after original FVG
Detection Rules:
- Must occur after a FVG is filled
- Must form within 20 bars of original FVG
- Minimum size requirement (ATR-based)
- Opposite direction to original FVG
Visual Distinction:
- Dashed border boxes
- Different color scheme from regular FVGs
- Combined labels when FVG and iFVG overlap
OPTIMAL TRADE ENTRY (OTE) ZONES:
Based on Fibonacci retracement principles used by institutional traders:
Concept:
After a structure break (swing high/low violation), price often retraces to specific Fibonacci levels before continuing. The OTE zone (0.618 to 0.786) represents the optimal entry area.
Bullish OTE Formation:
1. Swing low is formed
2. Structure breaks above previous swing high (bullish structure break)
3. Price retraces into 0.618-0.786 Fibonacci zone
4. Entry signal when price enters and holds in OTE zone
Bearish OTE Formation:
1. Swing high is formed
2. Structure breaks below previous swing low (bearish structure break)
3. Price retraces into 0.618-0.786 Fibonacci zone
4. Entry signal when price enters and holds in OTE zone
Key Fibonacci Levels:
- 0.618 (Golden ratio - primary target)
- 0.705 (Square root of 0.5 - institutional level)
- 0.786 (Square root of 0.618 - deep retracement)
Structure Break Requirement:
- Optional setting to require confirmed structure break
- Prevents premature OTE zone identification
- Ensures proper swing structure is established
Entry/Exit Tracking:
- Green checkmark: Price entered OTE zone validly
- Red X: Price exited OTE zone (stop or target)
- Real-time status monitoring
TRADING SESSIONS:
Displays three major trading sessions with full customization:
Asian Session (Tokyo + Sydney):
- Default: 01:00-13:00 UTC+4
- Typically lower volatility
- Sets up key levels for London open
London Session:
- Default: 11:00-20:00 UTC+4
- Highest liquidity period
- Major institutional moves
New York Session:
- Default: 16:00-01:00 UTC+4
- US market hours
- High impact news events
Features:
- Real-time status indicators (🟢 Open / 🔴 Closed)
- Session high/low tracking
- Overlap detection and highlighting
- Historical session display (0-30 days)
- Customizable colors and borders
───────────────────────────────────────
HOW TO USE
───────────────────────────────────────
MASTER CONTROLS:
Enable/disable major features independently:
- Trading Sessions
- Liquidity Sweeps (Current TF)
- HTF Liquidity Sweeps
- LTF Liquidity Sweeps
- Order Blocks
- Fair Value Gaps
- Inverse Fair Value Gaps
- Optimal Trade Entry Zones
ANTI-REPAINTING SETUP:
For Backtesting/Systematic Trading:
1. Enable "Use Confirmed Signals"
2. Set Confirmation Bars to 2-3
3. All signals will wait for confirmation
4. No repainting will occur
For Real-Time Discretionary Trading:
1. Disable "Use Confirmed Signals"
2. Signals appear immediately
3. Be aware signals may adjust with new bars
MULTI-TIMEFRAME LIQUIDITY STRATEGY:
Top-Down Analysis:
1. Identify HTF liquidity levels (4H/Daily) for major targets
2. Find LTF liquidity levels (1H) for entry refinement
3. Wait for HTF liquidity sweep (liquidity grab)
4. Enter on LTF order block in direction of HTF sweep
5. Target next HTF or LTF liquidity level
Liquidity Sweep Trading:
1. HTF liquidity sweep = major institutional move
2. Look for immediate reversal or continuation
3. Use order blocks for entry timing
4. Place stops beyond the swept liquidity
SESSION-BASED TRADING:
Asian Session Strategy:
1. Identify Asian session high/low
2. Wait for London or NY session to open
3. Trade breakouts of Asian range
4. Target previous day's highs/lows
London/NY Session Strategy:
1. Watch for liquidity sweeps at session open
2. Enter on order block confirmation
3. Use OTE zones for retracement entries
4. Target session high/low or HTF liquidity
OTE ZONE TRADING:
Setup Identification:
1. Wait for clear swing high/low formation
2. Confirm structure break in intended direction
3. Monitor for price retracement to 0.618-0.786 zone
4. Enter when price enters OTE zone with confirmation
Entry Rules:
- Bullish: Long when price enters OTE zone from above
- Bearish: Short when price enters OTE zone from below
- Stop loss: Beyond 0.786 level or swing extreme
- Target: Previous swing high/low or HTF liquidity
Exit Management:
- Indicator tracks when price exits OTE zone
- Red X indicates position should be managed/closed
- Use order blocks or FVGs for partial profit targets
FAIR VALUE GAP STRATEGY:
FVG Entry Method:
1. Wait for FVG formation
2. Monitor for price return to FVG
3. Enter on first touch of FVG zone
4. Stop beyond FVG boundary
5. Target: Fill of FVG or next liquidity level
iFVG Reversal Strategy:
1. Original FVG is filled
2. iFVG forms in opposite direction
3. Indicates failed move or reversal
4. Enter on iFVG confirmation
5. Target: Opposite end of range or next structure
Combined FVG + iFVG:
- When both overlap, indicator combines labels
- Represents high-probability reversal zone
- Use with order blocks for confirmation
ORDER BLOCK STRATEGY:
Entry Approach:
1. Wait for order block formation after structure break
2. Enter on first return to order block
3. Place stop beyond order block boundary
4. Target: Next order block or liquidity level
Confirmation Layers:
- Order block + FVG = strong confluence
- Order block + Liquidity sweep = institutional setup
- Order block + OTE zone = optimal entry
- Order block + Session open = high probability
Volume Analysis:
- Wider colored section = stronger institutional interest
- Use volume bars to confirm order block strength
- Higher volume order blocks = more reliable
───────────────────────────────────────
CONFIGURATION GUIDE
───────────────────────────────────────
LIQUIDITY SETTINGS:
Lookback: 5-30 bars
- Lower = more frequent, sensitive levels
- Higher = fewer, more significant levels
- Recommended: 15 for intraday, 20-25 for swing
Sweep Detection Type:
- Wick Break: Most sensitive
- Close Break: More conservative
- Full Retrace: Stop hunt detection
Sweep Buffer: 0-1.0 ATR
- Adds distance requirement for sweep confirmation
- Prevents false positives
- Recommended: 0.1 for most markets
HTF/LTF LIQUIDITY:
HTF Timeframe Selection:
- Swing trading: 1D or 1W
- Day trading: 4H or 1D
- Scalping: 1H or 4H
LTF Timeframe Selection:
- Swing trading: 4H or 1D
- Day trading: 1H or 4H
- Scalping: 15m or 1H
Strength Filters:
- Min Pivot Strength: Higher = fewer, stronger levels
- Min Distance: Higher = less clustering
- Recommended: 2.0 ATR for HTF, 1.5 ATR for LTF
ORDER BLOCK SETTINGS:
Swing Length: 5-20
- Controls sensitivity of structure break detection
- Lower = more order blocks, faster signals
- Higher = fewer order blocks, stronger signals
- Recommended: 8-10 for most timeframes
Enhancement Filters:
- Min Size: 0.5-1.5 ATR typical
- Volume Multiplier: 1.2-2.0 typical
- Imbalance: Enable for strongest signals only
OTE SETTINGS:
Swing Length: 5-50
- Controls OTE zone formation sensitivity
- Lower = more frequent, smaller moves
- Higher = fewer, larger trend moves
- Recommended: 10-15 for intraday
Require Structure Break:
- Enabled: Only shows OTE after confirmed break
- Disabled: Shows potential OTE zones earlier
- Recommended: Enable for higher probability setups
FVG SETTINGS:
Min FVG Size: 0.1-2.0 ATR
- Lower = more gaps detected
- Higher = only significant gaps
- Recommended: 0.5 ATR for most markets
Fill Threshold: 0.1-1.0
- Determines when gap is considered "filled"
- 0.5 = 50% fill required
- Higher = more conservative
iFVG Min Size: 0.1-2.0 ATR
- Typically smaller than regular FVG
- Recommended: 0.3 ATR
ALERT SYSTEM:
Available Alerts:
- Liquidity Sweeps (Current TF)
- HTF Liquidity Sweeps
- LTF Liquidity Sweeps
- Session Changes (Open/Close)
- OTE Entry Signals
Alert Setup:
1. Enable alerts in settings
2. Select specific alert types
3. Create TradingView alert using "Any alert() function call"
4. Configure delivery method (mobile, email, webhook)
Alert Messages Include:
- Event type and direction
- Confirmation status (if using confirmed mode)
- Price level
- Timeframe (for liquidity sweeps)
───────────────────────────────────────
RECOMMENDED CONFIGURATIONS
───────────────────────────────────────
For Day Trading (15m-1H charts):
- HTF Liquidity: 4H
- LTF Liquidity: 1H
- Liquidity Lookback: 15
- Order Block Swing Length: 8
- OTE Swing Length: 10
- Confirmed Signals: Enabled, 2 bars
For Swing Trading (4H-1D charts):
- HTF Liquidity: 1D or 1W
- LTF Liquidity: 4H
- Liquidity Lookback: 20
- Order Block Swing Length: 10
- OTE Swing Length: 15
- Confirmed Signals: Enabled, 2-3 bars
For Scalping (5m-15m charts):
- HTF Liquidity: 1H or 4H
- LTF Liquidity: 15m or 1H
- Liquidity Lookback: 10-12
- Order Block Swing Length: 6-8
- OTE Swing Length: 8
- Confirmed Signals: Optional
───────────────────────────────────────
PERFORMANCE OPTIMIZATION
───────────────────────────────────────
This indicator is optimized with:
- max_bars_back declarations for efficient lookback
- Automatic memory cleanup every 10 bars
- Conditional execution based on enabled features
- Drawing object limits to prevent performance degradation
Memory Management:
- Old liquidity zones automatically removed
- Filled FVGs/iFVGs cleaned up
- Exited OTE zones removed
- Mitigated order blocks deleted
Best Practices:
- Enable only needed features
- Use appropriate timeframe combinations
- Don't display excessive historical sessions
- Monitor drawing object counts on lower timeframes
───────────────────────────────────────
EDUCATIONAL DISCLAIMER
───────────────────────────────────────
This indicator combines multiple institutional trading concepts:
- Liquidity theory (where orders accumulate)
- Order flow analysis (institutional footprints)
- Price imbalance detection (FVGs)
- Fibonacci retracement theory (OTE zones)
- Session-based trading (time-of-day patterns)
All calculations use standard technical analysis methods:
- Pivot high/low detection
- ATR-based normalization
- Volume analysis
- Fibonacci ratios
- Time-based filtering
The indicator identifies potential setups but does not predict future price movements. Success depends on proper application within a complete trading plan including risk management, position sizing, and market context analysis.
───────────────────────────────────────
USAGE DISCLAIMER
───────────────────────────────────────
This tool is for educational and analytical purposes. Trading involves substantial risk of loss. The anti-repainting features provide confirmed signals but do not guarantee profitability. Always conduct independent analysis, use proper risk management, and never risk capital you cannot afford to lose. Past performance does not indicate future results.
在脚本中搜索"smart"

【MasterHSC】CCI Mean Derivative Smart Strategy🧾 Strategy Description (English)
CCI Mean Slope Smart Strategy
This strategy is built on the derivative slope behavior of the Commodity Channel Index (CCI) mean line.
It identifies key turning points or trend continuations based on how the smoothed CCI (mean value) changes direction after reaching overbought or oversold zones.
Core Idea:
When the CCI mean reverses slope after exceeding ±100, it signals a potential mean reversion (range-trading opportunity).
When the CCI mean remains above +100 or below −100 with a consistent slope, it indicates a strong trending phase (momentum continuation).
The strategy dynamically adapts between these two behaviors depending on market conditions.
Modes:
🌀 Range Reversal Mode — Focuses on slope reversals after overbought/oversold conditions.
🚀 Trend Following Mode — Captures strong momentum when the CCI mean stays extended.
🧠 Auto Mode — Automatically switches between Range and Trend logic based on CCI mean volatility.
Key Features:
Dual-direction toggle: Enable or disable long/short entries independently.
Adjustable tolerance: Choose fixed or dynamic thresholds for flexibility.
Automatic mode label and visual buy/sell markers on the chart.
Pure CCI-based system — no external filters or indicators required.
Purpose:
This system is designed to reduce false signals in sideways markets while preventing missed opportunities during strong directional trends, offering a clean balance between precision and adaptability.

MACD with Smart Entry Signals & Trend Filter
This advanced MACD indicator combines traditional MACD analysis with intelligent entry signal detection and an optional EMA trend filter. It identifies high-probability entry points by analyzing histogram patterns, consolidation phases, and trend continuation setups.
### Key Features
**🎯 Smart Entry Detection**
- **Consolidation Breakouts**: Identifies exits from consolidation zones (weak bars) with strong momentum
- **Trend Reversals**: Detects potential trend changes after extended weak phases
- **Correction/Continuation Patterns**: Recognizes brief corrections within strong trends that offer continuation opportunities
**📊 Enhanced MACD Visualization**
- Color-coded histogram showing four distinct states:
- Strong Bullish (dark green): Rising histogram above zero
- Weak Bullish (light green): Falling histogram above zero
- Weak Bearish (light red): Rising histogram below zero
- Strong Bearish (dark red): Falling histogram below zero
**🔍 Multi-Layer Filtering System**
- **Candle Size Filter**: Eliminates signals during high volatility/large candle ranges
- **EMA Trend Filter**: Optional filter ensuring entries align with the dominant trend direction
- Visual markers for rejected signals (orange X for candle size, blue E for EMA trend)
**⚙️ Customizable Parameters**
- Adjustable MACD periods (default: 34/144/9)
- Configurable consolidation bar requirements
- Flexible correction pattern detection
- EMA trend filter with adjustable sensitivity
- Multiple alert types for all signal conditions
### How to Use
1. **Enable/disable filters** based on your trading style and market conditions
2. **Green triangles (L)**: Long entry signals when all conditions are met
3. **Red triangles (S)**: Short entry signals when all conditions are met
4. **Rejected signal markers**: Help you understand why certain setups were filtered out
5. **Background coloring**: Provides visual confirmation of signal zones and correction patterns
### Alert System
Comprehensive alerts for:
- Long and short entry signals
- Specific pattern types (consolidation, reversal, continuation)
- Rejected signals (helps refine strategy)
- Traditional MACD histogram crossovers
### Best Practices
- Use the EMA trend filter in trending markets to avoid counter-trend trades
- Adjust candle size filter based on your instrument's typical volatility
- Consider combining with support/resistance levels for confirmation
- Test different consolidation bar settings for your timeframe
### Parameters Summary
- Fast/Slow Length: MACD calculation periods
- Signal Smoothing: Signal line period
- Consolidation Bars: Minimum weak bars before breakout
- Max Candle Range: Filter for oversized candles
- EMA Period & Sensitivity: Trend filter configuration
---
*This indicator is designed for traders who want a systematic approach to identifying MACD-based entry opportunities with built-in risk management through filtering.*

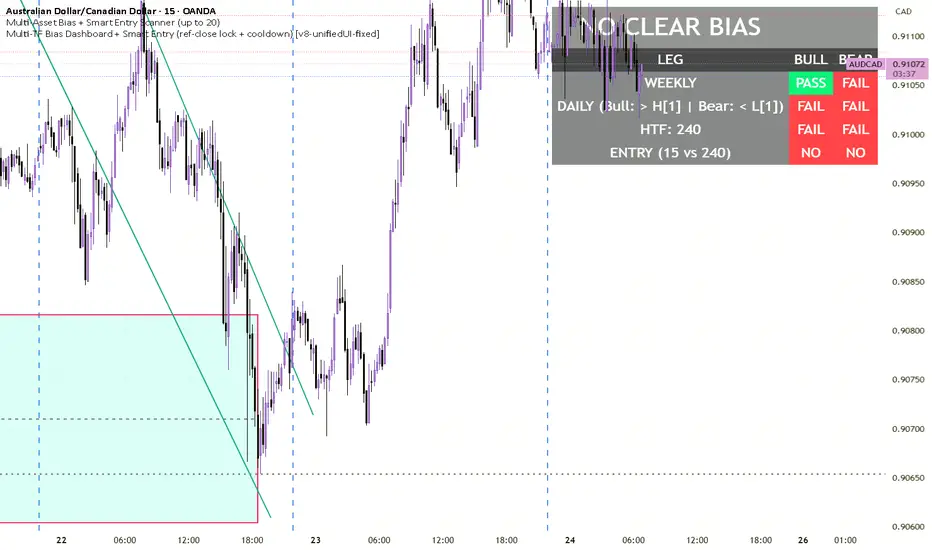
Multi-TF Bias Dashboard + Smart Entry V8Multi-TF Bias Dashboard + Smart Entry provides a complete top-down bias and entry confirmation system for professional traders.
It evaluates Weekly, Daily, and Custom HTF (e.g. 4H) candle structures to define directional bias, then synchronizes entry triggers from a lower timeframe using a reference–entry lock and optional cooldown filter to prevent overtrading.
A unified dashboard panel displays:
✅ Weekly / Daily / HTF leg PASS-FAIL logic
✅ Auto-locked entries only after reference bar close
✅ Bias banner (Bullish / Bearish / Neutral)
✅ Cooldown timer (Bars or Minutes) to space entries
✅ Real-time alerts + on-chart entry markers
ETH Smart Money Order Blocks Detector derek
This script helps identify potential Order Blocks (institutional price zones) on the chart based on Breaks of Structure (BOS).
It automatically highlights demand zones (green blocks) and supply zones (red blocks), making it easier to read institutional market flow.
Ideal for traders using Smart Money Concepts (SMC) or market structure analysis.
Compatible with any asset and timeframe.
🔹 Bullish OB = potential buy entry zone
🔹 Bearish OB = potential sell or resistance zone
Author: Derek 🧠💹

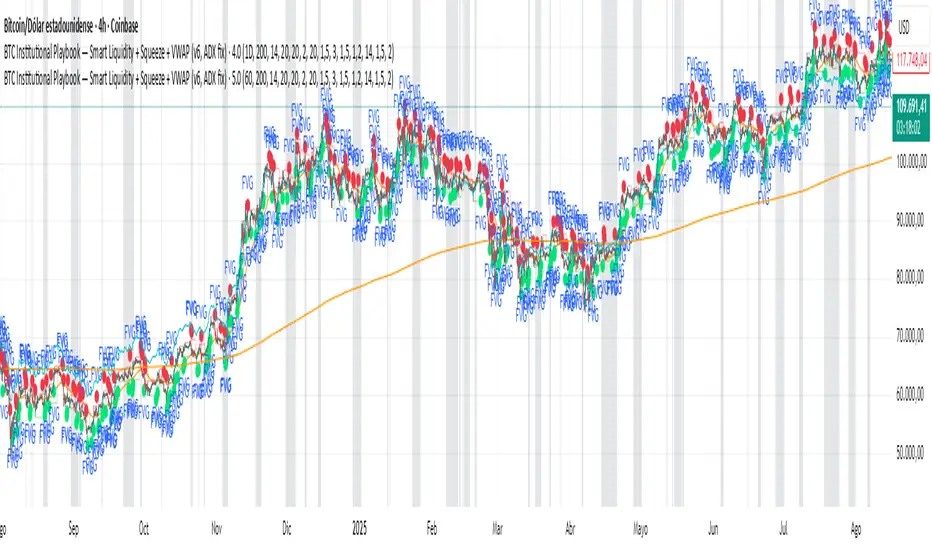
BTC Institutional Playbook Smart Liquidity + SqueezeBTC Institutional Playbook — Smart Liquidity + Squeeze + VWAP (v6, ADX fix)
Session & Swing Levels + Smart AlertsMulti-Timeframe Level Tracker with Advanced Alert System
This comprehensive indicator combines session-based trading levels with multi-timeframe swing analysis, for key level identification and alert management.
Key Features:
Session Analysis:
Asia Session (7:00 PM - 4:00 AM ET) - Tracks high/low levels during Asian market hours
London Session (3:00 AM - 11:00 AM ET) - Identifies key European session levels
Previous Day Levels - Displays prior day's high and low levels
Visual session backgrounds and customizable timezone support
Multi-Timeframe Swing Detection:
Up to 5 configurable timeframes (default: 15m, 1h, 4h, 1D, 1W)
Intelligent swing high/low identification using customizable pivot strength
Each timeframe uses distinct colors for easy identification
Advanced Alert System:
Anti-repainting protection - Alerts only trigger on confirmed bars for reliable live trading
Specific alert messages for each level type (Asia High, London Low, Previous Day levels, etc.)
Individual alert toggles for each session and timeframe
Timestamps in Eastern Time for consistency
Visual Customization:
Independent color schemes for sessions and timeframes
Configurable line styles (solid, dashed, dotted) and widths
Separate styling for active vs. mitigated levels
Optional line extension past mitigation points
📊 How It Works:
Level Creation: Automatically identifies and draws key levels at session closes
Mitigation Detection: Monitors price interaction with levels in real-time
Visual Updates: Changes line appearance when levels are crossed
Smart Alerts: Sends targeted notifications with level-specific information

Candlestick Pattern Strategy with Smart Stop-Loss Management🔹 Strategy Overview
This strategy combines candlestick patterns with trend filtering and EMA channel confirmation to identify high-probability trading opportunities. It features a smart stop-loss management system that moves to breakeven once the trade reaches a predefined profit threshold.
📊 Key Features
✅ Multiple Candlestick Patterns – Detects classic reversal patterns like:
Hammer & Hanging Man
Bullish & Bearish Engulfing
Piercing Line & Dark Cloud Cover
Morning & Evening Star
Doji Star (Neutral Signal)
✅ Trend & EMA Channel Filters
Trend EMA (100-period) – Ensures trades align with the broader trend.
EMA Channel (50-period ± % range) – Filters trades within a defined volatility range.
✅ Flexible Trade Management
Fixed Target Points – Take profit at a predefined distance.
Trailing Stop to Cost – Moves stop-loss to breakeven after reaching a specified profit threshold.
✅ Customizable Trade Direction
Long Only / Short Only / Both – Adapt to bullish, bearish, or neutral markets.
✅ Time-Based Execution
Intraday Mode – Trades only within specified session hours.
Positional Mode – Holds trades beyond the session.
⚙️ Input Parameters
Trend Filter – Enable/disable trend alignment with EMA.
EMA Channel Filter – Adjust channel width for volatility control.
Candlestick Patterns – Toggle individual patterns on/off.
Target Points & Trail Trigger – Customize profit-taking and SL management.
Trade Type – Switch between intraday and positional trading.
📈 Entry Conditions
Long Entry:
Bullish candlestick pattern (Hammer, Bullish Engulfing, Piercing Line, Morning Star).
Price above Trend EMA (if enabled).
RSI < 30 (oversold confirmation).
Within EMA Channel (if enabled).
Short Entry:
Bearish candlestick pattern (Hanging Man, Bearish Engulfing, Dark Cloud Cover, Evening Star).
Price below Trend EMA (if enabled).
RSI > 70 (overbought confirmation).
Within EMA Channel (if enabled).
📉 Exit Conditions
Take Profit (TP): Fixed target based on points.
Stop-Loss (SL): Moves to breakeven after hitting the trail trigger.
📊 Visual Indicators
Trend EMA (Orange Line) – Main trend direction.
EMA Channel (Blue Lines) – Volatility range.
Buy/Sell Labels – Entry signals below/above bars.
Doji Star (Gray Cross) – Neutral signal.
🎯 Best Suited For
Swing Traders (Positional Mode)
Intraday Traders (Scalping with tight stops)
Price Action Enthusiasts (Candlestick-based entries)
🔗 Try it out and customize it to fit your trading style! 🚀

ChrisFe SMC Full Tool (EMA 200 + VWAP)🚀📊 SMC Killzone Pro Indicator — Complete, smooth & 100% customizable
💡 Designed for demanding traders: clear display, soft colors, no aggressive elements.
⚙️ Everything is fully customizable: enable/disable each module, change colors, choose exactly what to display.
🔹 SMC Killzone Pro by Chris Foe
Based on Smart Money Concepts, this indicator blends aesthetics & performance.
✨ Features included:
📅 Sessions – Asia, London, New York (precise time zones)
🎯 Custom Killzones – Refine your entry timing
📈 Dynamic VWAP + adjustable MA
🔍 Key Levels – PDH, PDL, PWH, PWL, MID, Daily/Weekly Open
⚡ Optimized display – Hides unnecessary zones on higher TFs
🎨 Full customization – Colors, transparency, styles…
💎 Why choose it?
✔️ Professional power with a smooth & intuitive interface
✔️ Works on all timeframes – from M1 to H4, always clean & efficient

CHoCH + BOS + LQ Sweep v6.3.8 PRO+The CHoCH + BOS + LQ Sweep PRO indicator is a comprehensive Smart Money Concepts (SMC) tool designed to identify market structure shifts, liquidity sweeps, and key supply-demand zones across multiple timeframes. It helps traders visualize crucial price action patterns like Change of Character (CHoCH), Break of Structure (BOS), and liquidity grabs that often precede significant market reversals or continuations.
This tool is especially suited for traders applying multi-timeframe analysis and liquidity-based trading strategies on Forex, crypto, indices, or commodities.
1. Liquidity Sweeps (LQ Sweeps)
Identifies when price sweeps previous highs/lows (stop hunts/liquidity grabs).
Configurable strength setting to filter minor vs. major sweeps.
Optional stop at wick or stop at close logic for more precise entries.
Old sweeps can be displayed or hidden, with user-defined limits for historical sweeps.
2. Multi-Timeframe (HTF) Sweeps
Displays liquidity sweeps from higher timeframes (M15, H1, H4, D1, W1).
Individual checkboxes allow flexible combinations (e.g., show only H1 & H4 sweeps).
Unique colors for each timeframe to differentiate visually on the chart.
3. Supply/Demand Zones
Automatically plots zones around swing highs and lows.
Zones are dynamically updated and locked once price interacts with them.
Configurable view: Show both bullish/bearish zones or filter for one side only.
Option to display/hide old zones and limit the number of zones shown.
4. Historical Sweep Management
Stores up to 5000 sweeps internally, while adhering to TradingView’s rendering limits (max 500 drawn).
Ensures chart clarity by prioritizing the most recent sweeps.

BullishSpotAI Smart Signals - EnhancedBullishSpotAI Smart Signals – Invite-Only Version
This script is a multi-layered technical analysis tool designed to help traders identify potential high-probability entry and exit zones based on a combination of trend, momentum, and volatility signals.
🔹 Key Features:
EMA Cross Logic: Detects momentum shifts using fast and slow exponential moving averages.
Multi-Indicator Confirmation: Combines conditions based on RSI, MACD, and ADX to validate trend strength and reduce false signals.
Auto-Generated Trade Levels: Automatically plots estimated entry, stop loss (SL), and multiple take profit (TP) levels on the chart for visual clarity.
Adaptive Parameters: Adjusts calculation settings based on the selected timeframe to better align with different trading styles.
🔹 Compatible With:
Scalping
Day Trading
Swing Trading
🔹 Additional Functionalities:
Built-in alerts for potential long and short opportunities.
Optional visualization of extended price zones to support trade planning.
📌 This invite-only script is closed-source. While the exact logic is not publicly disclosed, the description outlines its core mechanisms and the type of analysis it performs.
⚠️ This tool is not a guarantee of future results and should be used in conjunction with sound risk management and personal judgment. It is intended to support technical decision-making, not to replace it.

Adaptive Trend Cloud + Smart Reversal Zones [@darshakssc]This indicator combines a volatility-adjusted trend cloud with RSI- and volume-based reversal signals to help traders visually spot potential trend continuation or reversal zones.
It’s designed to look clean, colorful, and informative — great for both beginners and experienced traders looking for chart clarity and actionable insights.
🔍 How It Works
🔵 1. Trend Cloud
1. The cloud is created using a 34-period EMA as the base and adjusted with a 14-period ATR multiplier.
2. When price is above the EMA, the cloud turns green (bullish).
3. When price is below the EMA, it turns red (bearish).
4. A neutral gray tone shows when price is inside the cloud, signaling potential indecision.
🔁 2. Smart Reversal Signal Logic
1. Signals appear only when price enters the cloud zone, indicating a potential change in direction.
2. To confirm the reversal, the following conditions must also be met:
3. RSI is below 40 (for bullish reversals) or above 60 (for bearish reversals)
4. A volume spike occurs (1.8× the 20-bar volume average)
5. A cooldown of 10 bars between signals prevents overplotting
🎯 3. TP & SL Labels
1. When a valid buy or sell signal appears:
🎯 TP (Take Profit) is placed at 2× ATR distance
🛑 SL (Stop Loss) is placed at 1× ATR distance
These levels are shown via chart labels for visual reference
🛎️ 4. Alerts
1. Built-in alerts trigger on:
🟢 Buy reversal signals
🔴 Sell reversal signals
✅ How to Use
1. Apply the indicator to any chart (works best on 5min–4h timeframes)
2. Look for the 🟢 Buy / 🔴 Sell labels when price touches the cloud
3. Use the visual TP/SL markers as reference zones — not financial advice
4. Combine with your own risk management, price action or confluence tools
⚙️ Customization Options
1. EMA & ATR lengths and multipliers
2. RSI and volume thresholds
3. Signal cooldown to reduce noise
4. Toggle TP/SL zones on or off
⚠️ Disclaimer
This script is for educational purposes only and does not constitute financial advice. Always test on demo accounts and combine with your own trading system.

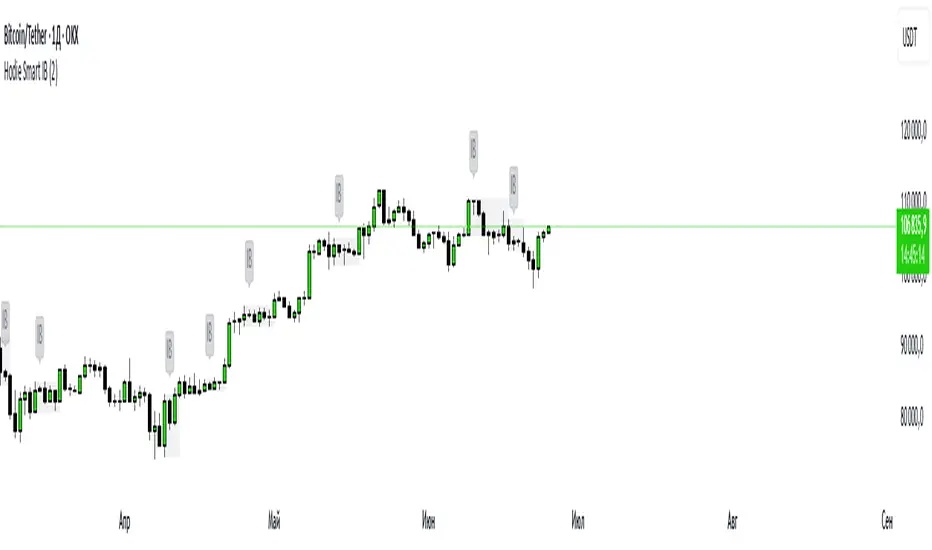
Hodie Smart Inside BarThe Hodie Smart Inside Bar indicator automatically detects and visually highlights inside bars — candles fully contained within the range of the previous (parent) candle.
How the indicator works:
Inside Bar Identification:
The indicator analyzes each candle and checks if its high is lower than the previous candle’s high, and its low is higher than the previous candle’s low. If this condition is met, the candle is considered an inside bar.
Size Filtering:
To filter out small and insignificant consolidations, the indicator compares the size of the parent candle’s range to the inside bar’s range. Only if the parent candle is significantly larger (2 times or more — adjustable parameter), the inside bar is considered significant.
Zone Drawing:
For each detected inside bar, the indicator draws a rectangular zone bounded by the parent candle’s high and low. This zone automatically extends to the right as new bars appear until the price moves outside the parent candle’s range.
Zone Completion:
Once the price closes above the parent candle’s high or below its low, the zone is considered complete and stops extending.
Visual Aids:
If enabled, the indicator can shade the background of the current inside bar for additional visual emphasis.
A label with the text "IB" appears above the inside bar candle on the chart for easier identification.
Alerts:
Supports alerts when a new inside bar forms.
Alerts help traders notice important signals promptly.
To activate, create an alert on the indicator with the condition “New Inside Bar”.
Benefits of the Indicator:
Inside bars often signal consolidation and potential liquidity accumulation, which may be followed by a strong impulsive breakout. This indicator helps traders quickly identify consolidation zones and prepare for possible price moves.
FVG Candle HighlighterThis indicator highlights only the true Fair Value Gap (FVG) creator candle — the middle candle in a 3-bar FVG formation — with zero clutter.
🔹 Bullish FVG: Candle is colored if price gaps above the high two bars back
🔹 Bearish FVG: Candle is colored if price gaps below the low two bars back
✨ No boxes. No zones. Just pure, visual price-action accuracy.
🔧 Powered by Pine Script v6
🧠 Based on institutional-style FVG logic
🎯 Ideal for Smart Money / ICT / Order Block strategies

IU Smart Flow SystemDESCRIPTION
The IU Smart Flow System is a powerful and dynamic order flow-based strategy designed to capture high-probability trades by analyzing bullish and bearish imbalances, trend direction, and RSI strength. It identifies trading opportunities by aligning order flow conditions with the prevailing trend and momentum, making it suitable for trend-following and momentum-based trading.
This system utilizes a unique combination of:
- Order flow score to gauge market imbalance
- Trend filter using SMA and ATR to confirm market direction
- RSI to ensure entry only during strong momentum
USER INPUTS:
- Imbalance Length: Defines the lookback period for calculating bullish and bearish imbalances. (Default: 10)
- Trend Length: Determines the length of the SMA to evaluate the trend direction. (Default: 50)
- RSI Length: Specifies the RSI period to assess momentum strength. (Default: 14)
LONG CONDITIONS:
Long entries are triggered when:
- Order flow score is positive, indicating bullish imbalance
- Price is above the bullish trend level (SMA + ATR), confirming an uptrend
- RSI is above 50, indicating bullish momentum
- No active short position is currently open
SHORT CONDITIONS:
Short entries are triggered when:
- Order flow score is negative, indicating bearish imbalance
- Price is below the bearish trend level (SMA - ATR), confirming a downtrend
- RSI is below 50, indicating bearish momentum
- No active long position is currently open
WHY IT IS UNIQUE:
- Imbalance-Based Approach: Unlike traditional strategies that rely solely on price action, this system evaluates bullish and bearish imbalances to anticipate order flow direction.
- Adaptive Trend Filter: The combination of SMA and ATR dynamically adjusts to market volatility, providing a reliable trend confirmation mechanism.
- Momentum Validation with RSI: Ensures that entries are taken only in the direction of strong momentum, reducing false signals.
HOW USERS CAN BENEFIT FROM IT:
- Enhanced Trade Accuracy: Aligning order flow, trend, and momentum reduces false signals and improves trade success rates.
- Versatile Application: Suitable for various markets and timeframes, making it adaptable to different trading styles.
- Clear Trade Signals: Provides clear entry labels and alerts, ensuring traders never miss a potential opportunity.
- Visual Clarity: The filled region between bullish and bearish trends highlights trend direction, enhancing decision-making.

ICT Smart Money Liquidity LevelsThe ICT Smart Money Liquidity Levels indicator is designed to visualize key liquidity areas across multiple timeframes. Based on ICT concepts, this tool can help traders analyze price movement, liquidity sweeps, and expansion levels without switching between timeframes.
This indicator highlights liquidity levels at significant highs and lows, allowing users to track potential areas of interest where price may react. By also incorporating historical measurements, it also provides forecasted average sweep and expansion zones.
Features:
- Liquidity Levels
Plots previous HTF candle highs and lows. Available for 1H, 4H, Daily.
- Major Liquidity Levels
Highlights areas where price previously reached a significant high or low within 10 HTF candles. Available for 1H, 4H, Daily.
- Sweep and Expansion Forecast
Uses historical price data to forecast the average sweep and expansion levels for the next HTF candle. Available for 4H, Daily, Weekly, Monthly.
Why Is This Indicator Useful?
Based on ICT concepts, price seeks liquidity, often targeting trapped stops above highs and below lows before reversing or continuing its trend. High-timeframe (HTF) highs and lows, such as 1H, 4H, and Daily liquidity levels, act as natural draw points where price is likely to react. These levels represent areas where stop hunts, liquidity grabs, and institutional order flow often take place. By marking these zones, traders can anticipate where price may seek liquidity before making a significant move.
Additionally, historical liquidity sweeps and expansion zones provide insight into how price has behaved in similar situations in the past. According to ICT methodology, price often manipulates liquidity before expanding in the intended direction. By tracking average sweep and expansion levels, traders can forecast potential price movement, aligning their entries with areas where liquidity has historically been taken or distributed.
Disclaimer:
This indicator is for informational and educational purposes only. It does not provide financial, investment, or trading advice. No guarantees are made regarding accuracy, completeness, or profitability. Trading involves risk, and past performance does not indicate future results. Users are solely responsible for their trading decisions. By using this indicator, you acknowledge that the creator is not liable for any financial losses or decisions based on the information provided.
More Examples:
@unlcesyp smart wick reversal@unlcesyp smart wick reversal
This indicator helps you spot potential market reversals by highlighting abnormal wicks that often signal a turning point. It adapts to changing market volatility and volume, making it more reliable across different market conditions.
How It Works
1. Wick Analysis
- Measures upper and lower wicks over a chosen lookback period.
- Calculates the average and standard deviation of these wicks, then flags “abnormally long” wicks.
2. Adaptive Volatility
- Uses an ATR-based volatility factor to adjust the wick threshold.
- In high-volatility conditions, the threshold is higher, reducing false signals.
3. Trend Check
- Select either an SMA or EMA to determine if the market is in an uptrend or downtrend.
- A large upper wick in an uptrend can signal bullish exhaustion (potential reversal down).
- A large lower wick in a downtrend can signal bearish exhaustion (potential reversal up).
4. Optional Volume Confirmation
- Checks if volume is above its average to ensure strong participation in the move.
- Helps filter out weak, low-volume signals.
5. Signals
- Red ▼ (triangle down) = Potential Bearish Reversal
- Green ▲ (triangle up) = Potential Bullish Reversal
Why Use It?
- Adaptive: Automatically adjusts to changes in market volatility.
- Flexible Trend Basis: Choose SMA or EMA for calculating market trend.
- Volume Filter: Adds an extra layer of confirmation.
- Clear Visuals: Marks potential reversals with simple, unobtrusive shapes.
Inputs Explained
1. Lookback Period for Wick Analysis (`length`)
- Default: 20
- Number of bars used to calculate wick averages. Higher values = smoother signals; lower values = more reactive.
2. ATR Length for Volatility Filtering (`atr_length`)
- Default: 14
- Number of bars the ATR uses to gauge volatility.
3. Base Threshold Multiplier (`base_multiplier`)
- Default: 2.0
- Multiplier for standard deviation of wicks. Higher = fewer (but potentially stronger) signals.
4. Volatility Sensitivity Factor (`volatility_sensitivity`)
- Default: 1.5
- Adjusts how much volatility affects the threshold. Higher = more adaptive; lower = more stable.
5. Enable Volume Confirmation (`volume_filter`)
- Default: true
- When enabled, signals only appear if volume exceeds its average by a specified multiplier.
6. Volume Spike Multiplier (`vol_multiplier`)
- Default: 1.5
- Determines how much above average volume must be to confirm a signal.
7. Trend Calculation Method (`trendMethod`)
- Options: “SMA” or “EMA”
- Determines the type of moving average to evaluate the market trend for exhaustion signals.
Best Practices
- Combine with other price action or technical indicators to confirm signals.
- Use on multiple timeframes for a broader market perspective.
- Adjust parameters (`length`, `atr_length`, `base_multiplier`) for different assets or personal preference.
Introducing the "Smart Money Trap" (SMT) IndicatorThe "Smart Money Trap" (SMT) indicator is a powerful tool designed for simultaneous analysis of multiple currency pairs and their correlations. This indicator allows you to effortlessly visualize divergences and correlations between various currency pairs on a single chart, enhancing your ability to perform in-depth technical analysis.
Key Features:
Multi-Currency Comparison:
The SMT indicator enables you to view the following currency pairs simultaneously:
EUR/USD (Euro to US Dollar)
GBP/USD (British Pound to US Dollar)
USD/JPY (US Dollar to Japanese Yen)
DXY (US Dollar Index)
Correlation and Divergence Analysis:
By overlaying these currency pairs, the SMT indicator helps you identify correlations and divergences between them, which can signal potential trading opportunities.
Customizable Timeframes:
The indicator automatically adjusts to the current chart’s timeframe, ensuring that your analysis is always in sync with the selected period.
Enhanced Decision-Making:
With the ability to visualize multiple currency pairs and their relationships, you can make more informed trading decisions and better understand market dynamics.
The SMT indicator is a valuable tool for traders looking to track and analyze currency pair interactions and identify trading signals based on their correlations and divergences.

Omega Smart AnalystThe Omega Smart analyst is a tool designed to help traders visualize in a clearer way key price levels on the chart based on the price and the volume.
The indicator has some features, including:
- Option to customize the colors for all of the tools available to have common aesthetics
- Option to choose the length and the sensitivity for all of the tools
Volume clusters: display automatic volume clusters that can be used as support or resistance following the order block theory. These levels can be highlighted or extended in the settings.
Support and resistance: show automatic support and resistance levels based on volume.
Candle coloring: color candles based on volume and volatility, great to use as a signal confirmation.
Full levels: show previous high, low, and close levels on the chart, great to use to detect liquidity and breakouts
Bias target: a tool to enhance one of the low or high of the previous full levels according to the daily liquidity bias ICT method. As shown in the picture above you can also choose to display only these levels.
Market structure: show the current trend according to the market structure.
Structure origin: shows the main level of support and resistance with an area that gives also an indication of the current price volatility.
Risk Disclaimer:
All content and scripts provided are purely for informational & educational purposes only and do not constitute financial advice or a solicitation to buy or sell any securities of any type. Past performance does not guarantee future results. Trading can lead to a loss of the invested capital in the financial markets. I will not accept liability for any loss or damage, including without limitation any loss of profit, which may arise directly or indirectly from the use of or reliance on such information. All investments involve risk, and the past performance of a security, industry, sector, market, financial product, trading strategy, backtest, or individual's trading does not guarantee future results or returns. Investors are fully responsible for any investment decisions they make. Such decisions should be based solely on an evaluation of their financial circumstances, investment objectives, risk tolerance, and liquidity needs.
DB Support Resistance Levels + Smart Higher Highs and Lower LowsDB Support Resistance Levels + Smart Higher Highs and Lower Lows
The indicator plots historic lines for high, low and close prices shown in settings as "base levels". Users can control the lookback period that is plotted along with an optional multiplier. Traders will notice that the price bounces off these historic base levels. The base levels are shown as light gray by default (customizable in the settings). Users may choose to display base levels by a combination of historic high, low and close values.
On top of the historic base levels, the indicator display higher high and lower low levels from the current bar high/low. Higher highs are shown by default in pink and lower lows by default in yellow. The user can adjust the lookback period for displaying higher highs and the optional multiplier. Only historic values higher than the current bar high are displayed filtering out (by highlighting) the remaining levels for the current bar. Users may choose to use a combination of historic open, low and close values for displaying higher highs. The user can adjust the lookback period for displaying lower lows and the optional multiplier. Only historic values lower than the current bar low are displayed filtering out (by highlighting) the remaining levels for the current bar. Users may choose to use a combination of historic open, low and close values for displaying lower low.
The indicator includes two optional filters for filtering out higher highs and lower lows to focus (highlight) the most relevant levels. The filters include KC and a simple price multiplier filter. The latter is enabled by default and recommended.
The indicator aims to provide two things; first a simple plot of historic base levels and second as the price moves to highlight the most relevant levels for the current price action. While the indicator works on all timeframes, it was tested with the weekly. Please keep in mind adjusting the timeframe may require the lookback settings to be adjusted to ensure the bars are within range.
How should I use this indicator?
Traders may use this indicator to gain a visual reference of support and resistance levels from higher periods of time with the most likely levels highlighted in pink and yellow. Replaying the indicator gives a visual show of levels in action and just how very often price action bounces from these highlighted levels.
Additional Notes
This indicator does increase the max total lines allowed which may impact performance depending on device specs. No alerts or signals for now. Perhaps coming soon...

LNL Smart TICKLNL Smart TICK
This study is mostly beneficial for intraday traders. It is basically a user-friendly "colorful" representation of the $TICK chart with highlighted $TICK extremes. This indicator also includes: a simple trend gauge that can visualize the bias for the day, cumulative tick cloud which is showing the cumulative strength of either longs & shorts on the day.
$TICK Trend Gauge
Although it is just a exponential moving average. This average (default set on 20) works quite well as an overall gauge for the day. Whenever the gauge is green (above zero), any negative $TICK values below -500 can offer great pullback opportunities. Same applies for the red gauge. 20 EMA is below zero ? Great time to fade any +500 or +1000 tick readings. Obviously the gauge can be ajdusted to any number based on personal style.
$TICK Extremes (little triangles)
These little triangles are triggered anytime $TICK jumps above or below the pre-set values of +1000 or -1000. By just simply observing the $TICK triangles during the day can tell you how much volaility or pressure there is. Sometimes there will be 20 green triangles and only 2 red ones. That obviously mean there is a strong bearish pressure. But there will be days when you are not going to see any triangles at all which can mean there is either a low volatility or the price is stuck in the indecisive market.
Cumulative $TICK Cloud
Cumulative $TICK by itself is a great study for day traders. It is basically running "counting" $TICK that is adding the previous $TICK values from previous bars. Cumulative $TICK can create a direct picture of the current market sentiment. It is not just a simple green / red line but a cloud that can really show you the depth on the $TICK. Some days, the cloud will be quite wide which is a good sign for the strength to one side, but sometimes the cloud will be so narrow it will practically disappear. This would be telling you the exact opposite - not much conviction to any side. Of course the depth as well as the color of the cloud can change during the day.
$TICK & Cumulative $TICK Tables
By just looking at these tables. You can immidiately tell the state of the current $TICK. They both can be red or green. It all depends whether the values are positive or negative. The tables are just a little visual addition to the whole $TICK study.
Hope it helps.

Price Swing Detection - Smart Money ConceptSince my own style is Smart Money Concept and these days I have seen a lot of my friends who are having trouble identifying structures for their indicators and strategies. I wrote this code so they could use it in their strategy . In fact, this type of structure, as one of the strongest technical structures, can increase the success of your strategy according to your personalization.
The script detects swings (i.e. significant highs and lows) in a financial instrument's price action over a specified period. The user can set the lookback period (number of candles to consider) and the colors of the lines representing bullish and bearish trends.
The script has two functions: detectSwing and pivot high. The detectSwing function calculates the swing highs and lows for the specified number of candles. The function uses the ta.highest and ta.lowest functions to find the highest and lowest prices, respectively, over the lookback period. The function also determines the swing state (high or low) of the current candle and returns the calculated swing values.
The pivot high function calculates the pivot high, which is an important step in detecting bullish structures in the market. If a new top (i.e. swing high) is found, the script updates the pivot high values and creates a line from the recent top to the last bar. The script also updates the trailing maximum values, which are used to extend the top extension line.
For Strategy :
The variable "trendDirection" in the code is used to keep track of the trend state, either bullish (up trend) or bearish (down trend), in the market. The variable is initialized to 0 which represents a downtrend. The value of this variable is updated later in the code based on the calculations of swing highs and lows, pivot crosses, and the trailing maximum. If a bullish structure is detected, the value of "trendDirection" is set to 1, indicating an uptrend.

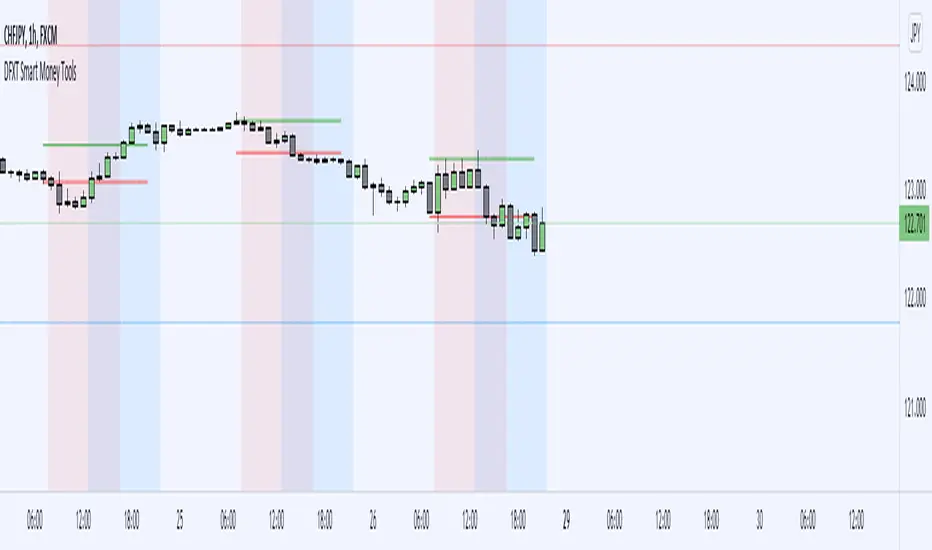
DFXT Smart Money ToolsAdded some additional features that may be useful for those trading smart money concepts.
~ Higher time frame candle Open, High, Low and close marker: for reference of where you are in price.
~ Asian Session High and Low marker: Can be used to clearly see runs on the Asian range.
~ Engulfing Candle detector: Marks engulfing candles in a colour of your choice.
~ Impulsive Candle detector: Marks Impulsive candles in a colour of your choice.
~ Quarter's Theory: Marks Quarter levels on the chart.
~ Doji Candle: Marks Doji candles in a colour of your choice.
~ Inside Bar detector: Marks Inside bars in a colour of your choice.
~ Imbalance detector: Marks Bullish and bearish imbalance in a colour of your choice.
~ Zig-Zag structure: Classic ZZ indicator that can be used to simplify the structure.
~ Liquidity Wicks: Wicks that take Liquidity then close back inside the range.
~ Session Marker: Markers the various trading sessions in a background colour of your choice.