ILM Seasonality Big Moves - TableUse this script on Daily Timeframe.
This script calculates Daily Moves ( Intraday / Close basis ) and buckets them into 1% / 2% / 3% moves
Also calculates MAX DD for the financial year from Peak to Trough
Helps in identifying volatility of the instrument and high drawdowns due to volatility
季节性

Month/Month Percentage % Change, Historical; Seasonal TendencyTable of monthly % changes in Average Price over the last 10 years (or the 10 yrs prior to input year).
Useful for gauging seasonal tendencies of an asset; backtesting monthly volatility and bullish/bearish tendency.
~~User Inputs~~
Choose measure of average: sma(close), sma(ohlc4), vwap(close), vwma(close).
Show last 10yrs, with 10yr average % change, or to just show single year.
Chose input year; with the indicator auto calculating the prior 10 years.
Choose color for labels and size for labels; choose +Ve value color and -Ve value color.
Set 'Daily bars in month': 21 for Forex/Commodities/Indices; 30 for Crypto.
Set precision: decimal places
~~notes~~
-designed for use on Daily timeframe (tradingview is buggy on monthly timeframe calculations, and less precise on weekly timeframe calculations).
-where Current month of year has not occurred yet, will print 9yr average.
-calculates the average change of displayed month compared to the previous month: i.e. Jan22 value represents whole of Jan22 compared to whole of Dec21.
-table displays on the chart over the input year; so for ES, with 2010 selected; shows values from 2001-2010, displaying across 2010-2011 on the chart.
-plots on seperate right hand side scale, so can be shrunk and dragged vertically.
-thanks to @gabx11 for the suggestion which inspired me to write this

RSI - S&P Sector ETFsThe script displays RSI of each S&P SPDR Sector ETF
XLB - Materials
XLC - Communications
XLE - Energy
XLF - Financials
XLI - Industrials
XLK - Technology
XLP - Consumer Staples
XLRE - Real Estate
XLU - Utilities
XLV - Healthcare
XLY - Consumer Discretionary
It is meant to identify changes in sector rotation, compare oversold/overbought signals of each sector, and/or any price momentum trading strategy applicable to a trader.

Seasonality (advanced)Script show up to 7 previous values of 'source' input for a specified period of days. Use inputs to select period: 365 (approximately) for years, or any other period (1, 7, 30, 90...). You can hide extra plots, customize their colors, apply this to another indicator or enable 'trackprice'.
On showcase:
Top indicator shows a close price for previous 3 years, and curent year
Bottom: a volume ma for previous years.

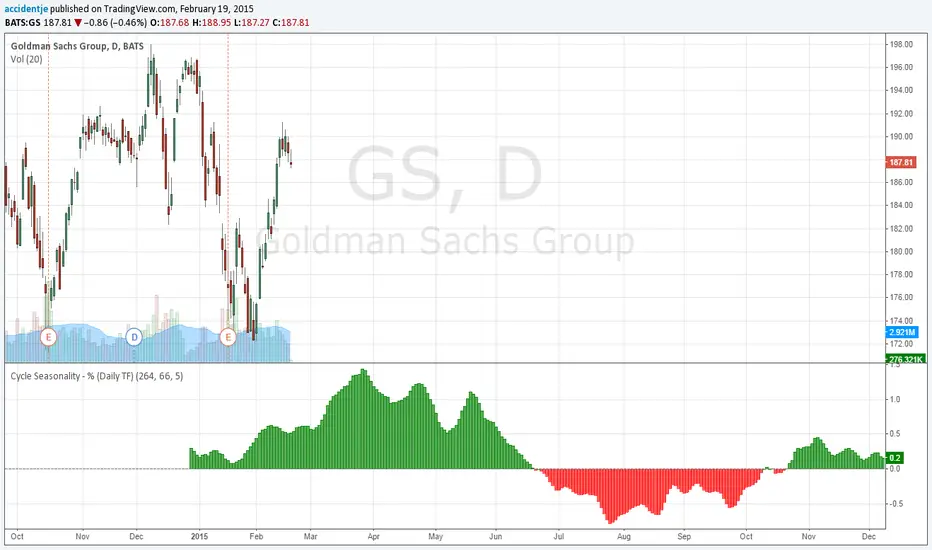
4 year seasonality - % (Daily TF)Inspired by the work done by crasher (can be found here: ).
Improvement of my earlier adaptation (can be found here: ).
This script projects the average % change of the selected security in the past 4 years.
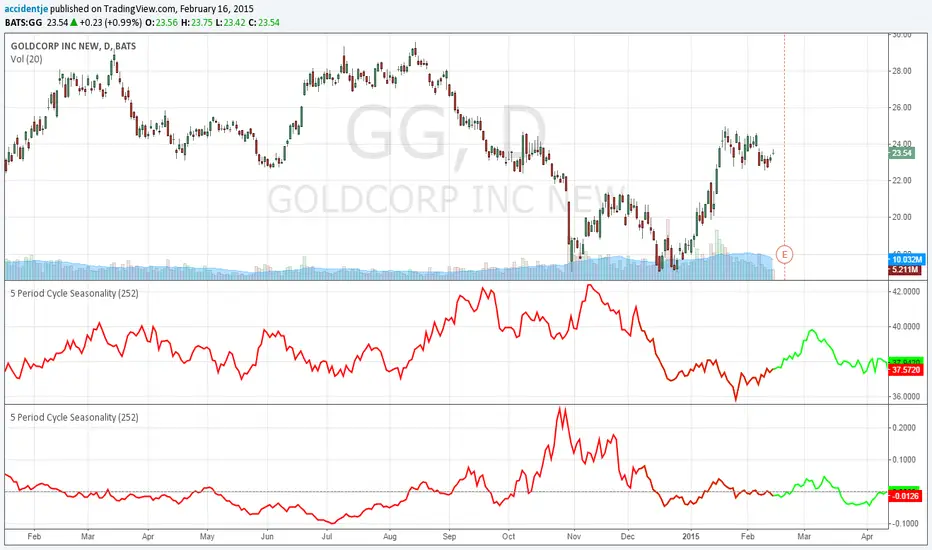
5 Period Cycle Seasonality (%)Slight modification of the work done by crasher (can be found here: ).
This script shows the average % change instead of the average nominal change of the selected security in the past 5 years.
Upper indicator: script by crasher (see link above)
Lower indicator: modified script by me
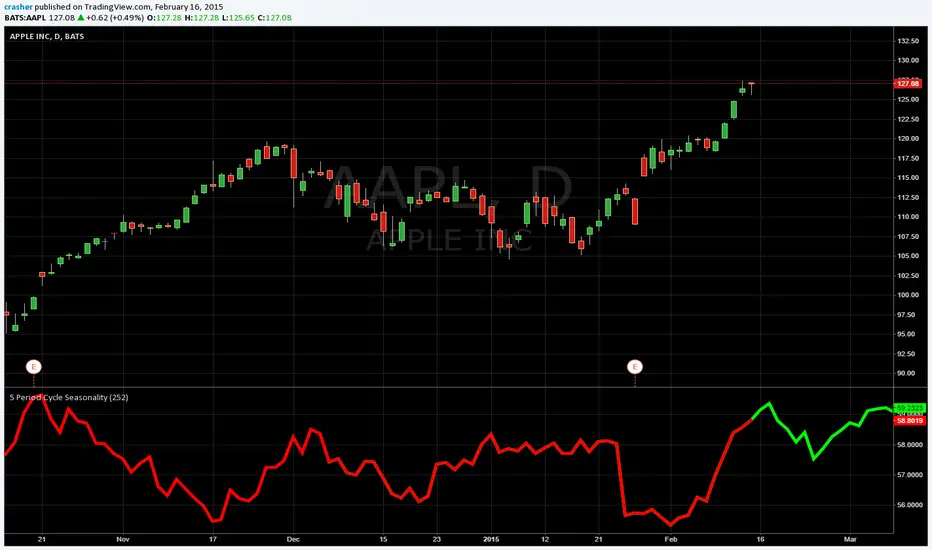
5x Period Cycle SeasonalityShows the average from the last 5 periods for close price cycle. For example to see the annual seasonality of a stock for the last 5 years use on daily chart with the default setting of 252, the number of trading days in a year, approximately.