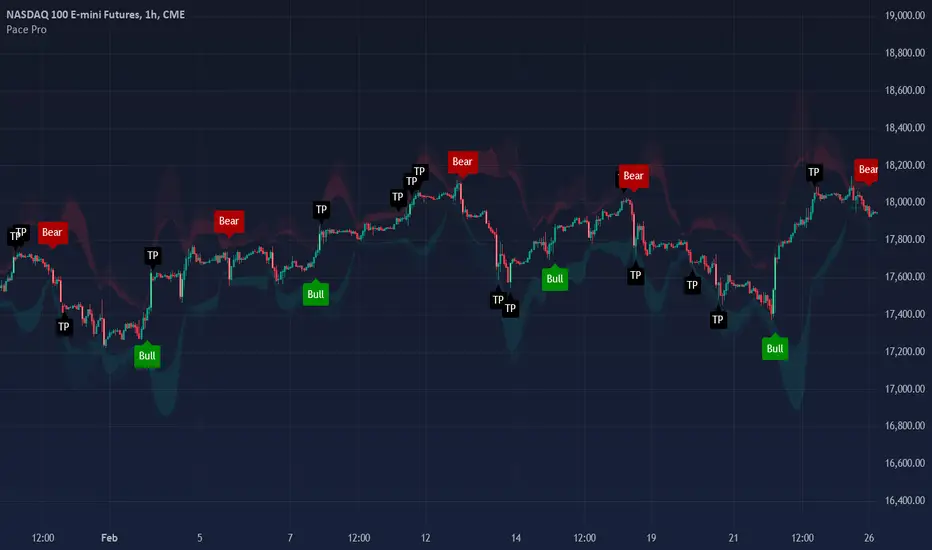
Target Trend [BigBeluga]The Target Trend indicator is a trend-following tool designed to assist traders in capturing directional moves while managing entry, stop loss, and profit targets visually on the chart. Using adaptive SMA bands as the core trend detection method, this indicator dynamically identifies shifts in trend direction and provides structured exit points through customizable target levels.
SP500:
🔵 IDEA
The Target Trend indicator’s concept is to simplify trade management by providing automated visual cues for entries, stops, and targets directly on the chart. When a trend change is detected, the indicator prints an up or down triangle to signal entry direction, plots three customizable target levels for potential exits, and calculates a stop-loss level below or above the entry point. The indicator continuously adapts as price moves, making it easier for traders to follow and manage trades in real time.
When price crosses a target level, the label changes to a check mark, confirming that the target has been achieved. Similarly, if the stop-loss level is hit, the label changes to an "X," and the line becomes dashed, indicating that the stop loss has been activated. This feature provides traders with a clear visual trail of whether their targets or stop loss have been hit, allowing for easier trade tracking and exit strategy management.
🔵 KEY FEATURES & USAGE
SMA Bands for Trend Detection: The indicator uses adaptive SMA bands to identify the trend direction. When price crosses above or below these bands, a new trend is detected, triggering entry signals. The entry point is marked on the chart with a triangle symbol, which updates with each new trend change.
Automated Targets and Stop Loss Management: Upon a new trend signal, the indicator automatically plots three price targets and a stop loss level. These levels provide traders with structured exit points for potential gains and a clear risk limit. The stop loss is placed below or above the entry point, depending on the trend direction, to manage downside risk effectively.
Visual Target and Stop Loss Validation: As price hits each target, the label beside the level updates to a check mark, indicating that the target has been reached. Similarly, if the stop loss is activated, the stop loss label changes to an "X," and the line becomes dashed. This feature visually confirms whether targets or stop losses are hit, simplifying trade management.
The indicator also marks the entry price at each trend change with a label on the chart, allowing traders to quickly see their initial entry point relative to current price and target levels.
🔵 CUSTOMIZATION
Trend Length: Set the lookback period for the trend-detection SMA bands to adjust the sensitivity to trend changes.
Targets Setting: Customize the number and spacing of the targets to fit your trading style and market conditions.
Visual Styles: Adjust the appearance of labels, lines, and symbols on the chart for a clearer view and personalized layout.
🔵 CONCLUSION
The Target Trend indicator offers a streamlined approach to trend trading by integrating entry, target, and stop loss management into a single visual tool. With automatic tracking of target levels and stop loss hits, it helps traders stay focused on the current trend while keeping track of risk and reward with minimal effort.
Signals

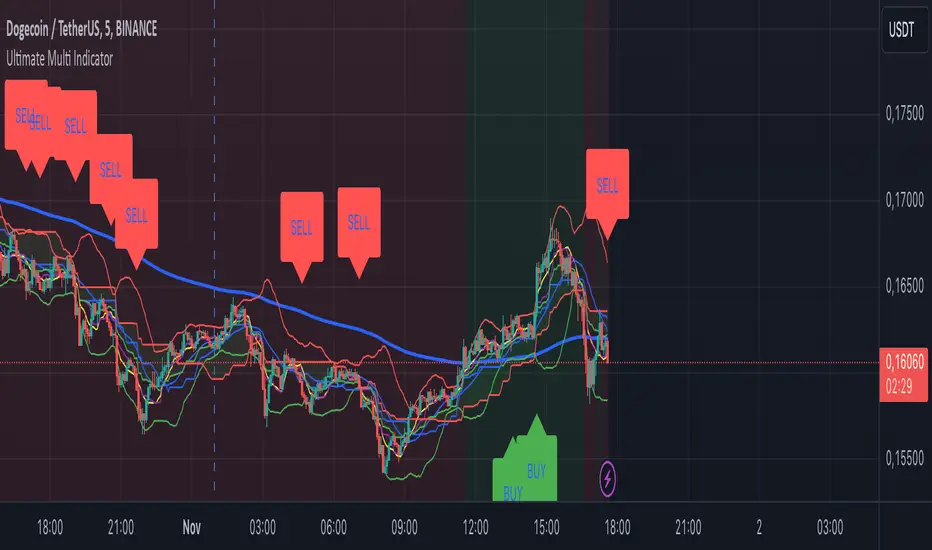
Ultimate Multi Indicator - by SachaThe Ultimate Multi Indicator: The Ultimate Guide To Profit
This custom indicator, the Ultimate Multi Indicator , integrates multiple trading indicators to have powerful buy and sell signals. I combined MACD, EMA, RSI, Bollinger Bands, Volume Profile, and Ichimoku Cloud indicators to help traders analyze both short-term and long-term price movements.
Key Components and How to Use Them
- MACD (Moving Average Convergence Divergence):
- Use for trend direction and potentiality of reversals.
- The blue line (MACD Line) crossing above the orange line (Signal Line) indicates a bullish reversal; the opposite signals a bearish reversal.
- Watch for crossovers to confirm the direction of smaller price movements.
- 200 EMA (Long) (Exponential Moving Average):
- Use to indicate a long-term trend direction.
- If the price is above the 200 EMA, the market is in an uptrend; below it suggests a downtrend.
- The chart’s background color shifts subtly green (uptrend) or red (downtrend) depending on the EMA's relative position.
- RSI (Relative Strength Index):
- Tracks momentum and overbought/oversold levels.
- RSI over 70 signifies overbought conditions; under 30 indicates oversold.
- Look for RSI turning points around these levels to identify potential reversals.
- Bollinger Bands :
- The price touching or crossing the upper Bollinger Band may mean overbought conditions are filled, while a touch at the lower band indicates oversold.
- Bollinger Band interactions often align with key reversal points, especially when combined with other signals.
- Volume Profile :
- A yellow VP line on the chart represents significant trading volume occurred.
- This line can be used as both a support and resistance level, and especially during consolidations or trend changes.
- Ichimoku Cloud :
- Identifies support/resistance levels and trend direction.
- Green and red cloud regions visually show if the price is above (bullish) or below (bearish) key levels.
- Price above the cloud (green) confirms a bullish market, while below (red) signals bearish.
Signal Conditions and Visualization
- Buy Signals :
- This is triggered right away when MACD crosses up, RSI is oversold, or price touches the lower Bollinger Band, provided price is above both the Ichimoku Cloud and the 200 EMA.
- A green “BUY” label appears below the bar, suggesting a potential entry.
- Sell Signals :
- This signal is generated when MACD crosses down, RSI is overbought, or price touches the upper Bollinger Band, and price is below the Ichimoku Cloud and the 200 EMA.
- A red “SELL” label is shown above the bar, indicating a potential exit.
Tips & Tricks
- Confirm Signals : Use multiple signals to confirm entries and exits. For example, if both the MACD and RSI align with the Ichimoku Cloud direction, the trade setup is stronger.
- Trend Directions : Only take buy signals if the price is above the 200 EMA, and sell signals if it is below, aligning trades with the overall trend.
- Adjust for Volatility : In high-volatility markets, especially in the crypto markets, pay close attention to the Bollinger Bands for breakout potential.
- Ichimoku as a Trend Guide : Use the Ichimoku Cloud as a guide for long-term support and resistance levels, especially for swing trades.
This multi-layered indicator gives a balanced blend of short-term signals and long-term trend insights, making it a versatile tool for day trading, swing trading, or even longer-term analysis.
Remember that indicators that will make you rich instantly don't exist. To expect minimum profit from them, you shouldn't trade all you have at the same time but only trade with the money you can afford to lose.
After that being said, I wish you traders luck with the Ultimate Multi Indicator!
Weekly RSI Buy/Sell SignalsWeekly RSI Buy/Sell Signal Indicator
This indicator is designed to help traders identify high-probability buy and sell opportunities on the weekly chart by using the Relative Strength Index (RSI). By utilizing weekly RSI values, this indicator ensures signals align with broader market trends, providing a clearer view of potential price reversals and continuation.
How It Works:
Weekly RSI Calculation: This script calculates the RSI using a 14-period setting, focusing on the weekly timeframe regardless of the user’s current chart view. The weekly RSI is derived using request.security, allowing for consistent signals even on intraday charts.
Signal Conditions:
Buy Signal: A buy signal appears when the RSI crosses above the oversold threshold of 30, suggesting that price may be gaining momentum after a potential bottom.
Sell Signal: A sell signal triggers when the RSI crosses below the overbought threshold of 70, indicating a possible momentum shift downwards.
Visual Cues:
Buy/Sell Markers: Clear green "BUY" and red "SELL" markers are displayed on the chart when buy or sell conditions are met, making it easy to identify entry and exit points.
RSI Line and Thresholds: The weekly RSI value is plotted in real time with color-coded horizontal lines at 30 (oversold) and 70 (overbought), providing a visual reference for key levels.
This indicator is ideal for traders looking for reliable, trend-based signals on higher timeframes and can be a helpful tool for filtering out shorter-term market noise.

Trend Levels [ChartPrime]The Trend Levels indicator is designed to identify key trend levels (High, Mid, and Low) during market trends, based on real-time calculations of highest, lowest, and mid-level values over a customizable length. Additionally, the indicator calculates trend strength by measuring the ratio of candles closing above or below the midline, providing a clear view of the ongoing trend dynamics and strength.
⯁ KEY FEATURES AND HOW TO USE
⯌ Trend Shift Signals :
Trend shifts, based on highest and lowest values during input length. When high is == to highest it will change trend to up when low == lowest value it will be shift to down trend.
// Calculate highest and lowest over the specified length
h = ta.highest(length)
l = ta.lowest(length)
// Determine trend direction: if the current high is the highest value, set trend to true
if h == high
trend := true
// If the current low is the lowest value, set trend to false
if l == low
trend := false
Whenever the trend changes direction (from uptrend to downtrend or vice versa), the indicator provides visual cues in the form of arrows. This gives traders clear signals to identify potential trend reversals, enabling them to adjust their strategies accordingly.
⯌ Trend Level Calculation :
As soon as a trend is detected (uptrend or downtrend), the indicator starts calculating the highest, lowest, and mid-level values over the defined period. These levels are plotted on the chart as color-coded lines for easy visualization, allowing traders to quickly spot the key levels within a trend.
⯌ Midline Retests :
Throughout the trend, the mid-level line is often retested, acting as a potential zone for pullbacks or rejections. Traders can use these retests as opportunities for entering positions or confirming trend continuation. The chart shows how price frequently interacts with the midline, helping to identify important reaction levels.
⯌ Trend Strength Calculation :
The indicator measures the trend strength by calculating the delta between the number of candles closing above and below the midline. This percentage-based delta is displayed in real-time, providing a clear indication of whether the trend is gaining or losing momentum.
⯁ USER INPUTS
Length : Specifies the lookback period for calculating the highest and lowest values, which determines the key trend levels.
Candle Counting : Measures the number of candles closing above and below the midline to calculate the trend strength delta.
⯁ CONCLUSION
The Trend Levels indicator provides traders with a powerful tool for visualizing trend dynamics, key levels of support and resistance, and real-time trend strength. By identifying midline retests, tracking candle counts, and providing trend shift signals, this indicator can help traders make well-informed decisions during market trends.

Fibonacci Buy /Sell SignalsHere is a Fibonacci-based Buy/Sell Indicator using retracement levels for potential support and resistance zones. This indicator plots Fibonacci levels and provides buy/sell signals based on price interaction with these levels.
Fibonacci Levels:
Highest high and lowest low over the lookback period.
Key levels: 38.2% (retracement), 50% (midpoint), 61.8% (strong retracement).
Buy Signal: When the price crosses above the 61.8% Fibonacci level (bullish).
Sell Signal: When the price crosses below the 38.2% Fibonacci level (bearish).

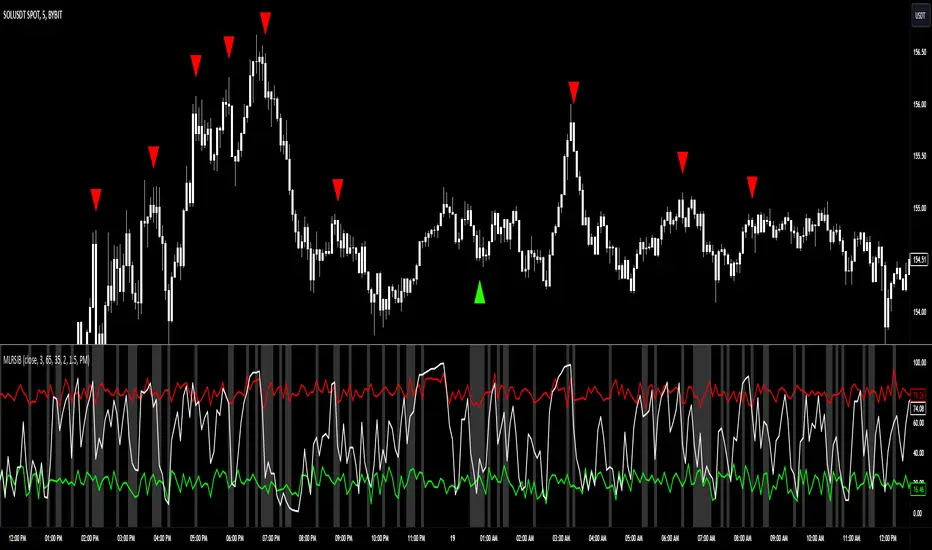
Machine Learning RSI Bands"Machine Learning RSI Bands" Indicator
The "Machine Learning RSI Bands" (MLRSIB) indicator leverages advanced algorithmic analysis to enhance traditional RSI strategies:
RSI Customization: Users can customize the RSI settings including source, length, and thresholds for overbought/oversold conditions.
Innovative Machine Learning Application: The script uses a proprietary function FOUNDATION_400x10x2 from the 'FOUNDATION' library, which analyzes the last 400 occurrences of data points, considering various market dynamics like volume changes or RSI movements based on the selected sampling method. Outputs four optimal outcomes for both upper and lower band conditions, representing the most statistically significant patterns or predictions.
Dynamic Band Visualization: Plots the average of these four outcomes as colored lines (red for the upper band, green for the lower band) on the chart, serving as dynamic support and resistance or overbought/oversold levels.
Signal Plotting: Displays triangles above or below the bars to signal potential short or long entries when the RSI crosses these machine learning-adjusted bands under certain confidence conditions.
Market Volatility Indicator: Adjusts the chart's background color based on volatility, using an average deviation analysis to gauge market calmness or agitation.
Alert System: Provides alert conditions for when these sophisticated signals are triggered, allowing for timely trading actions.
This indicator is designed for traders interested in combining traditional technical analysis with machine learning to refine their market entry and exit strategies, focusing on patterns identified from recent market behavior.
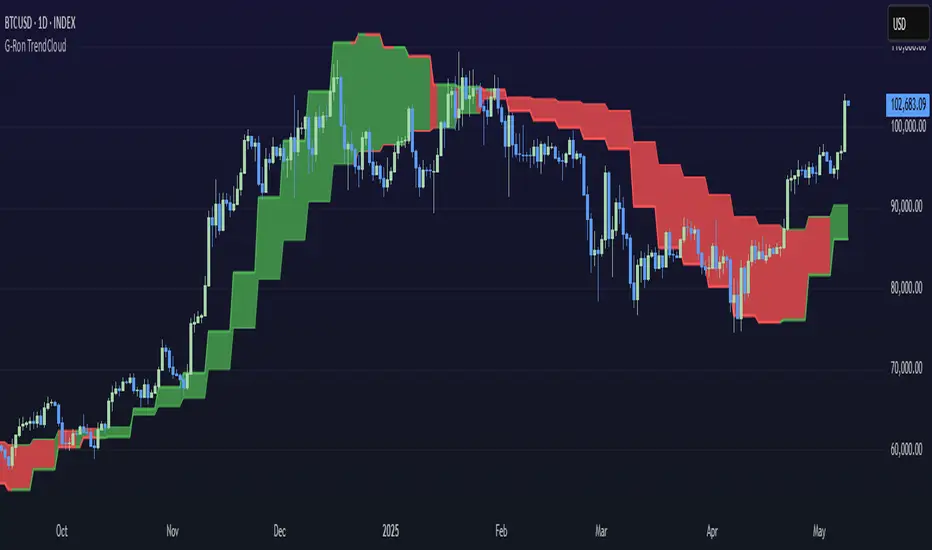
G-Ron TrendCloudOverview
The G-Ron TrendCloud Indicator is a powerful trading tool designed to identify trend momentum and potential reversals across multiple timeframes. Using cloud-based visualizations, this indicator provides clear, actionable signals, making it ideal for all traders.
How Does It Work?
The G-Ron TrendCloud uses advanced differential calculations to pinpoint key momentum levels in the market. It identifies both trend continuation and reversals, highlighting strong momentum shifts with clear visual cues.
Key Features
Trend Cloud – This cloud highlights the dominant market trend, indicating whether the market is trending upwards or downwards.
Reversal Cloud – This cloud provides early warning signals of potential trend reversals, helping traders time entries and exits more effectively.
Trend Reversion Line – This line acts as a key pivot point in the market, indicating where the long-term trend is likely to shift.
The three components change color dynamically based on market conditions:
Yellow for uptrends
Red for downtrends
What Makes It Unique?
Many indicators rely on simple or exponential moving average crossovers. In contrast, the G-Ron TrendCloud utilizes differential equations to analyze the interaction between moving averages and pinpoint the precise price levels where significant momentum shifts—referred to as trend pivots—are likely to occur. These trend pivots are categorized by both term (short, medium, long) and direction (continuation or reversal). It's crucial to note that the components of the G-Ron TrendCloud are not moving averages, making it impossible to replicate its insights using any SMA or EMA settings.
Understanding The Components
Trend Cloud: represents the area between the short-term trend pivot line and the medium-term trend pivot line. It illustrates the prevailing market trend.
Reversal Cloud: represents the area between the medium-term trend pivot line and the reversal pivot line. It provides insights into the strength of the trend.
Trend Reversion Line: the long-term trend pivot line which acts as a mean reversion for the Trend Cloud.
How To Use It
Trend Continuation: When price is above or within the yellow Trend Cloud it signals a strong bullish trend continuation. When price is below or within the red Trend Cloud it signals a strong bearish trend continuation.
Reversal Signals: When price breaks through the Reversal Cloud it signals a change in the prevailing market trend.
Long-Term Confirmation: Bullish trends are stronger, and price is more likely to continue higher when the Trend Reversion Line is yellow. Bearish trends are stronger, and price is more likely to continue lower when the Trend Reversion Line is red.
Multi-Timeframe View: For deeper insights, use the indicator across various timeframes. Shorter timeframes are ideal for intraday trades, while longer timeframes offer better signals for position traders.
Recommended Settings
The Long-Term Timeframe interval setting should always be at least three times bigger than the current timeframe displayed on your chart.
Why It’s Invite Only
The G-Ron TrendCloud utilizes a unique methodology that cannot be replicated by standard indicators. It provides valuable insights and clear visual cues to help traders accurately identify market trends. It greatly improves decision making and timing for both trade entries and exits, increasing the likelihood of successful outcomes.
Please see the authors instructions below to get instant access to this indicator.
Zero Lag Trend Signals (MTF) [AlgoAlpha]Zero Lag Trend Signals 🚀📈
Ready to take your trend-following strategy to the next level? Say hello to Zero Lag Trend Signals , a precision-engineered Pine Script™ indicator designed to eliminate lag and provide rapid trend insights across multiple timeframes. 💡 This tool blends zero-lag EMA (ZLEMA) logic with volatility bands, trend-shift markers, and dynamic alerts. The result? Timely signals with minimal noise for clearer decision-making, whether you're trading intraday or on longer horizons. 🔄
🟢 Zero-Lag Trend Detection : Uses a zero-lag EMA (ZLEMA) to smooth price data while minimizing delay.
⚡ Multi-Timeframe Signals : Displays trends across up to 5 timeframes (from 5 minutes to daily) on a sleek table.
📊 Volatility-Based Bands : Adaptive upper and lower bands, helping you identify trend reversals with reduced false signals.
🔔 Custom Alerts : Get notified of key trend changes instantly with built-in alert conditions.
🎨 Color-Coded Visualization : Bullish and bearish signals pop with clear color coding, ensuring easy chart reading.
⚙️ Fully Configurable : Modify EMA length, band multiplier, colors, and timeframe settings to suit your strategy.
How to Use 📚
⭐ Add the Indicator : Add the indicator to favorites by pressing the star icon. Set your preferred EMA length and band multiplier. Choose your desired timeframes for multi-frame trend monitoring.
💻 Watch the Table & Chart : The top-right table dynamically updates with bullish or bearish signals across multiple timeframes. Colored arrows on the chart indicate potential entry points when the price crosses the ZLEMA with confirmation from volatility bands.
🔔 Enable Alerts : Configure alerts for real-time notifications when trends shift—no need to monitor charts constantly.
How It Works 🧠
The script calculates the zero-lag EMA (ZLEMA) by compensating for data lag, giving traders more responsive moving averages. It checks for volatility shifts using the Average True Range (ATR), multiplied to create upper and lower deviation bands. If the price crosses above or below these bands, it marks the start of new trends. Additionally, the indicator aggregates trend data from up to five configurable timeframes and displays them in a neat summary table. This helps you confirm trends across different intervals—ideal for multi-timeframe analysis. The visual signals include upward and downward arrows on the chart, denoting potential entries or exits when trends align across timeframes. Traders can use these cues to make well-timed trades and avoid lag-related pitfalls.

Linear Regression ChannelLinear Regression Channel Indicator
Overview:
The Linear Regression Channel Indicator is a versatile tool designed for TradingView to help traders visualize price trends and potential reversal points. By calculating and plotting linear regression channels, bands, and future projections, this indicator provides comprehensive insights into market dynamics. It can highlight overbought and oversold conditions, identify trend direction, and offer visual cues for future price movements.
Key Features:
Linear Regression Bands:
Input: Plot Linear Regression Bands
Description: Draws bands based on linear regression calculations, representing overbought and oversold levels.
Customizable Parameters:
Length: Defines the look-back period for the regression calculation.
Deviation: Determines the width of the bands based on standard deviations.
Linear Regression Channel:
Input: Plot Linear Regression Channel
Description: Plots a channel using linear regression to visualize the main trend.
Customizable Parameters:
Channel Length: Defines the look-back period for the channel calculation.
Deviation: Determines the channel's width.
Future Projection Channel:
Input: Plot Future Projection of Linear Regression
Description: Projects a linear regression channel into the future, aiding in forecasting potential price movements.
Customizable Parameters:
Length: Defines the look-back period for the projection calculation.
Deviation: Determines the width of the projected channel.
Arrow Direction Indicator:
Input: Plot Arrow Direction
Description: Displays directional arrows based on future projection, indicating expected price movement direction.
Color-Coded Price Bars:
Description: Colors the price bars based on their position within the regression bands or channel, providing a heatmap-like visualization.
Dynamic Visualization:
Colors: Uses a gradient color scheme to highlight different conditions, such as uptrend, downtrend, and mid-levels.
Labels and Markers: Plots visual markers for significant price levels and conditions, enhancing interpretability.
Usage Notes
Setting the Length:
Adjust the look-back period (Length) to suit the timeframe you are analyzing. Shorter lengths are responsive to recent price changes, while longer lengths provide a broader view of the trend.
Interpreting Bands and Channels:
The bands and channels help identify overbought and oversold conditions. Price moving above the upper band or channel suggests overbought conditions, while moving below the lower band or channel indicates oversold conditions.
Using the Future Projection:
Enable the future projection channel to anticipate potential price movements. This can be particularly useful for setting target prices or stop-loss levels based on expected trends.
Arrow Direction Indicator:
Use the arrow direction indicator to quickly grasp the expected price movement direction. An upward arrow indicates a potential uptrend, while a downward arrow suggests a potential downtrend.
Color-Coded Price Bars:
The color of the price bars changes based on their relative position within the regression bands or channel. This heatmap visualization helps quickly identify bullish, bearish, and neutral conditions.
Dynamic Adjustments:
The indicator dynamically adjusts its visual elements based on user settings and market conditions, ensuring that the most relevant information is always displayed.
Visual Alerts:
Pay attention to the labels and markers on the chart indicating significant events, such as crossovers and breakouts. These visual alerts help in making informed trading decisions.
The Linear Regression Channel Indicator is a powerful tool for traders looking to enhance their technical analysis. By offering multiple regression-based visualizations and customizable parameters, it helps identify key market conditions, trends, and potential reversal points. Whether you are a day trader or a long-term investor, this indicator can provide valuable insights to improve your trading strategy.

Slark Signal - Telegram Alert---
Indicator Description: Slark Signal - Telegram Alert
The Slark Signal - Telegram Alert is a custom trading indicator designed to detect potential buy and sell signals based on pivots and trendlines. This indicator sends real-time alerts via Telegram when specific market conditions are met and provides automatic Stop-Loss (SL) and Take-Profit (TP) levels for better trade management.
---
What Does the Indicator Do?
Pivot-Based Signals: Detects significant pivot highs and lows to identify potential trend reversals.
Automatic SL and TP Levels: Projects customizable Stop-Loss and Take-Profit levels on the chart based on user-defined parameters.
Telegram Alerts: Sends buy or sell signals with relevant trade details (entry price, SL, and TP) to your Telegram channel when conditions are met.
Session-Based Signals: Limits the signals to a specific trading session (8:00 - 10:00).
---
How Does the Indicator Work?
Customizable Input Parameters:
- Pivot Detection Length: Defines the length used to detect pivot highs and lows.
- Slope Multiplier: Controls the slope of trendlines based on ATR.
- Session Start and End Hours: Specifies the time window during which signals can be generated.
- SL and TP Ticks: Defines the distance (in ticks) for Stop-Loss and Take-Profit levels.
- Telegram Chat ID: Input your Telegram chat ID to receive alerts in your Telegram channel.
Pivot Highs and Lows Detection:
- The indicator calculates pivot highs (PH) and pivot lows (PL) over the specified period, drawing trendlines for both based on the slope multiplier.
- Trendline Breakouts: When the price crosses above the upper trendline or below the lower trendline, it generates a buy or sell signal.
Signal Generation and Trade Levels:
- If a buy signal is detected, the indicator automatically sets and displays the entry price, Stop-Loss, and Take-Profit levels.
- The same applies for sell signals when a sell condition is met.
- Signals are valid only within the defined trading session (8:00 - 10:00).
Telegram Alerts:
- When a buy or sell signal is triggered, an alert with the trade details (entry price, SL, and TP) is sent to your Telegram chat via the chat ID you have provided.
---
How to Use the Indicator?
Set Up Input Parameters:
- Pivot Detection Length: Set the period for detecting pivot highs and lows (default: 5).
- Slope Multiplier: Adjust the slope multiplier for trendlines based on ATR (default: 0.4).
- SL and TP Ticks: Define the tick distance for SL and TP (default: SL = 100, TP = 300).
- Session Start and End Hours: Set the time window for signal generation (default: 8:00 - 10:00).
- Telegram Chat ID: Input your Telegram channel’s chat ID to receive alerts.
Interpreting Buy and Sell Signals:
- Buy Signal: When a buy condition is met, a label "COMPRA" is shown below the bar, and the system sends the signal to Telegram with all trade details.
- Sell Signal: When a sell condition is met, a label "VENTA" is displayed above the bar, and the system sends the corresponding alert to Telegram.
- The system ensures signals are only triggered during the defined session time (8:00 - 10:00).
Trade Planning and Risk Management:
- **Stop-Loss and Take-Profit:** Automatically drawn on the chart, use these levels to plan your trades.
- **Telegram Alerts:** Stay updated with real-time buy or sell signals in your Telegram channel for quick decision-making.
---
What Makes This Indicator Original?
Pivot and Trendline Logic: The indicator uses pivot highs and lows to draw dynamic trendlines, identifying key reversal points and breakouts.
Real-Time Telegram Alerts: Unique in its ability to send automatic alerts with detailed trade information directly to your Telegram channel, allowing you to act quickly on signals.
Built-In SL/TP Visualization: The system automatically calculates and displays SL and TP levels, making it easier to manage risk and reward.
Session-Based Signals: Helps traders focus on key trading hours by limiting signal generation to a specific time range.
---
Additional Considerations
Complement with Other Analysis: It is recommended to use this indicator in conjunction with other analysis tools to confirm trade setups.
Testing: Before using the indicator live, consider testing it on a demo account to fine-tune your settings.
Risk Management: Ensure that the SL and TP levels fit your trading strategy and risk tolerance.
Market Awareness: Stay informed about news and events that could impact market conditions during your trading session.
---
Example Configuration
To help you get started, here is an example configuration:
Pivot Detection Length: 5
Slope Multiplier: 0.4
SL Ticks: 100
TP Ticks: 300
Session Start Hour: 8
Session End Hour: 10
Telegram Chat ID: Input your unique Telegram chat ID here.
---
Conclusion
The Slark Signal - Telegram Alert indicator provides a highly customizable and automated solution for detecting buy and sell signals based on pivots and trendline breaks. By utilizing real-time alerts via Telegram, you can stay updated on key trading opportunities. It also offers automatic SL and TP levels, making trade planning and risk management straightforward.
Ready for immediate use in TradingView, this indicator can become a vital part of your trading strategy.
---

FVG Channel [LuxAlgo]The FVG Channel indicator displays a channel constructed from the averages of unmitigated historical fair value gaps (FVG), allowing to identify trends and potential reversals in the market.
Users can control the amount of FVGs to consider for the calculation of the channels, as well as their degree of smoothness through user settings.
🔶 USAGE
The FVG Channel is constructed by averaging together recent unmitigated Bullish FVGs (contributing to the creation of the upper bands), and Bearish unmitigated FVGs (contributing to the creation of the lower bands) within a lookback determined by the user. A higher lookback will return longer-term indications from the indicator.
The channel includes 5 bands, with one upper and one lower outer extremities, as well as an inner series of values determined using the Fibonacci ratios (respectively 0.786, 0.5, 0.236) from the channel's outer extremities.
An uptrend can be identified by price holding above the inner upper band (obtained from the 0.786 ratio), this band can also provide occasional support when the price retraces to it while in an uptrend.
Breaking below the inner upper band with an unwillingness to reach above again is a clear sign of hesitation in the market and can be indicative of an upcoming consolidation or reversal.
This can directly be applied to downtrends as well, below are examples displaying both scenarios.
Uptrend Example:
Downtrend Example:
🔹 Breakout Levels
When the price mitigates all FVGs in a single direction except for 1, the indicator will display a "Breakout Level". This is the level that price will need to cross in order for all FVGs in that direction to be mitigated, because of this they can also be aptly called "Last Stand Levels".
These levels can be considered as potential support and resistance levels, however, should always be monitored for breakouts since a substantial push above or below these points would indicate strong momentum.
🔹 Signals
The indicator includes Bullish and Bearish Signals, these signals fire when all FVGs for a single direction have been mitigated and an engulfing candle occurs in the opposite direction. These are reversal signals and should be used alongside other indicators to appropriately manage risk.
Note: When all FVGs in a single direction have been mitigated, the candles will change colors accordingly.
🔶 DETAILS
The script uses a typical identification method for FVGs. Once identified, the script collects and stores the mitigation levels of the respective bullish and bearish FVGs:
For Bullish FVGs this is the bottom of the FVG.
For Bearish FVGs this is the top of the FVG.
The data is managed to only consider a specific amount of FVG mitigation levels, determined by the set "Unmitigated FVG Lookback". If an FVG is mitigated, it frees up a spot in the memory for a new FVG, however, if the memory is full, the oldest will be deleted.
The averages displayed (Channel Upper and Lower) are created from 2 calculation steps, the first step involves taking the raw average of the FVG mitigation levels, and the second step applies a simple moving average (SMA) smoothing of the precedent obtained averages.
Note: To view the mitigation levels average obtained in the first step, the "Smoothing Length" can be set to 1.
🔶 SETTINGS
Unmitigated FVG Lookback: Sets the maximum number of Unmitigated FVG mitigation levels that the script will use to calculate the channel.
Smoothing Length: Sets the smoothing length for the channel to reduce noise from the raw data.

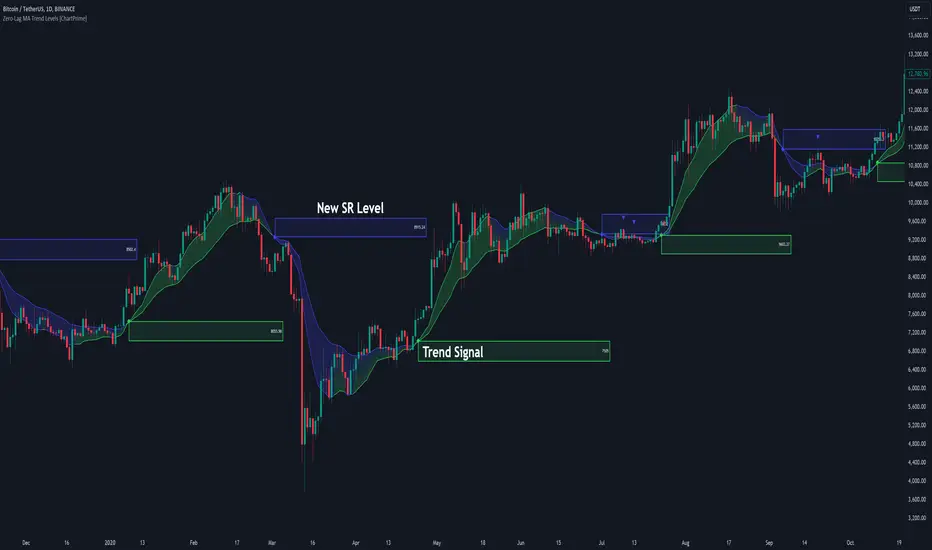
Zero-Lag MA Trend Levels [ChartPrime] The Zero-Lag MA Trend Levels indicator combines a Zero-Lag Moving Average (ZLMA) with a standard Exponential Moving Average (EMA) to provide a dynamic view of the market trend. This indicator uses a color-changing cloud to represent shifts in trend momentum and plots key levels when trend reversals are detected. The addition of trend level boxes helps identify significant price zones where market shifts occur, with retest signals aiding in spotting potential continuation or reversal points.
⯁ KEY FEATURES & HOW TO USE
⯌ Zero-Lag Moving Average (ZLMA) with EMA Cloud :
The indicator employs a Zero-Lag Moving Average (ZLMA) alongside a standard EMA.
series float emaValue = ta.ema(close, length) // EMA of the closing price
series float correction = close + (close - emaValue) // Correction factor for zero-lag calculation
series float zlma = ta.ema(correction, length) // Zero-Lag Moving Average (ZLMA)
The cloud between these averages changes color depending on the trend direction. During a downtrend, if the ZLMA begins to increase, the cloud partially turns green, signaling potential strength. Conversely, during an uptrend, if the ZLMA decreases, the cloud partially turns to the downtrend color (blue by default), indicating potential weakness.
Use : Traders can monitor the cloud's color shifts for early signs of changing momentum. A fully colored cloud aligning with the current trend indicates a strong directional move, while mixed colors suggest a potential trend change.
⯌ Trend Shift and Level Boxes :
Each time a crossover between the EMA and the ZLMA occurs, indicating a trend shift, the indicator plots a box around the price level where the shift occurred. This box remains on the chart to mark the price zone of the trend change.
Use : The boxes provide clear visual markers of where market sentiment shifted. These levels can act as support and resistance zones. Traders can use these boxes to identify potential entry or exit points when the market retests these key levels.
⯌ Retest Detection with Labels :
If the price action crosses a previously plotted trend level box, the indicator marks this event with triangle labels. An upward triangle (▲) appears when the price retests the top of a box during a bullish crossover, and a downward triangle (▼) appears when the price retests the bottom of a box during a bearish crossunder.
Use : These labels help traders identify potential continuation or reversal points at critical price levels, offering additional confirmation for trading decisions.
⯌ Dynamic Color-Coding :
The color of the ZLMA and the EMA is adjusted according to their current trend direction, with the ZLMA adopting green for upward trends and blue for downward trends. This visual representation makes it easier to quickly gauge the market's momentum at a glance.
Use : Traders can use the color-coding to quickly assess the strength and direction of the current trend, allowing for more informed decision-making.
⯁ USER INPUTS
Length : Sets the period for both the ZLMA and EMA calculations.
Trend Levels : Toggle to display the trend level boxes on the chart.
Colors (+ / -) : Define the colors for bullish and bearish trends.
⯁ CONCLUSION
The Zero-Lag MA Trend Levels - ChartPrime indicator offers a nuanced approach to trend detection by combining the ZLMA with a traditional EMA. Its dynamic cloud color changes, trend level boxes, and retest labels make it a versatile tool for traders seeking to identify trend shifts and key price zones effectively. By incorporating elements of support and resistance along with trend momentum, this indicator provides a comprehensive view of market dynamics for both trend-following and counter-trend trading strategies.
Sigma 2.0 - Advanced Buy and Sell Signal IndicatorOverview:
Sigma 2.0 is a sophisticated trading indicator designed to help traders identify potential buy and sell opportunities across various financial markets. By leveraging advanced mathematical calculations and incorporating multiple analytical tools, Sigma 2.0 aims to enhance trading strategies by providing precise entry and exit signals.
Key Features:
Advanced Sigma Calculations:
Utilizes a combination of Exponential Moving Averages (EMAs) and price deviations to calculate the Sigma lines (sigma1 and sigma2).
Detects potential trend reversals through the crossover of these Sigma lines.
Customizable Signal Filtering:
Offers the ability to filter buy and sell signals based on user-defined thresholds.
Helps reduce false signals in volatile markets by setting overbought and oversold levels.
Overbought and Oversold Detection:
Identifies extreme market conditions where price reversals are more likely.
Changes the background color of the chart to visually indicate overbought or oversold states.
Integration of Exponential Moving Averages (EMAs):
Includes EMAs of different lengths (10, 21, 55, 200) to assist in identifying market trends.
EMAs act as dynamic support and resistance levels.
Higher Timeframe Signal Incorporation:
Allows users to include signals from a higher timeframe to align trades with the broader market trend.
Enhances the reliability of signals by considering multiple timeframes.
Custom Alerts:
Provides alert conditions for both buy and sell signals.
Enables traders to receive notifications, ensuring timely decision-making.
How It Works:
Sigma Calculation Methodology:
The indicator calculates an average price (ap) and applies EMAs to derive the Sigma lines.
sigma1 represents the smoothed price deviation, while sigma2 is a moving average of sigma1.
A crossover of sigma1 above sigma2 generates a buy signal, indicating potential upward momentum.
Conversely, a crossover of sigma1 below sigma2 generates a sell signal.
Signal Filtering and Thresholds:
Users can enable filtering to only consider signals when sigma1 is below or above certain thresholds.
This helps in focusing on more significant market movements and reducing noise.
Overbought/Oversold Levels:
The indicator monitors sigma1 to detect when the market is in extreme conditions.
Background color changes provide a quick visual cue for these conditions.
EMA Analysis:
The plotted EMAs help in confirming the trend direction.
They can be used alongside Sigma signals to validate trade entries and exits.
Higher Timeframe Signals:
Incorporates signals from a user-selected higher timeframe.
Helps in aligning trades with the overall market trend, increasing the potential success rate.
How to Use:
Adding the Indicator to Your Chart:
Search for "Sigma 2.0" in the TradingView Indicators menu and add it to your chart.
Configuring the Settings:
Adjust the Sigma configurations (Channel Length, Average Length, Signal Line Length) to suit your trading style.
Set the overbought and oversold levels according to your risk tolerance.
Choose whether to filter signals by thresholds.
Select the higher timeframe for additional signal confirmation.
Interpreting the Signals:
Buy Signals:
Indicated by a green triangle below the price bar.
Occur when sigma1 crosses above sigma2 and other conditions are met.
Sell Signals:
Indicated by a red triangle above the price bar.
Occur when sigma1 crosses below sigma2 and other conditions are met.
Higher Timeframe Signals:
Plotted with lime (buy) and maroon (sell) triangles.
Help confirm signals in the current timeframe.
Utilizing EMAs:
Observe the EMAs to gauge the overall trend.
Consider aligning buy signals when the price is above key EMAs and sell signals when below.
Setting Up Alerts:
Use the built-in alert conditions to receive notifications for buy and sell signals.
Customize alert messages as needed.
Credits:
Original Concept Inspiration:
This indicator is inspired by the WaveTrend oscillator and other momentum-based indicators.
Special thanks to the original authors whose work laid the foundation for this enhanced version.
Disclaimer:
Trading involves significant risk, and past performance is not indicative of future results.
This indicator is a tool to assist in analysis and should not be the sole basis for any trading decision.
Always perform thorough analysis and consider multiple factors before entering a trade.
Note:
Ensure your chart is clean and only includes this indicator when publishing.
The script is open-source and can be modified to fit individual trading strategies.
For any questions or support, feel free to reach out or comment.

Opening Range with Breakouts & Targets [LuxAlgo]Opening Range with Breakouts & Targets is based on the long-standing Opening Range Breakout strategy popularized by traders such as Toby Crabel and Mark Fisher.
This indicator measures and displays the price range created from the first period within a new trading session, along with price breakouts from that range and targets associated with the range width.
🔶 USAGE
The Opening Range (OR) can be a powerful tool for making a clear distinction between ranging and trending trading days. Using a rigid structure for drawing a range, provides a consistent basis to make judgments and comparisons that will better assist the user in determining a hypothesis for the day's price action.
NOTE: During a suspected "Range Day", the Opening Range can be used for reversion strategies, typically targeting the opposite extreme of the range or the mean of the range. However, more commonly the Opening Range is used for breakouts on suspected "Trend Days", targeting further upward or downward market movement.
The common Opening Range Breakout Strategy (ORB) outlines a structure to enter and exit positions based on rigid points determined by the Opening Range. This methodology can be adjusted based on markets or trading styles.
Determine Opening Range High & Low: These are the high and low price within a chosen period of time after the market opens. This can be customized to the user's trading style and preference. Common Ranges are from 5-60 mins.
Watch for a Breakout with Volume: A Breakout occurs when price crosses the OR High (ORH) or OR Low (ORL), an increase in volume is typically desired when witnessing these breakouts to confirm a stronger movement.
Manage Risk: Based on user preference and the appropriately determined amount of risk, multiple ways can be determined to manage risk by using Opening Range.
For Example: A stop-loss could be set at OR Mean (ORM) or the opposite side of the range, while a profit target could optionally be set at the first price target generated by the script.
Alternatively, a user might want to use a Moving Average (MA) as an adaptive stop-loss and use price targets to scale out. These are just 2 examples of the possible options, both capable with this tool.
🔹 Signals
Signals will fire based on the break of the opening range, this is indicated by arrows above and below the range boundaries.
Optionally, a bias can be added to these signals to aid in mitigating false signals by using a directional filter based on the current day's OR relative to the previous day's OR.
Regardless of the signal bias being enabled, the Opening Range Zone will always be colored directionally according to this.
If the current day's OR is above the previous day's OR, the Zone will be Green.
If the current day's OR is below the previous day's OR, the Zone will be Red.
By enabling the signal bias, signals in the opposite direction of the daily bias will fire on the cross of the first target in that direction.
🔹 Targets
In this indicator, targets are not limited and will generate infinitely based on a % width of the Opening Range.
Additionally, there are 2 display methods for these targets.
Extended: Extends the targets to the current bar and displays all targets that have been crossed so far within the session.
Adaptive: Extends only the 2 closest targets surrounding price, allowing for a display consisting of fewer lines at one time.
🔶 DETAILS
🔹 Historical Display
This indicator can be utilized in multiple ways, for use in real-time, and for historical analysis to form methods. Because of this, the indicator has an option to display only the current day's data or the entire historical data. This can also help clean up the chart when it is in use.
🔹 Time Period
The specific time period to create the opening range is entirely up to each user's preference, by default it is set to 30 mins; however, this time period can be edited with full control if desired.
Simply toggle on the "Custom Range" and input a range of time to create the range.
🔹 Session Moving Average
The Session Moving Average is a common Moving Average, which resets at the beginning of a new session. This allows for an unbiased MA that was created entirely from the current session's price action.
Note: The start of the session is determined by the start of the Opening Range if using a custom range of time.
🔶 SETTINGS
Show Historical Data: Choose to display only the current session's data or the full history of data.
Opening Range Time Period: Select the time period to form the opening range from. This operates on Session Start, so it will change with the chart.
Custom Range: Opt for a custom Range by enabling this and inputting your range times as well as your needed timezone.
Breakout Signal Bias: Select if the Breakout Signals will use a Daily Directional Bias for firing.
Target % of Range: Sets the % of the Range width that will be used as an increment for the Targets to display in.
Target Cross Source: Choose to use the Close price or High/Low price as the crossing level for Target displays. When this source crosses a target it will generate more targets.
Target Display: Choose which style of display to use for targets.
Session Moving Average: Optionally enable a Moving average of your choice that resets at the beginning of each session (start of opening range).

Volatility Trend Bands [UAlgo]The Volatility Trend Bands is a trend-following indicator that combines the concepts of volatility and trend detection. Built using the Average True Range (ATR) to measure volatility, this indicator dynamically adjusts upper and lower bands around price movements. The bands act as dynamic support and resistance levels, making it easier to identify trend shifts and potential entry and exit points.
With the ATR multiplier, this indicator effectively captures volatility-based shifts in the market. The use of midline values allows for accurate trend detection, which is displayed through color-coded signals on the chart. Additionally, this tool provides clear buy and sell signals, accompanied by intuitive graphical markers for ease of use.
The Volatility Trend Bands is ideal for traders seeking an adaptive trend-following method that responds to changing market conditions while maintaining robust volatility control.
🔶 Key Features
Dynamic Support and Resistance: The indicator utilizes volatility to create dynamic bands. The upper band acts as resistance, and the lower band acts as support for the price. Wider bands indicate higher volatility, while narrower bands indicate lower volatility.
Customizable Inputs
You can tailor the indicator to your strategy by adjusting the:
Price Source: Select the price data (e.g., closing price) used for calculations.
ATR Length: Define the lookback period for the Average True Range (ATR) volatility measure.
ATR Multiplier: This factor controls the width of the volatility bands relative to the ATR value.
Color Options: Choose colors for the bands and signal arrows for better visualization.
Visual Signals: Arrows ("▲" for buy, "▼" for sell) appear on the chart when the trend changes, providing clear entry point indications.
Alerts: Integrated alerts for both buy and sell conditions, allowing you to receive notifications for potential trade opportunities.
🔶 Interpreting Indicator
Upper and Lower Bands: The upper and lower bands are dynamic, adjusting based on market volatility using the ATR. These bands serve as adaptive support and resistance levels. When price breaks above the upper band, it indicates a potential bullish breakout, signaling a strong uptrend. Conversely, a break below the lower band signals a bearish breakout, indicating a downtrend.
Buy/Sell Signals: The indicator provides clear buy and sell signals at breakout points. A buy signal ("▲") is generated when the price breaks above the upper band, suggesting the start of a bullish trend. A sell signal ("▼") is triggered when the price breaks below the lower band, indicating the beginning of a bearish trend. These signals help traders identify potential entry and exit points at key breakout levels.
Color-Coded Bars: The bars on the chart change color based on the trend direction. Teal bars represent bullish momentum, while purple bars signify bearish momentum. This color coding provides a quick visual cue about the market's current direction.
🔶 Disclaimer
Use with Caution: This indicator is provided for educational and informational purposes only and should not be considered as financial advice. Users should exercise caution and perform their own analysis before making trading decisions based on the indicator's signals.
Not Financial Advice: The information provided by this indicator does not constitute financial advice, and the creator (UAlgo) shall not be held responsible for any trading losses incurred as a result of using this indicator.
Backtesting Recommended: Traders are encouraged to backtest the indicator thoroughly on historical data before using it in live trading to assess its performance and suitability for their trading strategies.
Risk Management: Trading involves inherent risks, and users should implement proper risk management strategies, including but not limited to stop-loss orders and position sizing, to mitigate potential losses.
No Guarantees: The accuracy and reliability of the indicator's signals cannot be guaranteed, as they are based on historical price data and past performance may not be indicative of future results.

Smart Signals Assistant [AlgoAlpha]🟠 OVERVIEW
The Smart Signals Assistant is a comprehensive, all-in-one trading toolkit designed to provide a complete analytical framework on your chart. It is built around a primary signal engine that generates trend and reversal signals, enhanced by a suite of five optional "confluence" indicators that provide deeper market context.
This script is highly modular, allowing you to build a personalized dashboard. You can use the main signals for entries, add a machine-learning classifier to check if the market is trending, overlay dynamic support/resistance clouds, and manage your trades with on-chart take-profit and stop-loss levels. The system is tied together with a powerful, multi-step alert builder that lets you create custom alert conditions from any combination of the script's components.
🟠 CONCEPTS
This indicator is a collection of several distinct systems working together. The combination is designed to allow traders to build a complete strategy—from signal generation to confirmation and trade management—within a single tool. Here are the core concepts behind them:
Smart Signals Engine: This is the heart of the indicator and operates as a hybrid with two distinct modes. The "Swing" mode uses a proprietary model that analyzes price stability and volatility to identify stable, longer-term trends. The "Scalping" mode uses a more responsive machine-laerning trend system that dynamically adapts its parameters based on learned market 'states' to real-time changes in market conditions, making it better suited for faster, lower-timeframe movements.
Fair Value Trail (FVT): This is not a simple moving average. It's a volatility-based trail that helps identify dynamic zones of support and resistance. The concept is to track a "fair value" price, derived by analyzing price levels with significant volume activity, providing logical areas for entries or trailing stop-loss adjustments.
Trend Spine: This component calculates a core trend backbone. Its purpose is to cut through short-term noise and provide a clearer, more stable view of the underlying primary trend direction by filtering out price action during periods of low directional momentum.
Trend Bias: This is a band that measures the strength and weakness of the current price momentum. It visualizes whether bullish or bearish pressure is accelerating or decelerating by comparing recent momentum to its historical average, which is useful for confirming the conviction behind a move.
Firmament Clouds: These are dynamic zones plotted on the chart that act as potential areas of support and resistance. Unlike static lines, these clouds expand and contract based on market volatility, providing an adaptive view of key price zones where the market may be overextended.
Trend-Range Classifier (TRC): This is a machine learning model that analyzes multiple market characteristics (like volatility and momentum patterns) in real-time. It classifies the current market environment as either "trending" or "ranging," helping you decide which strategy to apply and filter signals that are inappropriate for the current conditions.
🟠 FEATURES
Trend & Reversal Signals: Configure the main engine to provide either trend-following signals or potential counter-trend reversal signals. Signals are categorized as "Normal" or "Strong" to indicate conviction.
Advanced Candle Coloring: Choose from multiple candle coloring modes, including static trend colors, a color gradient based on momentum, or a gradient based on volume. Also includes an option to highlight ranging markets with gray candles.
Automated Trade Management: Enable on-chart Take-Profit and Stop-Loss levels that are automatically calculated when a signal appears. These are visualized with colored risk/reward zones.
Component Status Table: A customizable on-chart dashboard that shows the live status, direction, and signal duration for every active component, giving you a complete overview at a glance.
Powerful Multi-Step Alert System: Build highly specific, custom alerts. You can combine dozens of built-in conditions from all components using AND/OR logic across a sequence of up to 7 steps.
External Alert Integration: The alert system can incorporate up to five external sources, allowing you to mix conditions from this script with your other favorite indicators.
🟠 USAGE
This script is designed to be adapted to your personal trading style by combining components to build a complete strategy. The synergy between the components is key to its usefulness. Here is a general workflow:
Initial Configuration: Start by enabling the core "Smart Signals" in the settings. Choose your preferred "Smart Signals Mode" (Swing or Scalping) and "Signal Mode" (Trend or Reversal) based on your strategy and timeframe.
Adding Confluence for Reliability: To increase the reliability of signals, enable one or more confluence tools. For example, a trend trader can enable the "Trend-Range Classifier" and decide to only consider signals that appear when the market is classified as "Trending." You could further enhance this by also enabling the "Fair Value Trail" and only taking buy signals that occur near or above the trail. This demonstrates how combining components filters for higher-quality setups.
Reading the Visuals: A standard "▲" or "▼" represents a normal signal, while a "+▲" or "+▼" indicates a strong signal with higher conviction. Use the candle colors to gauge the momentum within the trend.
Managing Trades: If you enable "Take-Profit Levels" and "Stop-Loss Level," the script will automatically plot these on your chart when a signal appears. This can help you pre-plan your risk and potential targets. The exit signals ("x") can be used as a suggestion for taking partial or full profits.
Setting Up Custom Alerts for High-Probability Setups: For a high-probability setup, navigate to the "Alerts" tab. You can create a sequence that combines multiple components to fire only on your ideal conditions. For instance:
Step 1: "Smart Signals Strong Bullish Signal "
Step 2: "Market Is Trending " AND "FVT In Bullish Trend "
This alert would only trigger when a strong buy signal occurs while the TRC confirms a trend and the price is in a favorable position relative to the Fair Value Trail, effectively filtering out lower-quality signals by demanding agreement between multiple, conceptually different components.
付费脚本

Adaptive RSI-Stoch with Butterworth Filter [UAlgo]The Adaptive RSI-Stoch with Butterworth Filter is a technical indicator designed to combine the strengths of the Relative Strength Index (RSI), Stochastic Oscillator, and a Butterworth Filter to provide a smooth and adaptive momentum-based trading signal. This custom-built indicator leverages the RSI to measure market momentum, applies Stochastic calculations for overbought/oversold conditions, and incorporates a Butterworth Filter to reduce noise and smooth out price movements for enhanced signal reliability.
By utilizing these combined methods, this indicator aims to help traders identify potential market reversal points, momentum shifts, and overbought/oversold conditions with greater precision, while minimizing false signals in volatile markets.
🔶 Key Features
Adaptive RSI and Stochastic Oscillator: Calculates RSI using a configurable period and applies a dual-smoothing mechanism with Stochastic Oscillator values (K and D lines).
Helps in identifying momentum strength and potential trend reversals.
Butterworth Filter: An advanced signal processing filter that reduces noise and smooths out the indicator values for better trend identification.
The filter can be enabled or disabled based on user preferences.
Customizable Parameters: Flexibility to adjust the length of RSI, the smoothing factors for Stochastic (K and D values), and the Butterworth Filter period.
🔶 Interpreting the Indicator
RSI & Stochastic Calculations:
The RSI is calculated based on the closing price over the user-defined period, and further smoothed to generate Stochastic Oscillator values.
The K and D values of the Stochastic Oscillator provide insights into short-term overbought or oversold conditions.
Butterworth Filter Application:
What is Butterworth Filter and How It Works?
The Butterworth Filter is a type of signal processing filter that is designed to have a maximally flat frequency response in the passband, meaning it doesn’t distort the frequency components of the signal within the desired range. It is widely used in digital signal processing and technical analysis to smooth noisy data while preserving the important trends in the underlying data. In this indicator, the Butterworth Filter is applied to the trigger value, making the resulting signal smoother and more stable by filtering out short-term fluctuations or noise in price data.
Key Concepts Behind the Butterworth Filter:
Filter Design: The Butterworth filter works by calculating weighted averages of current and past inputs (price or indicator values) and outputs to produce a smooth output. It is characterized by the absence of ripple in the passband and a smooth roll-off after the cutoff frequency.
Cutoff Frequency: The period specified in the indicator acts as a control for the cutoff frequency. A higher period means the filter will remove more high-frequency noise and retain longer-term trends, while a lower period means it will respond more to short-term fluctuations in the data.
Smoothing Process: In this script, the Butterworth Filter is calculated recursively using the following formula,
butterworth_filter(series float input, int period) =>
float wc = math.tan(math.pi / period)
float k1 = 1.414 * wc
float k2 = wc * wc
float a0 = k2 / (1 + k1 + k2)
float a1 = 2 * a0
float a2 = a0
float b1 = 2 * (k2 - 1) / (1 + k1 + k2)
float b2 = (1 - k1 + k2) / (1 + k1 + k2)
wc: This is the angular frequency, derived from the period input.
k1 and k2: These are intermediate coefficients used in the filter calculation.
a0, a1, a2: These are the feedforward coefficients, which determine how much of the current and past input values will contribute to the filtered output.
b1, b2: These are feedback coefficients, which determine how much of the past output values will contribute to the current output, effectively allowing the filter to "remember" past behavior and smooth the signal.
Recursive Calculation: The filter operates by taking into account not only the current input value but also the previous two input values and the previous two output values. This recursive nature helps it smooth the signal by blending the recent past data with the current data.
float filtered_value = a0 * input + a1 * prev_input1 + a2 * prev_input2
filtered_value -= b1 * prev_output1 + b2 * prev_output2
input: The current input value, which could be the trigger value in this case.
prev_input1, prev_input2: The previous two input values.
prev_output1, prev_output2: The previous two output values.
This means the current filtered value is determined by the combination of:
A weighted sum of the current input and the last two inputs.
A correction based on the last two output values to ensure smoothness and remove noise.
In conclusion when filter is enabled, the Butterworth Filter smooths the RSI and Stochastic values to reduce market noise and highlight significant momentum shifts.
The filtered trigger value (post-Butterworth) provides a cleaner representation of the market's momentum.
Cross Signals for Trade Entries:
Buy Signal: A bullish crossover of the K value above the D value, particularly when the values are below 40 and when the Stochastic trigger is below 1 and the filtered trigger is below 35.
Sell Signal: A bearish crossunder of the K value below the D value, particularly when the values are above 60 and when the Stochastic trigger is above 99 and the filtered trigger is above 90.
These signals are plotted visually on the chart for easy identification of potential trading opportunities.
Overbought and Oversold Zones:
The indicator highlights the overbought zone when the filtered trigger surpasses a specific threshold (typically above 100) and the oversold zone when it drops below 0.
The color-coded fill areas between the Stochastic and trigger lines help visualize when the market may be overbought (likely a reversal down) or oversold (potential reversal up).
🔶 Disclaimer
Use with Caution: This indicator is provided for educational and informational purposes only and should not be considered as financial advice. Users should exercise caution and perform their own analysis before making trading decisions based on the indicator's signals.
Not Financial Advice: The information provided by this indicator does not constitute financial advice, and the creator (UAlgo) shall not be held responsible for any trading losses incurred as a result of using this indicator.
Backtesting Recommended: Traders are encouraged to backtest the indicator thoroughly on historical data before using it in live trading to assess its performance and suitability for their trading strategies.
Risk Management: Trading involves inherent risks, and users should implement proper risk management strategies, including but not limited to stop-loss orders and position sizing, to mitigate potential losses.
No Guarantees: The accuracy and reliability of the indicator's signals cannot be guaranteed, as they are based on historical price data and past performance may not be indicative of future results.

Gaussian Filter [BigBeluga]The Gaussian Filter - BigBeluga indicator is a trend-following tool that uses a Gaussian filter to smooth price data and identify directional shifts in the market. It provides dynamic signals for entering and exiting trades based on trend changes, helping traders stay aligned with the market's momentum. What sets this indicator apart is its ability to display precise entry and exit points with real-time tracking of percentage price changes, making it ideal for trend-based strategies.
SP500:
NIFTY50:
🔵 KEY FEATURES & USAGE
◉ Gaussian Filter Trend Line:
//@function GaussianFilter is used for smoothing, reducing noise, and computing derivatives of data.
//@param src (float) The source data (e.g., close price) to be smoothed.
//@param params (GaussianFilterParams) Gaussian filter parameters that include length and sigma.
//@returns (float) The smoothed value from the Gaussian filter.
gaussian_filter(float src, params) =>
var float weights = array.new_float(params.length) // Array to store Gaussian weights
total = 0.0
pi = math.pi
for i = 0 to params.length - 1
weight = math.exp(-0.5 * math.pow((i - params.length / 2) / params.sigma, 2.0))
/ math.sqrt(params.sigma * 2.0 * pi)
weights.set(i, weight)
total := total + weight
for i = 0 to params.length - 1
weights.set(i, weights.get(i) / total)
sum = 0.0
for i = 0 to params.length - 1
sum := sum + src * weights.get(i)
sum
The core functionality of the Gaussian Filter line is to show trend direction. When the trend line increases four times consecutively, it indicates an uptrend signal. Similarly, if it decreases four times in a row, it signals a downtrend. The smoothness of the filter helps traders stay on the right side of the market by filtering out noise and emphasizing the dominant trend direction.
◉ Entry and Exit Levels with Real-Time Price and Performance Data:
Each time the indicator detects a trend change, it plots an entry or exit level on the chart. For an uptrend, an entry level is marked, and for a downtrend, an exit level is plotted. These levels display the price at the time of the signal.
While the trend is ongoing, the indicator tracks the percentage change in price from the initial entry or exit signal to the current bar, updating in real-time. When a trend concludes, it displays the total percentage change from the entry or exit point to the trend's end. This feature provides valuable insights into how much the price has moved during each trend phase and allows traders to monitor the performance of each trade.
◉ Color-Coded Candlestick Representation with Trend Shift Alerts:
In addition to coloring the candlesticks based on the trend direction, the indicator also uses gray candles to highlight potential early trend shifts. For example, if the Gaussian Filter detects a downtrend but the price moves above the filter line, the candles turn gray, signaling a possible reversal or shift in momentum. Similarly, in an uptrend, if the price moves below the Gaussian Filter line, the candles turn gray as an early indication of potential bearish momentum. This visual cue helps traders stay alert to possible faster shifts in market direction, allowing for quicker decision-making.
🔵 CUSTOMIZATION
Length and Sigma for Gaussian Filter:
Adjust the length and sigma parameters to control how the Gaussian Filter smooths the price data. A longer length provides smoother trend lines, while adjusting sigma can fine-tune the level of smoothing applied.
Levels Display and Candle Coloring:
You can toggle the visibility of entry and exit levels as well as enable or disable the dynamic coloring of candlesticks based on the trend direction. The additional gray color setting provides an extra layer of information, allowing you to spot potential trend reversals early.
🔵 CONCLUSION
The Gaussian Filter indicator is a powerful tool for identifying and following market trends. By providing clear entry and exit signals, along with real-time tracking of price changes, it gives traders a structured way to manage trades and monitor performance. The color-coded candles, including gray to highlight possible trend shifts, add another dimension to visualizing market dynamics. The added flexibility of customizing colors and trend levels makes it a versatile indicator suitable for both trend-following and reversal strategies.

D-Shape Breakout Signals [LuxAlgo]The D-Shape Breakout Signals indicator uses a unique and novel technique to provide support/resistance curves, a trailing stop loss line, and visual breakout signals from semi-circular shapes.
🔶 USAGE
D-shape is a new concept where the distance between two Swing points is used to create a semi-circle/arc, where the width is expressed as a user-defined percentage of the radius. The resulting arc can be used as a potential support/resistance as well as a source of breakouts.
Users can adjust this percentage (width of the D-shape) in the settings ( "D-Width" ), which will influence breakouts and the Stop-Loss line.
🔹 Breakouts of D-Shape
The arc of this D-shape is used for detecting breakout signals between the price and the curve. Only one breakout per D-shape can occur.
A breakout is highlighted with a colored dot, signifying its location, with a green dot being used when the top part of the arc is exceeded, and red when the bottom part of the arc is surpassed.
When the price reaches the right side of the arc without breaking the arc top/bottom, a blue-colored dot is highlighted, signaling a "Neutral Breakout".
🔹 Trailing Stop-Loss Line
The script includes a Trailing Stop-Loss line (TSL), which is only updated when a breakout of the D-Shape occurs. The TSL will return the midline of the D-Shape subject to a breakout.
The TSL can be used as a stop-loss or entry-level but can also act as a potential support/resistance level or trend visualization.
🔶 DETAILS
A D-shape will initially be colored green when a Swing Low is followed by a Swing High, and red when a Swing Low is followed by a Swing High.
A breakout of the upper side of the D-shape will always update the color to green or to red when the breakout occurs in the lower part. A Neutral Breakout will result in a blue-colored D-shape. The transparency is lowered in the event of a breakout.
In the event of a D-shape breakout, the shape will be removed when the total number of visible D-Shapes exceeds the user set "Minimum Patterns" setting. Any D-shape whose boundaries have not been exceeded (and therefore still active) will remain visible.
🔹 Trailing Stop-Loss Line
Only when a breakout occurs will the midline of the D-shape closest to the closing price potentially become the new Trailing Stop value.
The script will only consider middle lines below the closing price on an upward breakout or middle lines above the closing price when it concerns a downward breakout.
In an uptrend, with an already available green TSL, the potential new Stop-Loss value must be higher than the previous TSL value; while in a downtrend, the new TSL value must be lower.
The Stop-Loss line won't be updated when a "Neutral Breakout" occurs.
🔶 SETTINGS
Swing Length: Period used for the swing detection, with higher values returning longer-term Swing Levels.
🔹 D-Patterns
Minimum Patterns: Minimum amount of visible D-Shape patterns.
D-Width: Width of the D-Shape as a percentage of the distance between both Swing Points.
Included Swings: Include "Swing High" (followed by a Swing Low), "Swing Low" (followed by a Swing High), or "Both"
Style Historical Patterns: Show the "Arc", "Midline" or "Both" of historical patterns.
🔹 Style
Label Size/Colors
Connecting Swing Level: Shows a line connecting the first Swing Point.
Color Fill: colorfill of Trailing Stop-Loss

MTF Volume Flow IndicatorThe MTF Volume Flow Indicator (MTF VFI) is an advanced and versatile tool that enhances market analysis by tracking the flow of volume across multiple timeframes. By integrating volume flow with multi-timeframe analysis, this indicator provides traders with a comprehensive understanding of market trends, momentum, and potential reversals.
Key Features
Multi-Timeframe Volume Flow Analysis: The MTF VFI computes the Volume Flow Indicator across various timeframes, ranging from 1 minute to 1 month. This multi-timeframe analysis enables traders to observe and compare volume flow dynamics across different time horizons, offering deeper insights into market behavior.
Customizable VFI Settings: The indicator includes configurable VFI parameters such as length, coefficient, and volume cutoff, allowing users to tailor the analysis to different market conditions and trading strategies. This flexibility ensures that the indicator remains relevant across diverse market environments.
Signal Line and Delta Calculations: The script features a signal line derived from the VFI and calculates the delta values (the difference between VFI and the signal line). These delta values are essential for identifying potential buy or sell signals and are presented as histograms for easy visual interpretation.
Cumulative Delta with Dynamic Bands: The indicator introduces cumulative delta, a powerful tool that combines average and median VFI values to provide a clearer picture of market sentiment. Two standard deviation bands are plotted around the cumulative delta, offering a range within which price movements are likely to remain. These bands are smoothed using a 21-period EMA, providing a more refined view of market volatility.
Multi-Timeframe and Analysis Tables: The MTF VFI includes optional tables that display VFI, signal line, and delta values across all selected timeframes. Additionally, an analysis table presents key statistical metrics such as the highest, lowest, average, standard deviation, range, and median VFI values. These tables provide a concise summary of market conditions, aiding in strategic decision-making.
Dynamic Display Options: The indicator offers extensive customization options, allowing traders to display or hide elements such as delta histograms, delta bands, and tables. This ensures that users can focus on the most relevant information for their trading strategy.
Neutral Candle Coloring Option: Traders can enable neutral candle colors, where bearish candles are gray and bullish candles are white. This feature helps to reduce noise and maintain focus on the overall trend and volume flow analysis.
How It Works
Volume Flow Indicator Calculation: The VFI is calculated using a combination of typical price, volume, and the standard deviation of price changes. The indicator smooths the VFI based on user preferences, allowing traders to adjust the sensitivity of the analysis to better match their trading style.
Multi-Timeframe Integration: The script pulls VFI calculations from multiple timeframes, providing a holistic view of market trends. By analyzing VFI across different timeframes, traders can detect alignments or divergences in volume flow that might indicate trend strength or weakness.
Cumulative Delta and Dynamic Bands: The cumulative delta is computed by combining the average and median VFI values. Dynamic two-standard-deviation bands are plotted around this cumulative delta, providing upper and lower bounds for expected price movements. These bands are further smoothed with a 21-period EMA, enhancing their effectiveness in volatile markets.
Delta Analysis and Histogram Display: The difference between the VFI and its signal line (delta) is calculated and displayed as histograms. This visual representation helps traders quickly assess momentum and identify potential reversals or trend continuations. The cumulative delta is color-coded dynamically based on its direction, adding an extra layer of visual clarity.
Alerts
VFI Crossover Alerts: The indicator includes customizable alerts that notify traders when the VFI crosses above or below its signal line. These alerts are crucial for catching potential trend reversals or continuation signals, even when the trader is not actively monitoring the chart.
Customizable Alert Conditions: Traders can tailor alert conditions to their preferred timeframes and VFI settings, ensuring that the notifications they receive are relevant and timely for their specific trading strategies.
Application
Trend Identification and Confirmation: The MTF VFI aids in identifying and confirming trends by analyzing volume flow across multiple timeframes. This capability is particularly useful for detecting trends that may not be visible on a single timeframe.
Momentum and Divergence Analysis: By comparing VFI and delta values across timeframes, and analyzing cumulative delta with dynamic bands, traders can gain insights into market momentum and potential divergences, which are often precursors to reversals.
Strategic Decision-Making: With its comprehensive multi-timeframe analysis, cumulative delta, and statistical summaries, the MTF VFI equips traders with the information needed to make informed trading decisions, whether for short-term trades or long-term investments.
Visual Clarity and Customization: The indicator’s dynamic display options and neutral candle coloring help traders maintain a clear and focused view of the market, customizing the visualization to match their specific needs.
The MTF Volume Flow Indicator (MTF VFI) by CryptoSea is an essential tool for traders who seek to gain a deeper understanding of market trends and volume dynamics across multiple timeframes. Its advanced features and customization options make it a valuable addition to any trader’s toolkit.
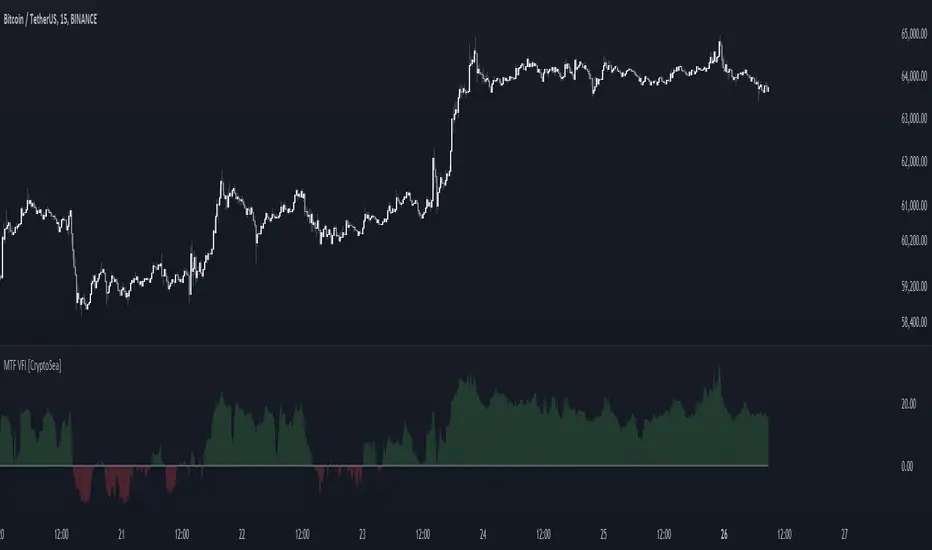
Ehlers Band-Pass FilterHeyo,
This indicator is an original translation from Ehlers' book "Cycle Analytics for Traders Advanced".
First, I describe the indicator as usual and later you can find a very insightful quote of the book.
Key Features
Signal Line: Represents the output of the band-pass filter, highlighting the dominant cycle in the data.
Trigger Line: A leading indicator derived from the signal line, providing early signals for potential market reversals.
Dominant Cycle: Measures the dominant cycle period by counting the number of bars between zero crossings of the band-pass filter output.
Calculation:
The band-pass filter is implemented using a combination of high-pass and low-pass filters.
The filter's parameters, such as period and bandwidth, can be adjusted to tune the filter to specific market cycles.
The signal line is normalized using an Automatic Gain Control (AGC) to provide consistent amplitude regardless of price swings.
The trigger line is derived by applying a high-pass filter to the signal line, creating a leading
waveform.
Usage
The indicator is effective in identifying peaks and valleys in the market data.
It works best in cyclic market conditions and may produce false signals during trending periods.
The dominant cycle measurement helps traders understand the prevailing market cycle length, aiding in better decision-making.
Quoted from the Book
Band-Pass Filters
“A little of the data narrowly passed,” said Tom broadly.
Perhaps the least appreciated and most underutilized filter in technical analysis is the band-pass filter. The band-pass filter simultaneously diminishes the amplitude at low frequencies, qualifying it as a detrender, and diminishes the amplitude at high frequencies, qualifying it as a data smoother.
It passes only those frequency components from input to output in which the trader is interested. The filtering produced by a band-pass filter is superior because the rejection in the stop bands is related to its bandwidth. The degree of rejection of undesired frequency components is called selectivity. The band-stop filter is the dual of the band-pass filter. It rejects a band of frequency components as a notch at the output and passes all other frequency components virtually unattenuated. Since the bandwidth of the deep rejection in the notch is relatively narrow and since the spectrum of market cycles is relatively broad due to systemic noise, the band-stop filter has little application in trading.
Measuring the Cycle Period
The band-pass filter can be used as a relatively simple measurement of the dominant cycle.
A cycle is complete when the waveform crosses zero two times from the last zero crossing. Therefore, each successive zero crossing of the indicator marks a half cycle period. We can establish the dominant cycle period as twice the spacing between successive zero crossings.
When we measure the dominant cycle period this way, it is best to widen the pass band of the band-pass filter to avoid distorting the measurement simply due to the selectivity of the filter. Using an input bandwidth of 0.7 produces an octave-wide pass band. For example, if the center period of the filter is 20 and the relative bandwidth is 0.7, the bandwidth is 14. That means the pass band of the filter extends from 13-bar periods to 27-bar periods.
That is, roughly an octave exists because the longest period is twice the shortest period of the pass band. It is imperative that a high-pass filter is tuned one octave below the half-bandwidth edge of the band-pass filter to ensure a nominal zero mean of the filtered output. Without a zero mean, the zero crossings can have a substantial error.
Since the measurement of the dominant cycle can vary dramatically from zero crossing to zero
crossing, the code limits the change between measurements to be no more than 25 percent.
While measuring the changing dominant cycle period via zero crossings of the band-pass waveform is easy, it is not necessarily the most accurate method.
Best regards,
simwai
Good Luck with your trading! 🙌

Rising & Falling Window Signals [LuxAlgo]The Rising & Falling Window Signals indicator identifies Rising & Falling Window formations on the chart and manages them for use as support and resistance zones. The Rising and Falling Window methods used in this indicator are based on Steve Nison's techniques, emphasizing the importance of these areas to better identify continuation momentum and likely reversal points.
Various filtering settings are included to identify zones of a specific width, as well as hide shorter zones from displaying on their chart, helping the users focus on the most significant zones.
🔶 USAGE
A Window (Rising or Falling) forms when the candle wicks from 2 consecutive candlesticks do not overlap, causing a gap. This gap is considered as a strong market sentiment of upward or downward movement, allowing traders to anticipate the likely direction of future prices.
The formation of a Rising Window is a typical indication that a bullish trend is likely to follow.
The formation of a Falling Window is a typical indication that a bearish trend is likely to follow.
After forming a window, we can interpret the zone as a likely area of support and resistance for the price to return to and react from.
Generally, the extremities of the window are used as support and resistance levels, with opposite extremities being regarded as the strongest point of support/resistance. However, when the window is exceptionally wide, the mid-point is looked upon as the strongest point of support/resistance. Once the price closes beyond the window, the window is no longer seen as supportive.
🔶 DETAILS
The script uses a fairly simple concept and implements it with familiar size and mitigation checks. From the settings of this script, the zones can be controlled based on user preferences.
🔹 Horizontal Zone Control
Horizontal Control Settings manipulate the extension and zone display for each zone; however, these settings do not affect the identification of each zone.
Maximum Live Zone Length: This determines the maximum duration of a zone. Zones will stop extending once the zone is mitigated, or if it has reached the maximum zone length determined by this setting.
Minimum Inactive Zone Length: This will hide mitigated (inactive) zones that are shorter than this setting value, this is used to free up the chart from irrelevant zones.
Extend Historical Zones on Touch: If a zone is unmitigated, but has stopped extending, it is considered a "historical" zone. If the price returns to a historical zone, this setting will cause it to extend to the current bar.
🔹 Vertical Zone Control
Vertical Control Settings filter out windows that are wider or thinner than the desired width range. Each of these settings is specified as "ATR Multipliers".
Minimum Width: Filters out any zones whose width is lower than ATR * Minimum Width.
Maximum Width: Filters out any zones whose width is higher than ATR * Maximum Width.
🔹 Signal Types
Signals are used to identify interactions with the Rising & Falling Window zones. The script has 3 different identification types to choose from:
Note: These are all bullish (rising window) examples of each signal.
Regular: The "regular" signal will fire when the price crosses above the upper extremity of an unmitigated zone.
Engulfing: The "engulfing" signal will fire when a bullish engulfing candlestick pattern occurs while one or more of the candle's wicks are touching the zone.
Wick: The "wick" signal will fire when the low of the candle is below the top of a zone, but the candle then closes above the top of the zone.
🔶 SETTINGS
🔹 Horizontal Zone Control
Maximum Live Zone Length: Maximum duration of newly formed zones.
Minimum Inactive Zone Length: Hides Zones whose length is lower than this setting.
Extend Historical Zones on Touch: Extend historical unmitigated zones when the price reaches the zone to the current bar.
🔹 Vertical Zone Control
Minimum Width: ATR multiplier used to filter out any zones whose width is lower than ATR * Minimum Width.
Maximum Width: ATR multiplier used to filter out any zones whose width is higher than ATR * Maximum Width.
Show Midlines: Determine if the zone midlines are displayed.
🔹 Signals
Show Zone Tests: Determine if signals appearing on zone tests are displayed.
Test Type: Sets the signal method for zone tests.
Signal Size: Sets label size for displayed signals.

Pace ProOverview
The Pace Pro indicator is a robust trend-following tool designed for versatile application across various timeframes and markets, including stocks, forex, futures and cryptocurrencies. It provides traders with "bull" and "bear" signals, take profit (TP) signals, and volume spike indications. This indicator aims to help traders identify potential trading opportunities through trends, reversals and price exhaustion.
Key Features
Bull and Bear Signals: Pace Pro generates green "bull" and red "bear" signals based on a trend strength score derived from an aggregation of components.
Take Profit (TP) Signals: The indicator plots black "TP" signals at areas of price exhaustion.
Volume Spike Indicators: The indicator colors candles to signify high volume spikes—light green for high bullish volume and light red for high bearish volume.
Price Clouds: The indicator includes three types of Bollinger Band clouds. These clouds help visualize exhaustion and volatility, providing traders with multiple perspectives on market dynamics.
How it works:
Trend Strength: This score is calculated using a proprietary formula that assesses the magnitude and direction of market movement with standard deviation and regression analysis. Standard deviation computes the average price over a specified period and then calculates the standard deviation of prices from this average. A linear regression is performed on the closing prices over a specified period. The slope of the regression line is used to identify the trend direction, and the standard deviation is used to assess trend stability and filter out noise, working together to clearly identify direction and robustness. Bull/Bear signals are produced based on trend strength reaching specific thresholds, configurable in the settings.
Overbought/Oversold Strength: This strength identifies price exhaustion using a unique formula that aggregates values from several indicators such as RVI, RSI and CCI. RVI captures price trends, RSI measures momentum, and CCI identifies price deviations from the mean, providing a comprehensive view of market conditions. Take profit signals are plotted at points of high price exhaustion, indicating optimal exit prices.
Volume Analysis: Volume spikes are identified and highlighted with colored candles using an ATR calculation that pinpoints outliers in volume. This is calculated using the math.abs function, identifying volume spikes in the last 14 bars. Volume spike candle size can be configured in settings to the user's liking.
Bollinger Band Clouds: The indicator employs Bollinger Band clouds based on WMA, VWMA, and EMA to provide a comprehensive view of market volatility and trend strength. WMA responds quickly to price changes, VWMA incorporates volume, and EMA smooths out data, offering a unique and adaptive perspective on market conditions. This combination is used to provide a unique perspective on market volatility, utilizing different moving averages. These clouds adapt to price fluctuations and offer visual cues to enhance trend analysis.
Utility
This tool provides traders with valuable information for trend-following and reversal strategies across different timeframes. It helps traders by:
-Generating "bull" and "bear" signals to indicate potential long, short and exit points. The precise calculation methods and statistical components used in deriving the trend strength score are designed to filter out market noise and provide a clear indication of prevailing market trends.
-Providing "TP" signals at areas of price exhaustion, areas where taking profit is optimal. These also serve as potential reversal points in the market as they incorporate reversion analysis techniques.
-Highlighting high volume spikes with colored candles to indicate significant market activity. These volatile candles can indicate a significant and rapid surge in price.
-Offering visual insights through Bollinger Band clouds, which help traders assess overbought and oversold conditions on a broad scale. These aid in visualizing potential reversals in the market.
Rationale and Benefits of Component Combination
The combination of trend strength, overbought/oversold strength, volume analysis, and Bollinger Band clouds provides a holistic approach to market analysis and allows users to use various techniques of trading analysis to make sound trading decisions. Each component serves a distinct purpose:
-Trend Strength identifies and confirms the direction and magnitude of market trends, offering clear bull and bear signals. A trend score is calculated to clearly identify where price is strongly trending and where it is quite weak. This customizable feature allows traders to configure this indicator to their liking by only plotting signals when the trend reaches a desired threshold.
-Overbought/Oversold Strength pinpoints areas of price exhaustion, providing crucial take profit and reversal conditions in the market. I combine RSI, RVI, and CCI to provide a more robust reversion score. My rationale for this is to leverage data from multiple indicators, to ensure a comprehensive assessment of price exhaustion rather than relying on a single source.
-Volume Analysis highlights significant market activity, giving traders insights into potential price movements. This feature is included to provide users with a visual representation of price pumps/dumps, that can aid in trading decisions in combination with entry and exit signals.
-Bollinger Band Clouds offer a visual representation of market volatility and trend strength, enhancing the overall analytical framework. Bands were calculated using a mixture of WMA, VWMA, and EMA to diversify data and to bring variety to its display. This can enhance its use as it does not use a single data source and relies on multiple.
Uniqueness:
This indicator stands out due to its innovative integration of standard deviation and regression analysis, offering traders a unique and comprehensive market analysis tool. By combining standard deviation to measure volatility and filter out noise with regression analysis to identify trend direction and strength, it provides insightful trend signals that help traders make informed decisions. This indicator's versatility is enhanced by its customizable settings, allowing traders to adapt it to their specific needs and trading styles with the trend sensitivity setting. Combining RSI, RVI, and CCI for reversion and exit points is unique as it integrates multiple perspectives on price momentum and volatility, providing a more comprehensive assessment of price exhaustion than using any single indicator. Combining WMA, EMA, and VWMA as bands is beneficial and unique as it blends different averaging methods to offer a more nuanced and adaptive view of market volatility and trend strength.
By integrating these components, it delivers a multifaceted tool that addresses various aspects of market analysis, making it a valuable asset for traders seeking to improve their decision-making process.
Disclaimer
Trading involves substantial risk and is not suitable for every investor. This indicator is designed to assist in decision-making but does not guarantee profits or prevent losses. Always conduct your own research and consider seeking advice from a financial professional.