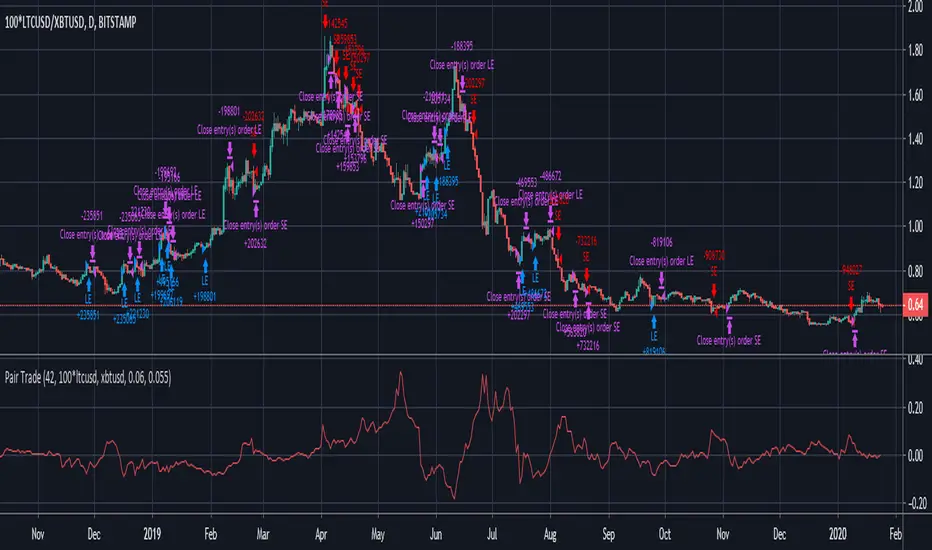
Pair Trade cryptoPair trade for crypto with inputs:
* length of correlation and moving average
* trade pair
* spread threshold to enter long / short
* spread threshold to exit long / short
简单移动平均线(SMA)
Pair TradePair trade with inputs:
* length of correlation and moving average
* trade pair
* spread threshold to enter long / short
* spread threshold to exit long / short

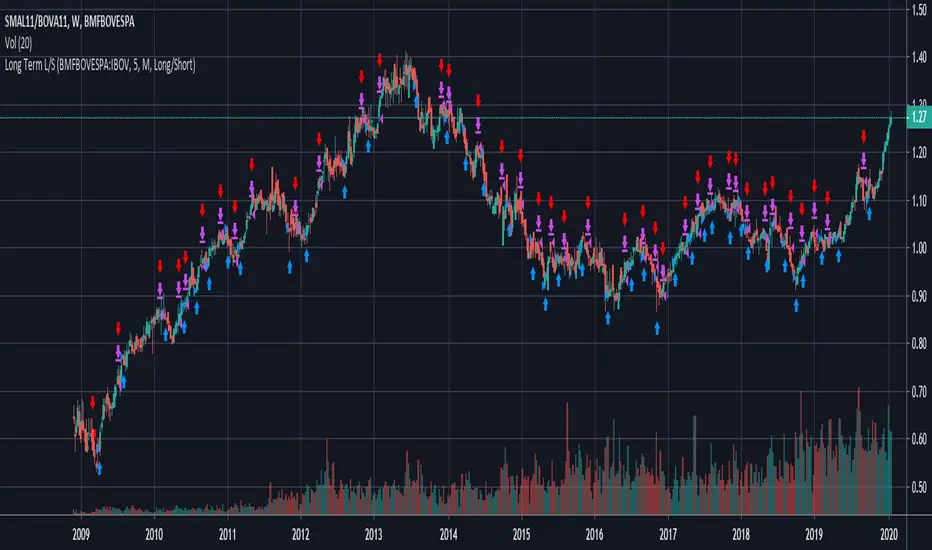
Long Term Long/Short Strategy (Pair Trading)Longing or shorting an asset ratio depending on long term trend.
Long term trend is defined by crossing of an asset or index and its SMA.
Input values:
* trend asset
* SMA configuration (periods, resolution)
* strategy: long only, long/short, short only
Simple Moving Average - ATR Trailing StopThe old adage goes "Cut losers fast and let the winners run"
With this in mind, this will plot a dynamic trailing stop by subtracting any multiplier of the Average True Range (ATR) from the SMA of your choice.

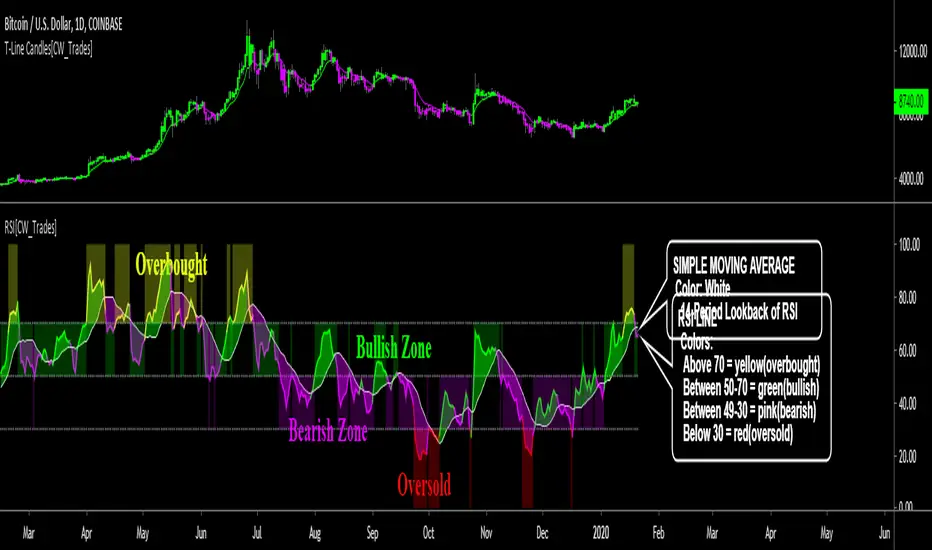
Relative Strength IndexThe relative strength index (RSI) is a momentum indicator that measures the magnitude of recent price changes to evaluate overbought or oversold conditions in the price of a stock or other asset. The RSI is displayed as an oscillator (a line graph that moves between two extremes) and can have a reading from 0 to 100. The indicator was originally developed by J. Welles Wilder Jr. and introduced in his seminal 1978 book, New Concepts in Technical Trading Systems.
Traditional interpretation and usage of the RSI are that values of 70 or above indicate that a security is becoming overbought or overvalued and may be primed for a trend reversal or corrective pullback in price. An RSI reading of 30 or below indicates an oversold or undervalued condition...more here .
-------------------------
*This indicator uses standard RSI settings of a 14-period lookback with a midline of 50, overbought level of 70 and oversold level of 30.
This RSI indicator has been modified to include a simple moving average of the RSI, adjustable overbought and oversold horizontal lines, a color-changing RSI line, color-filled RSI horizontal levels and color-filling the space between the RSI and simple moving average.
-This simple moving average(SMA) is set to a lookback period of 14 and is plotted as a white line. As the RSI moves above and below the SMA the color of the RSI changes; when above the SMA the RSI is lime, when below he SMA the RSI is pink. Lime indicates bullish momentum for RSI, pink indicates bearish momentum for RSI.
-When the RSI line is above 70 the RSI and background both turn yellow, this indicates overbought conditions.
-When the RSI line is below 30 the RSI and background both turn red, this indicates oversold conditions.
-The backgrounds fill the levels the RSI is trading between and can be turned on/off.
-The space between the RSI and SMA is filled and can be turned on/off.
-The RSI line can be set to solid or multi-color.
-The horizontal lines can be adjusted and turned on/off.
-The SMA can be adjusted.
For crypto or volatile markets, overbought and oversold levels of 80 and 20 are recommended.
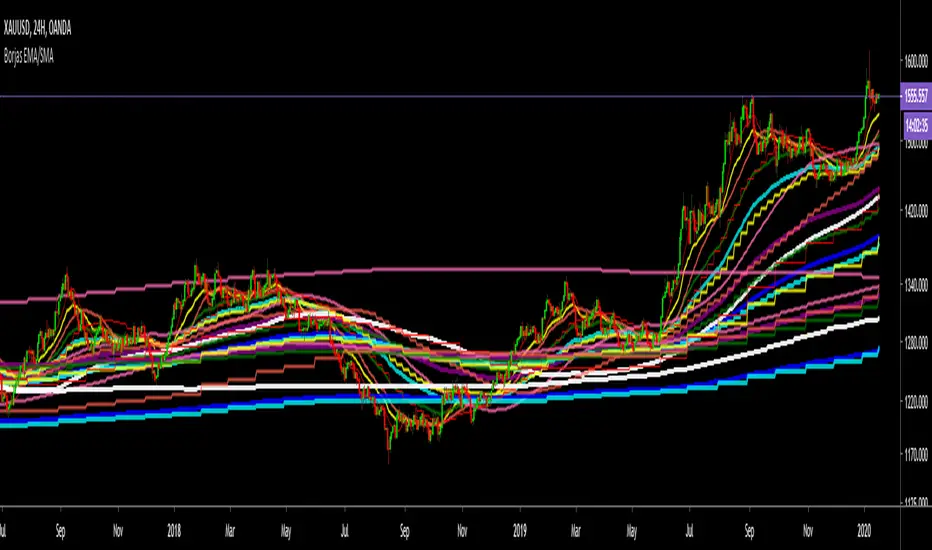
Borjas Tarh EMA/SMA Combo MTFBorjas Tarh EMA/SMA Combo MTF
Include 4 Sets of EMA s & SMA s which can apply to multiple Time Frames .
Each Moving Average can be edited or be toggled. So you can watch specific EMA s/ SMA s on other Time Frames .
© mrhashem
© Borjas Tarh Company
unRekt - KISS CrossKISS Cross is a moving average crossover and is part of the ''keeping it simple' series that have a similar color scheme. With this indicator you can select the moving average you'd like to use either SMA, EMA, WMA, or VWMA. Each moving average can be turned on or off and input changed. The first two MA's will change color on the cross from green to red depending on cross up or a cross down.

Future Label code snippet SMA Just an SMA with a label set in future candels (negative offset) code snippet
Of course u can use it instead of the nomal line.

Bollinger Band BreakoutIt is a long only strategy.
1. Buy when price breaks out of the upper band.
2. Exit has two options. Option 1 allows you to exit using lower band. Option 2 allows you to exit using moving average.
3. Option 1 preferred over option 2 if the instrument is highly volatile.
4. Slippage and commissions are not considered in the return calculation.

YJ Mean ReversionMean reversion strategy, based upon the price deviation (%) from a chosen moving average (bars). Do note that the "gains" are always relative to your starting capital, so if you set a smaller starting capital (e.g. $10000) your gains will look bigger. Also when the strategy tester has finished calculating, check the "Open P/L", as there could still be open trades.
Some Tips:
- Was designed firstly to work on an index like the S&P 500 , which over time tends to go up in value.
- Avoid trading too frequently (e.g. Daily, Weekly), to avoid getting eaten by fees.
- If you change the underlying asset, or time frame, tweaking the moving average may be necessary.
- Can work with a starting capital of just $1000, optimise the settings as necessary.
- Accepts floating point values for the amount of units to purchase (e.g. Bitcoin ).
- If price of units exceeds available capital, script will cancel the buy.
- Adjusted the input parameters to be more intuitive.

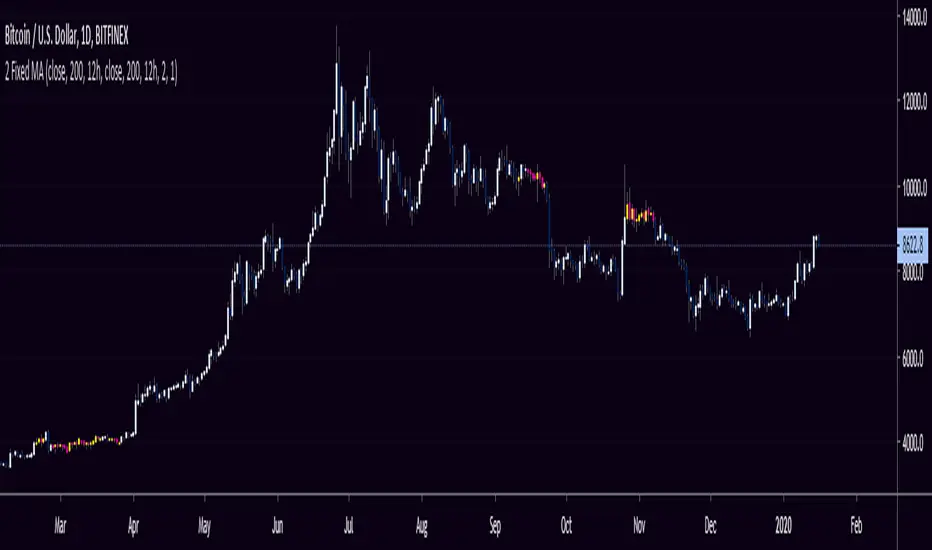
Double Fixed MAsThis is a version of my fixed MA script where 2 fixed MAs can be shown at once. Please see my "Fixed Moving Average" script for full explanation on what a fixed moving average is.
The defaults are the 12h 200 EMA and 12h 200 SMA. A strategy that can be used with these settings is as follows:
If price is caught in between the 2 moving averages, and is respecting them as support and resistance, then you can use a 12h candle close outside of the 2 MAs as a signal to long/short.
12h candle close above upper MA = look for longs
12h candle close below lower MA = look for shorts
Fully customizable.
As always, feel free to message me for any suggestions/questions.
Enjoy!
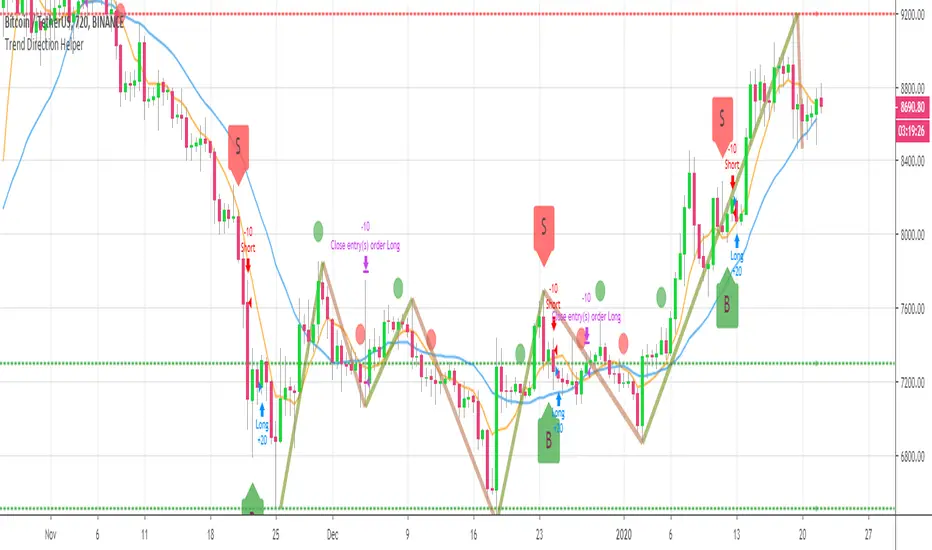
BEST Trend Direction Helper (Strategy Edition)Hello traders
A follower asked me to convert my Trend Direction Helper into a strategy
So blessed this indicator reached the 1400+ likes milestone - I can't believe how many people are trading with it
I based the setup as follow:
- Entries on those green/red labels
- exit whenever a Simple Moving Averages cross in the opposite direction happen
- possibility to filter only Longs/Shorts or both
Also...
The strategy includes the Zig Zag/Pivots high/low and other options from the indicator version. I only added a quick strategy component with a hard exit concept based on SMA cross
All the best fam and... HAPPY NEW YEAR !!!!!!!!!!!
Dave
GMA BTC1D-BYBIT-SignalA specialised Moving Average Cross Strategy script
This script allows you to set up your own alerts for automated trading. Make sure to only trigger alerts on candle close
After having spent hours on backtesting various settings for the classic MA cross strategy, I have identified a highly efficient combination for the slow and fast MA length.
This particular indicator is is tailored to trade Bitcoin 1D on Bybit and I've simplified it by removing the option to change MA lengths.
As a reminder, the MA cross strategy produces the following signals:
- BUY when the Fast MA is crossing above the Slow MA
- SELL when the Fast MA is crossing below the Slow MA

Goomba MA Cross BTC BYBITA specialised Moving Average Cross Strategy script.
After having spent hours on backtesting various settings for the classic MA cross strategy, I have identified a highly efficient combination for the slow and fast MA length.
This particular indicator is is tailored to trade B itcoin 1D on Bybit and I've simplified it by removing the option to change MA lengths.
As a reminder, the MA cross strategy produces the following signals:
- BUY when the Fast MA is crossing above the Slow MA
- SELL when the Fast MA is crossing below the Slow MA

BTC Transaction/On-Chain Volume (Basic)Description:
Whale: Whale utilizing discounted prices (increasing on-chain volume & decreasing price)
Recovering: Positive momentum in price after potential whale activity
Cycle Volume Support: The transaction volume support during a cycle
What’s the best time to invest?
After institutions make up their mind at low price levels.
How’s on-chain volume related to whales or institutional money?
On-chain volume is contributed not only by using BTC as payment methods, but more importantly by large custodians using the BTC chain to settle internal whale trades. When OTC volume is estimated 2-3 times of exchange volume, and when total on-chain volume is only a small fraction of the exchange volume, the OTC settlement plays a big factor in moving the on-chain volume around.
Why does the price drop further after spotting whale money?
Does new money equal higher true value? Yes.
Does new money equal higher price? No.
Whales could not only ladder in when they see the price on discount, but also push the price further down to accumulate at better price levels. However, either route chosen, it’s most likely for the price to rise to a higher level compared to the level when the whales enter. Whales are here to make money after all.

MACD AND SMA COMBINATION [MV]Hello everyone, This indicator based Multi-Indicator For Example MACD AND SMA.
how will come to buy signal?
When macd line crossingup signal line and sma above open bar
when will come Buy signal
or
When sma above open bar and macd line crossingup signal line
when will come Buy signal
how will come to Sell signal?
When macd line crossingdown signal line and sma below open bar
when will come sell signal
or
When sma below open bar and macd line crossingdown signal line
when will come Buy signal
if you have issues about this indicator comment there.
Thank you so much
MTF MA (yasujiy)"MTF MA" is Multiple Time Frame Moving Average looks like MT4 indicator.
You can choose MTF, Source, Length, Offset and Smoothing method.
"MTF MA"は複数時間枠に対応した移動平均でMT4の指標と同じ使い勝手になっています。
パラメータは、MTF時間枠、四本値、期間、オフセット、平均の種類を変えることができます。

Colored Moving Averages Can Help You Spot TrendsMoving averages are perhaps the most popular indicator in technical analysis. But sometimes they're not the easiest to interpret.
This indicator helps you see the trend by coloring the MA based on its direction. It's green when rising and red when falling. Of course, you can easily change that in the Style tab under Settings.
Color MA also lets you select from five different types of moving averages, including simple, exponential and Hull. We've included a list for easy reference below. Just change the "AvgType" on the Input tab under Settings.
This chart of Facebook shows the 20-day simple moving average. Notice how swings often marked turns in the stock price.
AvgType codes:
1 - Simple Moving Average
2 - Exponential Moving Average
3 - Hull Moving Average
4 - Weighted Moving Average
5 - Volume Weighted Moving Average

FearsAndHopesA strategy based on the assumption that if you buy in a panic and sell on the euphoria of the crowd, then in the long run you get a profit. The strategy is symmetrical, that is, we assume that FOMO and FUD have an equal impact on the crowd. Never make different paired parameters. Do not try to get a perfect result on the backtest. The setup is symmetrical, the program does not use EMA, requests to larger timeframes, and other things that can cause repaintings. However, if you use the value 1 in the Fast Sma Length field, repaintings is possible, use with caution. This algorithm makes me profit 2600% profit per year, which, of course, does not mean that the next year will bring the same. API history on Bitmex on request in PM. Use it as an indicator with pleasure. Access to the script and help in setting up costs 0.5 btc

2-Year MA MultiplierIndicator built by lookintobitcoin specifically for identifying ideal Bitcoin buy and sell regions.
lookintobitcoin describes this indicator as:
"The 2-Year MA Multiplier is intended to be used as a long term investment tool.
It highlights periods where buying or selling Bitcoin during those times would have produced outsized returns.
To do this, it uses a moving average (MA) line, the 2yr MA, and also a multiplication of that moving average line, 2yr MA x5.
Note: the x5 multiplication is of the price values of the 2yr moving average, not of its time period.
Buying Bitcoin when price drops below the 2yr MA (green line) has historically generated outsized returns. Selling Bitcoin when price goes above the 2yr MA x 5 (red line) has been historically effective for taking profit."

Moving AverageHello everyone This indicator Base Two simple Moving average
This is Indicator multi-condition By Default like When 200 ma above any open bar and 21 ma above any bar when match condition when came to buy single. you can also change any input
if you want any feature comment below
Thank you so much
5 SMA and VWMA indicatorIt shows 5 SMA lines (5,20,50,100,200) and VWMA (volume weighted moving average). VWMA is the best indicator for intraday charts.

BEST Mayer MultipleHello traders
I'm not a HODLer by any means. I know when to sell (or I think I know....) when an asset starts going against me too much.
Even if it's a "long-term" investment.
My mentor used to telling me this: "If a short-term trade becomes a long-term investment, then you're in for a hell of a ride".
I have no clue if Bitcoin/BTC will go back up or not - I don't even care because I'm an intraday trader.
What if BTC was actually a way to accumulate more fiat? Satoshi fooled us
I coded this Mayer Multiple according to the specifications below. By the way, I'm a big fan of Willy Woo. I've been monitoring all his work since I learned about crypto (10 minutes ago.... it's a joke come on)
charts.woobull.com
Scaling
To respect the Mayer's multiple model, I recommend to select the Logarithmic scaling as shown below
imgur.com
What Mayer's model says
Using the reference below, the model says we're in the oversold zone. But, we can be in that zone for months/years...
When a model says an asset could bounce in a 1000-7000 USD range... well... I don't know how I would be able to perform optimally with that insight. This is very subjective and not a recommendation.
Mayer's Multiple model reference
All the BEST
Dave
