MA&AOThat is quit simple strategy, which combines only two indicators: AO and MA. The logic of trades is also clear, when AO is bullish; slow ma is under the close price; fast ma > slow ma - buy.
Sma

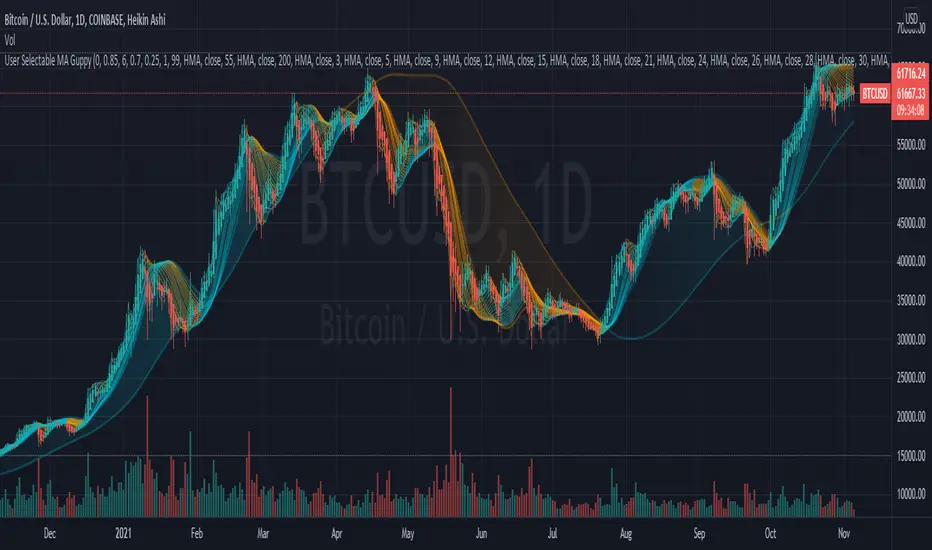
User Selectable Moving Average GuppyA version of the popular "Moving Average Ribbon" or "Guppy" indicators, except nearly everything about it is user selectable. The user can change the source, period, and type of moving average used for every single line on the chart. Note: The visuals are fairly intensive and may take a moment to catch up after adjusting settings.
Credit: This script utilizes the "Color Gradient Framework" tutorial by LucF (PineCoders) to create gradient visuals, which are also customizable for the user.
Moving Average Options:
Running (SMoothed) Moving Average (RMA or SMMA) - Slowest
Simple Moving Average (SMA) - Slow
Exponential Moving Average (EMA) - Responds faster to price than SMA
Weighted Moving Average (WMA)
Volume-Weighted Moving Average (VWMA)
Triple EMA (TEMA)
Exponential Hull Moving Average (EHMA) - Hull with Smoothing (Slower than Hull)
Least Squares Moving Average (LSMA) - Simple Linear Regression
Arnaud Legoux Moving Average (ALMA) - Adjustable, set offset=1 to be current, offset=0.85 for good smoothing (Slower)
Hull Moving Average (HMA) - Normally responds fastest to price of all options
Value Added :
This script is unique in that it allows the user to chart the "Guppy", except nearly everything about it is customizable. The user can change the source, period, and type of moving average used for every single line.
Typically, the Guppy is plotted with simple moving average or exponential moving average, which respond much slower to price than the Hull Moving Average, which this indicator uses as default. (Elimination of lag)
The Hull MA settings for the highest time frame moving averages should work well for assessing the overall macro trend, with a nice visual presentation. Additional labels and alerts for the macro trend are available.
Furthermore, this script provides many more options for type of moving average than is typical for a moving average indicator that provides the user with options, including advanced options such as Hull, TEMA, and ALMA.
The visual presentation is customizable and should provide some entertainment for users who want to create pretty charts.
7 Moving Averages [Plus]Moving Averages are price based, lagging (or reactive) indicators that display the average price of a security over a set period of time. A Moving Average is a good way to gauge momentum as well as to confirm trends, and define areas of support and resistance. Essentially, Moving Averages smooth out the “noise” when trying to interpret charts. Noise is made up of fluctuations of both price and volume. Because a Moving Average is a lagging indicator and reacts to events that have already happened, it is not used as a predictive indicator but as an interpretive one for confirmations and analysis.
Bollinger Bands (BB) are a widely popular technical analysis instrument created by John Bollinger. The BB consist of a band of three lines which are plotted in relation to security prices. The line in the middle is usually a Simple Moving Average (SMA) set to a period of 20 days (the type of trend line and period can be changed by the trader; however a 20 day moving average is by far the most popular). The SMA then serves as a base for the Upper and Lower Bands which are used as a way to measure volatility by observing the relationship between the Bands and price. Typically the Upper and Lower Bands are set to two standard deviations away from the SMA (The Middle Line); however the number of standard deviations can also be adjusted by the trader.
This script shows 6 moving averages and Bollinger Bands.
Features:
- Standard MA inputs.
- MA type.
- MA period.
- MA source.
- MA resolution (time frame).
- MA Offset.
- Forecasting : forcasted prices are calculated using our MAType and MASource for the MAPeriod.
- Trail: Show only candles not included in the MA calculation.
The color of MA1 depends on the chosen strategy, by default this is the 3EMA strategy. You can also select "Pivot Point Supertrend" or "Ichimoku Trend"
Added "Parabolic Stop and Reverse (PSAR)" . The PSAR is a time and price technical analysis tool primarily used to identify points of potential stops and reverses. In fact, the SAR in Parabolic SAR stands for "Stop and Reverse". The indicator's calculations create a parabola which is located below price during a Bullish Trend and above Price during a Bearish Trend.
Added "Linear Regression Channel" which can be correctly plotted on logarithmic charts. A linear regression channel consists of a median line with 2 parallel lines, above and below it, at the same distance. Those lines can be seen as support and resistance. The median line is calculated based on linear regression of the closing prices but the source can also be set to open, high or low. The height of the channel is based on the deviation of price to the median line. Extrapolating the channel forward can help to provide a bias and to find trading opportunities.

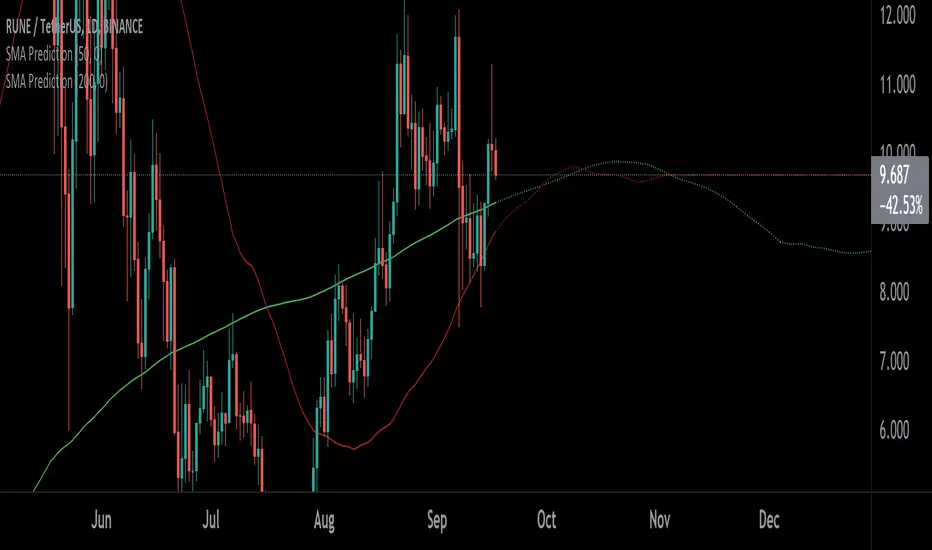
SMA PredictionThis indicator predicts future moving average (SMA) values assuming the prices remains at configured level (-50% to +50%).
It can be used to predict golden/death crosses as well - when two of these indicators are on - one configured for length 50 and one for length 200.
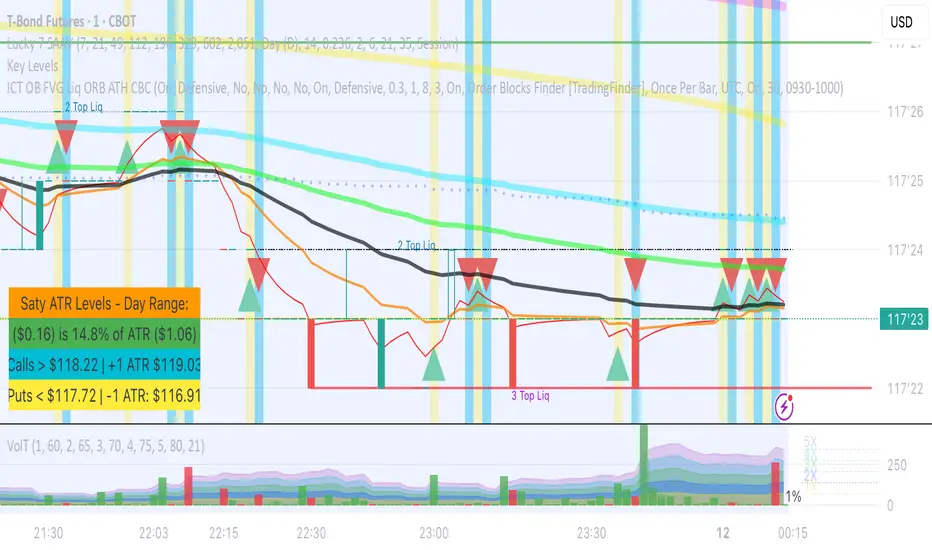
VolT by empowerTVolT is conceived to expose and alert volume volatility.
Using 21-candle moving average volume values compared to the current candle volume, you can graphically see the volume as it comes in - as a percentage of the historic 1X volume moving average.
Getting close to 2X or 5X of the 21-candle SMA? Just glance at the transparent plots behind the volume bars - or the actual percentage value in yellow.
Never wonder again how much volume that bar is compared to previous volume - now you know. Set alerts based on the volume crossing your chosen volume SMA. You'll never be surprised that the hedgies loaded up and left you behind, because you'll be right there loading up with them. (Let me know if you need help setting the alerts...)
As always, your feedback and criticisms are appreciated.
Bollinger Bands With User Selectable MABollinger Bands with user selection options to calculate the moving average basis and bands from a variety of different moving averages.
The user selects their choice of moving average, and the bands automatically adjust. The user may select a MA that reacts faster to volatility or slower/smoother.
Added additional options to color the bands or basis based on the current trend and alternate candle colors for band touches. Options:
REACT SLOW/SMOOTH TO VOLATILITY
simple moving average (Regular Bollinger Bands)
REACT SMOOTH TO VOLATILITY
exponential moving average (EMA Bollinger Bands)
weighted moving average (Weighted MA Bollinger Bands)
exponential hull moving average (Hull Bollinger Bands with better smoothing)
HIGHLY ADJUSTABLE TO VOLATILITY
Arnaud Legoux Moving average (ALMA Bollinger Bands)
Note: 0.85 ALMA default for more smoothing, set offset=1 to turn off smoothing
REACT HARSH TO VOLATILITY
least squares moving average (Least Squares Bollinger Bands)
REACT VERY FAST TO VOLATILITY
hull moving average (Hull Bollinger Bands or Hullinger Bands)
VALUE ADDED: This script is unique in that no other Bollinger Bands indicator offers a user selection for moving average, and some of the options do not exist yet as Bollinger Bands indicators.
Definitions:
Bollinger Bands: A Bollinger Band® is a technical analysis tool defined by a set of trendlines plotted two standard deviations (positively and negatively) away from a simple moving average (SMA) of a security's price, but which can be adjusted to user preferences.
Exponential Bollinger Bands: The most important characteristics of the Exponential Bollinger Bands indicator are: When the market is flat, the bands will stay much closer to prices. When the volatility is high, the bands move away from prices faster.
Hull Bollinger Bands: Bollinger Bands calculated by Hull moving average, rather than simple moving average or ema. The Hull Moving Average (HMA), developed by Alan Hull, is an extremely fast and smooth moving average. In fact, the HMA almost eliminates lag altogether and manages to improve smoothing at the same time.
Exponential Hull Bollinger Bands: Bollinger Bands calculated by Exponential Hull moving average, rather than simple moving average or ema. The Exponential Hull Moving Average is similar to the standard Hull MA, but with superior smoothing. The standard Hull Moving Average is derived from the weighted moving average (WMA). As other moving average built from weighted moving averages it has a tendency to exaggerate price movement.
Weighted Moving Average Bollinger Bands: A Weighted Moving Average (WMA) is similar to the simple moving average (SMA), except the WMA adds significance to more recent data points.
Arnaud Legoux Moving Average Bollinger Bands: ALMA removes small price fluctuations and enhances the trend by applying a moving average twice, once from left to right, and once from right to left. At the end of this process the phase shift (price lag) commonly associated with moving averages is significantly reduced. Zero-phase digital filtering reduces noise in the signal. Conventional filtering reduces noise in the signal, but adds a delay.
Least Squares Bollinger Bands: The indicator is based on sum of least squares method to find a straight line that best fits data for the selected period. The end point of the line is plotted and the process is repeated on each succeeding period.

Up/Down Indicator - DurbtradeA simple but unique indicator to show ONLY whether there is an increase or a decrease in price compared to the previous value.
Also includes a customizable SMA or EMA based "Smoothing Length" variable,
allowing the indicator to show whether the SMA or the EMA of the price
is up or down compared to the previous value.
An offset option is also included if you need it.
Settings :
Personal thoughts :
I wanted to have an indicator that showed ONLY whether the price is UP or DOWN from the previous value.
My logic was that I could have a more accurate perception of general up or down trend direction
if I removed the AMOUNT of increase or decrease happening from moment to moment over time.
From there, I added the SMA/EMA "Smoothing Length" and "Smoothing Type" variables into the script.
By increasing the value of the smoothing length above 1,
the indicator act as a color-changing moving average, except without showing an actual value.
"Smooth Length" acts just like the length of any other moving average...
When the value of the "Smooth Length" is = 1, the indicator shows whether PRICE is up or down.
When the value of the "Smooth Length" is = 50, the indicator shows whether the MOVING AVERAGE with a length of 50 is up or down.
When the value of the "Smooth Type" is = 1, the indicator is SMA based.
When the value of the "Smooth Type" is = 2, the indicator is EMA based.
As you can see in the main chart above, or in the picture below, I show the indicator in 2 different ways...
The indicator on the top shows price up/down action,
and the indicator on the bottom shows the 50 SMA up/down action :
Other key points :
The indicator height can be smashed down as small as possible and still remain 100% functional...
which is very important when chart real-estate is limited.
Here is an example of my main layout setup, with the Up/Down indicator on the top left :
As you can see, it takes up very little space, but still remains fully functional.
In the example above, I have it overlayed on the left chart price panel,
with the price visibility turned off.
If it is overlayed on the price panel like so, and you want to see both the indicator and price,
simply turn the price visibility on to see both.
Since the indicator displays itself merely by changing the color of the background,
layer order has no effect, and the indicator is always drawn in the background.
The Up/Down indicator can also be used in conjunction with other candle types
that sometimes display candle color differently than standard candles, such as heikin-ashi candles.
Just take note that the colors of the indicator may not match the colors of the heikin-ashi candles.
Finally, I looked very hard to find an indicator like this on TradingView, and found absolutely nothing.
I know that it is a simple concept, but I'm honestly surprised I couldn't find anything like it.
I have been using it for awhile now, and I'm proud of the results...
therefore, I'd like to share it with the community, along with my previously published indicators,
in the hope that you find it useful!
Outro :
A) As with my previous indicators,
this one was written while keeping information, color, clarity, chart real-estate, and customization in mind.
B) It is optimized to be displayed on all display setups...
for use on your own personal television, laptop, or cellular phone screen...
and on all chart zoom levels and layout styles.
C) Please feel free to comment your thoughts, critiques, or suggestions. They are all very helpful!
D) Check out my previous pine script indicators if you like this one. They work really well together.
E) I hope that you find this script useful.
F) Enjoy!
// Durbtrade

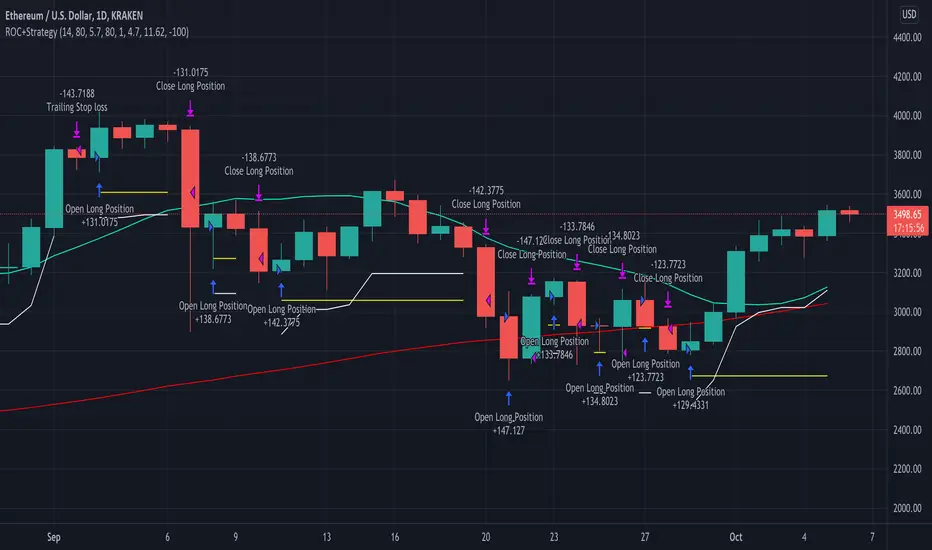
Rate of Change StrategyThis strategy calculates the rate of change over time to determine buy/sell points. This strategy is best run with 1 hour candles .
Configurable values:
SMA Fast (days)
SMA Slow (days)
SMA Reference (days)
ROC Low (%)
ROC High (%)
Order Stake (%)
Look back Candles
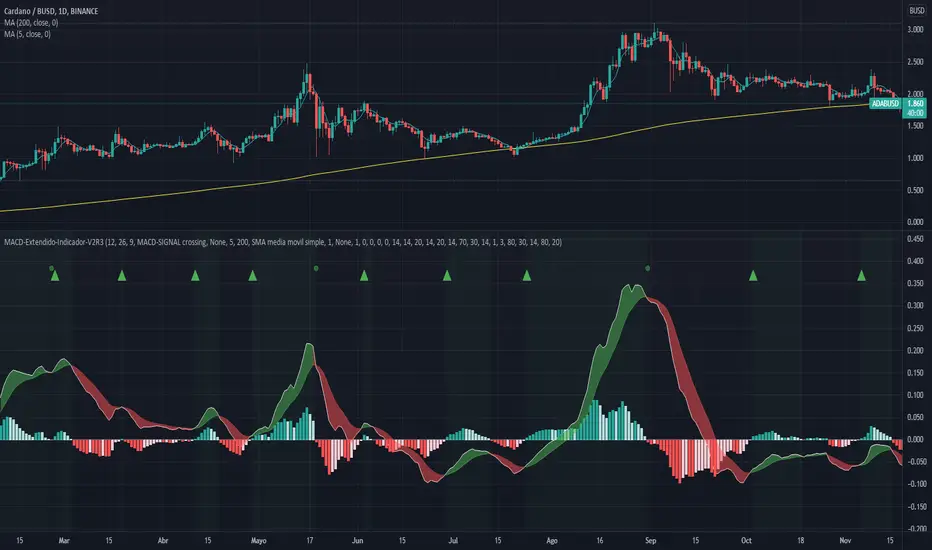
MACD-Extendido-Indicador por NeilMACD-Extendida-Estrategia
--------------------------------
DESCRIPTION
Resource that identifies entry and exit operations using the indicator
Average Convergence and Divergence Movements (MACD) and 5 strategies
INTERESTING
Novel strategies are implemented such as:
1. Overbought and oversold band to avoid horizontal movements
2. Control inputs and outputs at positions opposite the histogram line
3. Make a profit (take profit) without prior purchase orders
HOW DOES IT WORK (STRATEGIES)
1) Overbought and oversold:
Allows you to define an overbought upper band
Allows you to define an oversold ower band
Operations that occur within the band are ignored
2) Place of next operation (either side):
Indicates that the next operation can occur on either side of the histogram
3) Place of next operation (opposite side):
Indicates that the next operation must occur on the opposite side of the histogram
4) Take profit:
It allows defining the deviation in favor to execute a take profit.
It does not place a buy order at a distant point, instead it looks back and if the shift meets the expected deviation, take profit is executed
5) Loss control (stop loss):
It allows to define the deviation against to execute a stop loss.
It does not place a stop order at a distant point, instead it looks back and if the displacement meets the expected deviation the stop loss is executed
How to use it:
Press the "Indicators" option, go to the "Public Librarian" segment, write the name "MACD-Extendido-Indicador Neil", double-click on the record in question and you will have it added in your work panel, now, just It remains to be used to identify the inputs and outputs and you can do it visually or by defining the automatic notification alerts.
DESCRIPCION
Recurso que identifica operaciones de entradas y salida haciendo uso del indicador
Media Móvil de Convergencia/Divergencia (MACD) y 5 estrategias
NOVEDADES
Se implementan estrategias novedosas como:
1. Banda de sobrecompra y sobreventa para esquivar movimientos horizontales
2. Control de entradas y salidas en posiciones contrarias a la línea del histograma
3. Toma de ganancias (take profit) sin ordenes de compra previa
COMO FUNCIONA (ESTRATEGIAS)
1) Sobrecompra y Sobreventa:
Permite definir una banda superior de sobrecompra
Permite definir una banda inferior de sobreventa
Operaciones que ocurren dentro de la banda son ignoradas
2) Lugar de próxima operación (cualquier lado):
Indica que la próxima operación puede ocurrir en cualquier lado del histograma
3) Lugar de próxima operación (lado opuesto):
Indica que la próxima operación debe ocurrir en el lado opuesto del histograma
4) Toma de ganancias (take profit):
Permite definir la desviación a favor para ejecutar una toma de ganancia.
No coloca una orden de compra en un punto distante, en su lugar mira hacia atrás y si el desplazamiento cumple con la desviación esperada se ejecuta la toma de ganancia
5) Control de pérdida (stop loss):
Permite definir la desviación en contra para ejecutar una parada de pérdida.
No coloca una orden de parada en un punto distante, en su lugar mira hacia atrás y si el desplazamiento cumple con la desviación esperada se ejecuta la parada de la pérdida
Como usarlo:
Presione la opción "Indicadores", ubíquese en el segmento "Libreria Publica", escriba el nombre "MACD-Extendido-Indicador por Neil", haga doble clic sobre el registro en cuestión y lo tendrá agregado en su panel de trabajo, ahora, solo resta usarlo para identificar las entradas y salidas y puede hacerlo de forma visual o definiendo las alertas de notificación automática.
MACD-Extendido-Estrategia por Neil--------------------------------
MACD-Extendida-Estrategia
--------------------------------
DESCRIPTION
Resource that identifies entry and exit operations using the indicator
Average Convergence and Divergence Movements ( MACD ) and 5 strategies
INTERESTING
Novel strategies are implemented such as:
1. Overbought and oversold band to avoid horizontal movements
2. Control inputs and outputs at positions opposite the histogram line
3. Make a profit (take profit) without prior purchase orders
HOW DOES IT WORK (STRATEGIES)
1) Overbought and oversold:
Allows you to define an overbought upper band
Allows you to define an oversold ower band
Operations that occur within the band are ignored
2) Place of next operation (either side):
Indicates that the next operation can occur on either side of the histogram
3) Place of next operation (opposite side):
Indicates that the next operation must occur on the opposite side of the histogram
4) Take profit:
It allows defining the deviation in favor to execute a take profit.
It does not place a buy order at a distant point, instead it looks back and if the shift meets the expected deviation, take profit is executed
5) Loss control (stop loss):
It allows to define the deviation against to execute a stop loss.
It does not place a stop order at a distant point, instead it looks back and if the displacement meets the expected deviation the stop loss is executed
How to use it:
Press the "Indicators" option, go to the "Public Librarian" segment, write the name "MACD-Extended-Strategy by Neil", double-click on the record in question and you will have it added in your work panel, now, just It remains to be used to identify the inputs and outputs and you can do it visually or by defining the automatic notification alerts.
--------------------------------
MACD-Extendida-Estrategia
--------------------------------
DESCRIPCION
Recurso que identifica operaciones de entradas y salida haciendo uso del indicador
Media móvil de Convergencia/Divergencia ( MACD ) y 5 estrategias
NOVEDADES
Se implementan estrategias novedosas como:
1. Banda de sobrecompra y sobreventa para esquivar movimientos horizontales
2. Control de entradas y salidas en posiciones contrarias a la línea del histograma
3. Toma de ganancias (take profit) sin ordenes de compra previa
COMO FUNCIONA (ESTRATEGIAS)
1) Sobrecompra y Sobreventa:
Permite definir una banda superior de sobrecompra
Permite definir una banda inferior de sobreventa
Operaciones que ocurren dentro de la banda son ignoradas
2) Lugar de próxima operación (cualquier lado):
Indica que la próxima operación puede ocurrir en cualquier lado del histograma
3) Lugar de próxima operación (lado opuesto):
Indica que la próxima operación debe ocurrir en el lado opuesto del histograma
4) Toma de ganancias (take profit):
Permite definir la desviación a favor para ejecutar una toma de ganancia.
No coloca una orden de compra en un punto distante, en su lugar mira hacia atrás y si el desplazamiento cumple con la desviación esperada se ejecuta la toma de ganancia
5) Control de pérdida (stop loss):
Permite definir la desviación en contra para ejecutar una parada de pérdida.
No coloca una orden de parada en un punto distante, en su lugar mira hacia atrás y si el desplazamiento cumple con la desviación esperada se ejecuta la parada de la pérdida
Como usarlo:
Presione la opción "Indicadores", ubíquese en el segmento "Libreria Publica", escriba el nombre "MACD-Extendido-Estrategia por Neil", haga doble clic sobre el registro en cuestión y lo tendrá agregado en su panel de trabajo, ahora, solo resta usarlo para identificar las entradas y salidas y puede hacerlo de forma visual o definiendo las alertas de notificación automática.

OBV + Simple Moving AverageThird time is a charm. On Balance Volume with simple moving average. Hopefully we don't get this kicked back to us.

SMA Offset StrategyThis strategy uses simple moving averages and some math to determine buy/sell points. We keep a SMA 100 day line as our basis for our offset. If the close price is below the line, we choose our open position based on how low below the line it is goes, this value (Low Offset) is a percentage and can be configured by the user. Same for closing your position, when the close is above our SMA 100 line, we determine how high above the line before selling. If we try to sell too early (while the price is still rising), the trailing stop loss will kick in. Backtested with Bitcoin and Ethereum.
Configurable variables:
SMA Fast (default is 14 days)
SMA Slow (default is 100)
SMA Reference (default is 30)
Low Offset % (default is 0.001)
High Offset % (default is 0.0164)
Order Stake % (default is 0.96)
Trailing stop loss % (default is 1.35)

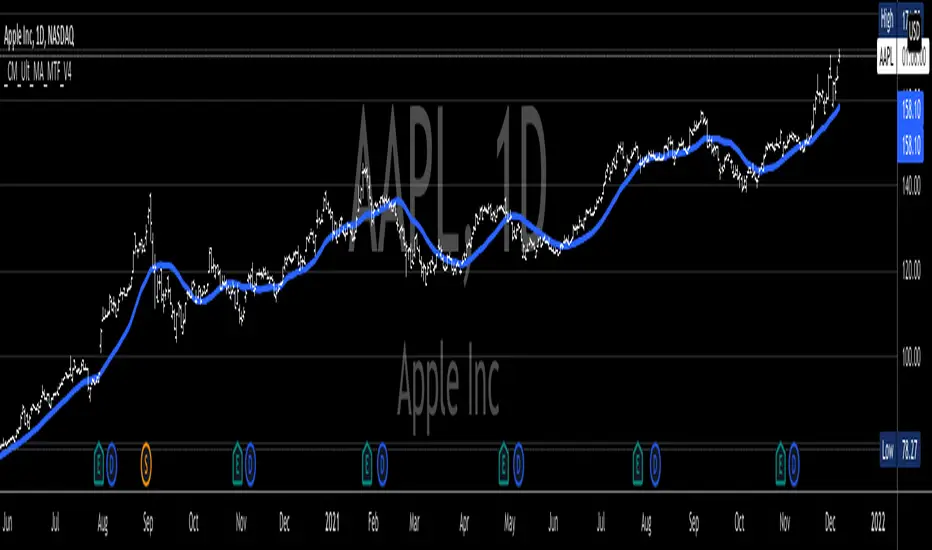
_CM_Ultimate_MA_MTF_V4***For a Detailed Video Overview Showing all of the Settings...
Click HERE to View Video
New _CM_Ultimate_MA_MTF_V4 - Update - 08-24-2021
Thanks to @SKTennis for help with code
Added Ability to Plot 1 or 2 Moving Averages - Fast MA & Slow MA
Added Ability to Plot Fast MA with Multi TimeFrame
Added Ability to Plot Slow MA with Multi TimeFrame
Added Ability to Color Fast MA Based on Slope of MA
Added Ability to Color Fast MA based on being Above/Below Slow MA
Added Ability to Plot 8 Types of Moving Averages
Simple, Exponential, Weighted, Hull, VWMA, RMA, TEMA, & Tilson T3
Added Ability to Set Alerts Based on:
Slope Change in the Fast MA Or Fast MA Crossing Above/Below Slow MA.
Added Ability to Plot "Fill" if Both Moving Averages are Turned ON
Added Ability to control Transparency of Fill
Added Alerts to Settings Pane.
Customized how Alerts work. Must keep Checked in Settings Pane, and When you go to Alerts Panel, Change Symbol to Indicator (_CM_Ultimate_MA_MTF_V4)
Customized Alerts to Show Symbol, TimeFrame, Closing Price, & Moving Average Signal Name in Alert
Alerts are Pre-Set to only Alert on Bar Close
See Video for Detailed Overview
New Updates Coming Soon!!!
***Please Post Feedback and Any Feature Requests in the Comments Section Below***
Fibonacci LevelsThe 420 VWMA (Volume Weighted Moving Average) per period selected of the low price (Fib 0) and the high price (Fib 1). They are labeled in Color of the line they represent.
The other Fib lines are calculated using common fib ratios as follows:
longRange_fib2618 = highestHighperLongRange +
(highestHighperLongRange - lowestLowperLongRange) * 1.618
longRange_fib1618 = highestHighperLongRange +
(highestHighperLongRange - lowestLowperLongRange) * .618
longRange_fib786 = highestHighperLongRange -
(highestHighperLongRange - lowestLowperLongRange) * 0.236
longRange_fib618 = highestHighperLongRange -
(highestHighperLongRange - lowestLowperLongRange) * 0.382
longRange_fib50 = highestHighperLongRange -
(highestHighperLongRange - lowestLowperLongRange) * 0.500
longRange_fib382 = highestHighperLongRange -
(highestHighperLongRange - lowestLowperLongRange) * 0.618
longRange_fib236 = highestHighperLongRange -
(highestHighperLongRange - lowestLowperLongRange) * 0.764
Those lines are drawn and labeled to right of chart
The 2 heavy whites and the short range of the Fib1 (Top) and Fib0 (Bottom). Eyes on chart when it approaches one those two points. This is where I look for continuation or reversal patterns, especially near a Longterm Fib
The Red, Green, Yellow and Blue are colored ratio lines that I am experimenting with and will later combine with a multiple time frames to show discernable patterns of potential near future movements.
The prices interacts with the fib lines and each of the the colored ratio lines as you go from small to larger time frames.
I will be publishing this soon to allow the community to improve on it.

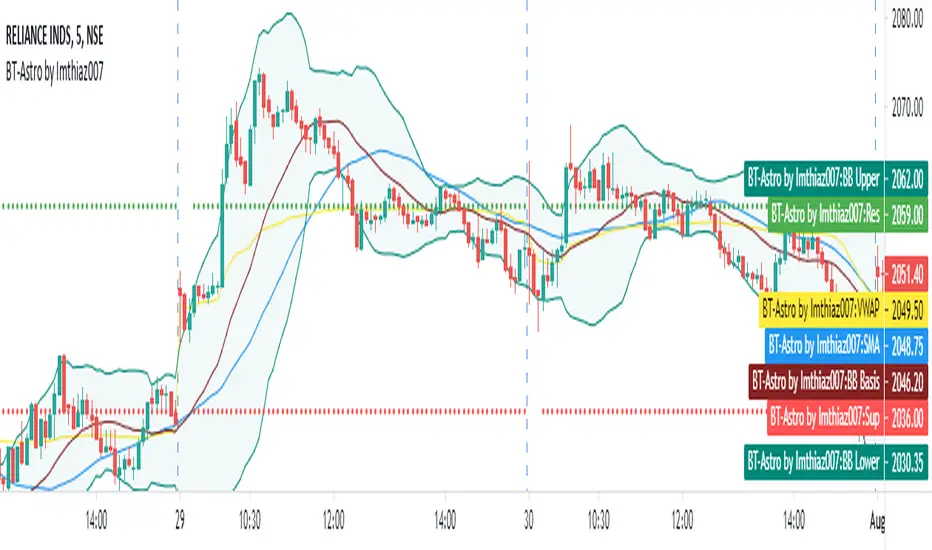
BT Astrology Indicator by Imthiaz007
BT-Astrology Indicator is fine tuned indicator to calculate and draw daly support and resistance based on Gann level for intraday trade or swing trade.
The original Idea is given by Mr. Alex from Badshai Trading; I am a Software Developer by profession so that I just coded it and add some signals for back testing.
I also add following Indicator for better view:
a) Simple Moving Average
b) VWAP
c) Bollinger Band
The Input section of the Indicator :
SMA :- Length 35 as per Mr. Alex suggestion
Minutes : Enter minutes in terms of number of minutes on which VWAP value will be taken for calculating the levels.
By default it will be 20 means VWAP value of 9:35 AM candle will be consider for drawing levels.
How it works ?
Buy : When resistance is broken with higher high formation and candle is above 35 SMA
Sell : When support is broken with lower low formation and candle is below 35 SMA
Hope you like it!!!
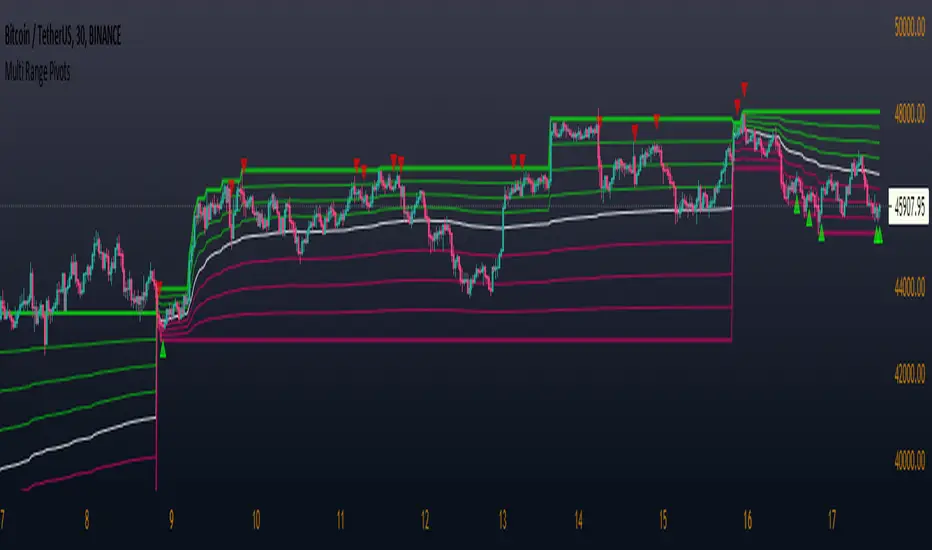
Multi Range Pivots
Multi Range Pivots works by recognizing the high and low of the timeframe selected and plotting range high to MEAN averages and range low to MEAN averages.
This is essentially the VWAP pivots updated to include not only VWAP as a MEAN, but also SMA, EMA, VWMA, DEMA, TEMA, TRIMA, KAMA, MAMA, T3, H/L basis and Donchian basis.
Also, with high and low no longer repainting, I was able to add true reliable signals.
Enjoy
SMA-Extendido-Indicador por NeilDescription:
Indicator that identifies entry and exit operations, using 3 moving averages and 5 strategies. New strategies are implemented such as the prediction of closing operations, independent of the events that justify entry operations.
How does it work:
1) Long strategy: if SMA5 crosses up to SMA200 and SMA200 is bullish , a buy operation begins, if SMA5 crosses down to SMA200 and SMA200 is bearish , a sale begins.
2) Short strategy with smooth filtering of operations: if SMA5 crosses up to SMA20 and SMA20 is bullish and (SMA5 are above SMA200) a buy operation is initiated. If SMA5 crosses down to SMA20 and SMA20 is bearish and (SMA5 are below SMA200) a sell trade is initiated
3) Short strategy with strong filtering of operations: if SMA5 crosses up to SMA20 and SMA20 is bullish and (SMA5 and SMA20 are above SMA200 and SMA200 is bullish ) a buy is initiated, in other words, buy operations occur only if SMA5 and SMA20 are above SMA200; if SMA5 crosses down to SMA20 and SMA20 is bearish and (SMA5 and SMA20 are below SMA200 and SMA200 is bearish ) a sell is initiated, that is, sell operations occur only if SMA5 and SMA20 are below SMA200
4) Short strategy without filtering operations: if SMA5 crosses up to SMA20 and SMA20 is bullish , a buy is initiated (the location of MA200 does not matter). If SMA5 crosses down to SMA20 and SMA20 is bearish , a sell is initiated (it does not matter where the MA200 is located)
5) Prediction of closing operations: the algorithm evaluates potential closing operations differently and considers the following rules: If there is an active buy trade and SMA5 crosses down to SMA20, we close the current buy (the location of the SMA200 does not matter). If there is an active sell trade and SMA5 crosses up to SMA20, we close the sale in progress (the location of the SMA200 does not matter)
How to use it:
Press the "Indicators" option, go to the "Public Librarian" segment, write the name "SMA-Extendido-Indicador por Neil", double-click on the record in question and you will have it added in your work panel, now, just It remains to be used to identify the inputs and outputs and you can do it visually or by defining the automatic notification alerts.

SMA-Extendido-Estrategia por NeilDescription:
Strategy that identifies entry and exit operations, using 3 moving averages and 5 strategies. New strategies are implemented such as the prediction of closing operations, independent of the events that justify entry operations.
How does it work:
1) Long strategy: if SMA5 crosses up to SMA200 and SMA200 is bullish, a buy operation begins, if SMA5 crosses down to SMA200 and SMA200 is bearish, a sale begins.
2) Short strategy with smooth filtering of operations: if SMA5 crosses up to SMA20 and SMA20 is bullish and (SMA5 are above SMA200) a buy operation is initiated. If SMA5 crosses down to SMA20 and SMA20 is bearish and (SMA5 are below SMA200) a sell trade is initiated
3) Short strategy with strong filtering of operations: if SMA5 crosses up to SMA20 and SMA20 is bullish and (SMA5 and SMA20 are above SMA200 and SMA200 is bullish) a buy is initiated, in other words, buy operations occur only if SMA5 and SMA20 are above SMA200; if SMA5 crosses down to SMA20 and SMA20 is bearish and (SMA5 and SMA20 are below SMA200 and SMA200 is bearish) a sell is initiated, that is, sell operations occur only if SMA5 and SMA20 are below SMA200
4) Short strategy without filtering operations: if SMA5 crosses up to SMA20 and SMA20 is bullish, a buy is initiated (the location of MA200 does not matter). If SMA5 crosses down to SMA20 and SMA20 is bearish, a sell is initiated (it does not matter where the MA200 is located)
5) Prediction of closing operations: the algorithm evaluates potential closing operations differently and considers the following rules: If there is an active buy trade and SMA5 crosses down to SMA20, we close the current buy (the location of the SMA200 does not matter). If there is an active sell trade and SMA5 crosses up to SMA20, we close the sale in progress (the location of the SMA200 does not matter)
How to use it:
Press the "Indicators" option, go to the "Public Librarian" segment, write the name "SMA-Extendido-Estrategia por Neil", double-click on the record in question and you will have it added in your work panel, now, just It remains to be used to identify the inputs and outputs and you can do it visually or by defining the automatic notification alerts.

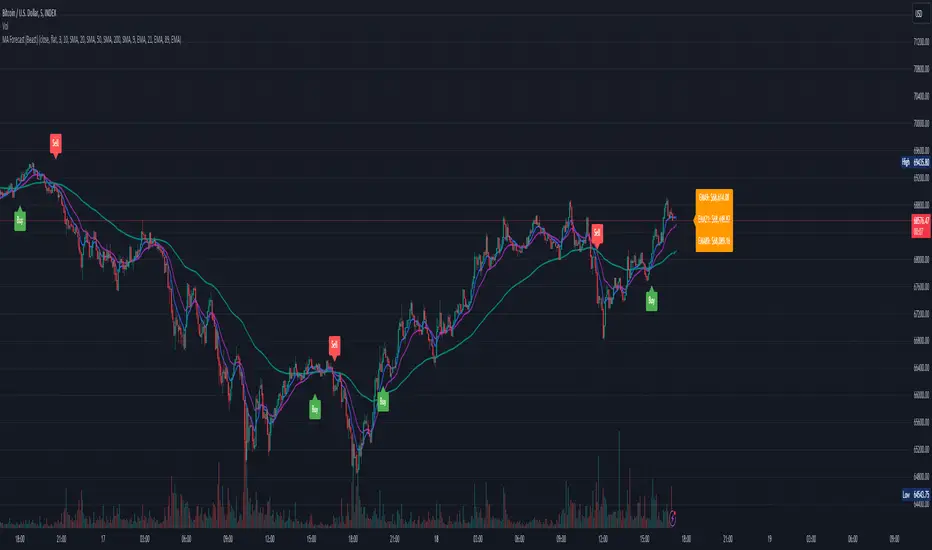
Moving Average Forecast (Beast)This script displays up to 8 lengths of moving averages using either the SMA , EMA, WMA, HMA, SWMA, VWMA or CCI and forecasts where the moving average will be in future periods (by removing the oldest periods and adding future prices based on either current price "flat" or a user-defined period linear regression "linreg".
Built on top of Triple MA Forecast by yatrader2, expanded it and added awesome features.
The following has been changed/added:
- Changed to pine script version 4
- Altered number of moving averages displayed up to 8
- Added multiple moving average types ( SMA , EMA , WMA, HMA, SWMA, VWMA, CCI )
* SMA - Simple moving average *
* EMA - Exponential moving average *
* WMA - Weighted moving average *
* HMA - Hull moving average *
* SWMA - Symmetrical weighted moving average *
* VWMA - Volume-weighted moving average *
* CCI - Commodity channel index *
- Fixed settings menu
- Added label with current moving average values (sorted by price)
- Cleaned up the logic
- Cleaned up the code
TFi Simple Moving Average Bot V1 - PUBLICThe bot is using 2 moving averages for detecting the trend; the type of moving average is configurable; if the 2 moving averages are crossing it enters a long or short position. A stop-loss and profit-target can be configured; if reaching the profit-target, the bot is closing 50% (configurable) of the position, from this time on it is using a trailing-stop to close the position if the trailing-stop has been crossed.
The following moving-averages can be configured:
DEMA
EMA
HMA
RMA
SMA
TEMA
VWMA
WMA
Overview of features:
Optional stop-loss and profit-target/trailing-stop
Built-in backtesting engine with start balance, position size and pyramiding; each year will be evaluated separately
Inputs for a percentage entry and exit slippage, entry/exit and daily funding fees
Configurable alerts, which follow the exact position of the entry/exit marker
Alert messages contain predefined trading instruction to execute orders via TradeFab's proprietary trading server, which supports Alpaca-Markets, TD Ameritrade, Oanda, CCXT API's, or can be defined by the user
The script renders a performance/status table, which shows the current position status and result of the built-in trading simulation results. The following statistics are shown:
Current position PnL - also background turns green if position is in profit and red if in loss
Average entry price and number of positions
Current percentage distance to the optional stop-loss level
Current Maximum Draw Down
Number of wins and losses and the win/loss ratio per year and overall
Profit and loss amount, paid fees per year and overall
Profit-ratio and Maximum Draw Down per year and overall
Balance and ROI per year and overall

Tocorin_MTF_MA7 MAs (SMA or EMA) can be displayed in each period.
MTF display is performed only at 5m, 1h, and 4h.
The upper MAs to be displayed are as follows
5m: 1h, 4h, and 1D
1h: 4h and 1D
4h: 1D
The MA line style is stepline and circles to make it easier to see.
You can change it in the settings as you wish.
--
各時間足で 7本の MA(SMA or EMA) 表示が可能です。
5m, 1h, 4h の時だけ MTF 表示を行います。
表示する上位 MA は下記の通り
5m: 1h と 4h と 1D
1h: 4h と 1D
4h: 1D
見やすくするためにMA の線のスタイルを stepline と circles にしています。
設定で任意に変更してください。

Iceberg Intraday LearningHOW TO USE?
A setup which contains Most Useful 14 indicators, that any Intraday Trader might require.
Below will see one by one-
1) Trend Following Icebergs - (3 Different Indicators to choose from)
--> The trend following indicators optionally.
--> Very simple to understand, yellow indicating sideways, green - going upside, and red - going downside.
--> Trend Indicator - 1st Iceberg is HMA Crossovers
--> Trend Indicator - 2nd Iceberg is SMA (20). It will change its color according to the trend of the market.
--> Trend Indicator - 3rd Iceberg is RSI(14) in EMA, will be plotted at the bottom of the screen.
2) Classic Pivot Points & Floor Pivot Points: - ( 2 Different Indicators to choose from )
--> Classic Pivot Points having 5 Supports & Resistances on the chart.
--> Floor Pivot Points, At the middle, it is pivot point (PP) level and multiple support and resistance levels
--> Floor Pivot Points is a very known indicator that indicates whether that helps in-stock selection.
--> This is a very crucial indicator as it shows the Floor Pivot Points levels for the next day.
--> One can make a learn by looking at next day's Floor Pivot Points that whether the stock is going to be trendy/sideways the next day.
3) Support/Resistance
--> This indicator is used for finding support and resistance levels on charts.
--> Helps in getting pullbacks and exit levels
--> Lines will change color automatically if any candle closes above the support/resistance line. It will change it's to green.
--> Similarly, it will change its color to red if the price is below the support
4) Highs/lows, SuperTrend Up Down ( 2 Different indicators to use )
--> Plots Highs / Lows in the selected time frame.
--> Added SuperTrend indicator with length 10 with source HL/2 and multiplier to be 2.
5) Dynamic ATR - Average True Range (14 Days)
--> It plots 2 important levels at the starting of the day.
--> 2 bands are plotted in the morning when the market opens, resembling strong support/resistance zones.
6) First Candle
--> This will highlight the first candle that is formed of the selected time interval.
7) Bollinger Band
--> Bollinger band is also added for better catching the momentum as seen on chart.
--> The Upper and Lower Bands are used as a way to measure volatility by watching the relationship between the Bands and price
8) VWAP
--> VWAP is useful for learning trend direction in any market conditions.
9) RSI & MACD
--> Plots label indicating the status of RSI and MACD.
This works for Intraday Trades - when the resolution is kept to less than 1 hour ( Say 3 , 5 , 10 , 15 Mins), This works well when the resolution is kept to 1 Day - Good for Swing Trades spanning over a few days, This works well when the resolution is kept to 1 Day or Week - Good for Investments.
Trend Indicator - 3rd Iceberg Is a repainted based on the hybrid RSI Logic
Stop Loss - That should be done by following ones risk appetite , Ideally the open/close of the previous candle should be the stop loss for the buy/sell but everyone has their own Risk Management Strategies based on the capital deployed.
If you like it and find it useful or if you find a defect or bug , Please let us know in the comments .. that would encouraging !! for us to develop it further
Coded for learning INDIAN Markets.
CAUTION:: There could be scenarios when the breakout/breakdown candle is rejected , especially when it is long one
so it is always recommended to have a confirmation candle that open-closes above the breakout candle / open-closes below the breakdown candle.
Disclaimer: No Investment Advice Provided , You should always understand that P AST PERFORMANCE IS NOT NECESSARILY INDICATIVE OF FUTURE RESULTS.
Inspiring to learn the Pine making market learnings easier.
Thanks & Regards,
Iceberg Intraday Learning.

MTF Price/Volume % [Anan]Hello friends,
This is a multi-timeframe table with these features:
Display price change percentage compared with the last timeframe candle close.
Display price change percentage compared with the last timeframe candle close MA.
Displays change percentage compared with the last timeframe candle volume.
Displays change percentage compared with the last timeframe candle volume MA.
Change type/length of MA for Price/Volume.
Full control of Panel position and size.
Full control of displaying any row or column.
