Filter Wave1. Indicator Name
Filter Wave
2. One-line Introduction
A visually enhanced trend strength indicator that uses linear regression scoring to render smoothed, color-shifting waves synced to price action.
3. General Overview
Filter Wave+ is a trend analysis tool designed to provide an intuitive and visually dynamic representation of market momentum.
It uses a pairwise comparison algorithm on linear regression values over a lookback period to determine whether price action is consistently moving upward or downward.
The result is a trend score, which is normalized and translated into a color-coded wave that floats above or below the current price. The wave's opacity increases with trend strength, giving a visual cue for confidence in the trend.
The wave itself is not a raw line—it goes through a three-stage smoothing process, producing a natural, flowing curve that is aesthetically aligned with price movement.
This makes it ideal for traders who need a quick visual context before acting on signals from other tools.
While Filter Wave+ does not generate buy/sell signals directly, its secure and efficient design allows it to serve as a high-confidence trend filter in any trading system.
4. Key Advantages
🌊 Smooth, Dynamic Wave Output
3-stage smoothed curves give clean, flowing visual feedback on market conditions.
🎨 Trend Strength Visualized by Color Intensity
Stronger trends appear with more solid coloring, while weak/neutral trends fade visually.
🔍 Quantitative Trend Detection
Linear regression ordering delivers precise, math-based trend scoring for confidence assessment.
📊 Price-Synced Floating Wave
Wave is dynamically positioned based on ATR and price to align naturally with market structure.
🧩 Compatible with Any Strategy
No conflicting signals—Filter Wave+ serves as a directional overlay that enhances clarity.
🔒 Secure Core Logic
Core algorithm is lightweight and secure, with minimal code exposure and strong encapsulation.
📘 Indicator User Guide
📌 Basic Concept
Filter Wave+ calculates trend direction and intensity using linear regression alignment over time.
The resulting wave is rendered as a smoothed curve, colored based on trend direction (green for up, red for down, gray for neutral), and adjusted in transparency to reflect trend strength.
This allows for fast trend interpretation without overwhelming the chart with signals.
⚙️ Settings Explained
Lookback Period: Number of bars used for pairwise regression comparisons (higher = smoother detection)
Range Tolerance (%): Threshold to qualify as an up/down trend (lower = more sensitive)
Regression Source: The price input used in regression calculation (default: close)
Linear Regression Length: The period used for the core regression line
Bull/Bear Color: Customize the color for bullish and bearish waves
📈 Timing Example
Wave color changes to green and becomes more visible (less transparent)
Wave floats above price and aligns with an uptrend
Use as trend confirmation when other signals are present
📉 Timing Example
Wave shifts to red and darkens, floating below the price
Regression direction down; price continues beneath the wave
Acts as bearish confirmation for short trades or risk-off positioning
🧪 Recommended Use Cases
Use as a trend confidence overlay on your existing strategies
Especially useful in swing trading for detecting and confirming dominant market direction
Combine with RSI, MACD, or price action for high-accuracy setups
🔒 Precautions
This is not a signal generator—intended as a trend filter or directional guide
May respond slightly slower in volatile reversals; pair with responsive indicators
Wave position is influenced by ATR and price but does not represent exact entry/exit levels
Parameter optimization is recommended based on asset class and timeframe
Sp500index

WMAX-D-TPS1 (USD setup)Here I show you a strategy that I have been developing for years based on breakouts of maximum and minimum price levels.This work good in 1d

Options levelsOverview
Options Levels 🎯 plots 13 key institutional and options-based levels directly on your chart — including Call Wall, Put Wall, Gamma Flip, Whales Pivot, five Whale levels, and Sigma deviation bands (σ¹ / σ²).
It’s designed for both intraday and swing traders, offering a clean visual structure with elegant emoji labels, flexible visibility controls, and precise right-edge extensions for each line.
✨ Key Features
Single structured input with 13 ordered levels:
CallWall, PutWall, GammaFlip, Whales Pivot, Whale1..Whale5, Upperσ1, Upperσ2, Lowerσ1, Lowerσ2
Expressive emoji labels (🟢, 🔴, ⚖️, 🌑, 🐋, σ¹/σ²) optimized for dark themes.
Right-edge alignment: each line extends exactly to its label — no infinite lines.
Group visibility toggles:
• Critical Levels → Call Wall, Put Wall, Gamma Flip, Whales Pivot
• Whale Levels → Whale 1–5
• Sigma Bands → Upper/Lower σ¹ and σ²
Dynamic line-length multipliers that emphasize key levels.
Built-in alert conditions:
• Price crossing above the Call Wall
• Price crossing below the Put Wall
⚙️ Inputs & Settings
📋 Level List (string) : comma-separated list of 13 numeric values.
Example:
🎨 Appearance
• Base line length (bars)
• Label visibility toggle
• Line thickness
• Extend line and label to the right
• Distance (bars) between last candle and label
👁️ Visibility Controls
• Toggle Critical, Whale, or Sigma levels independently
🚀 How to Use
Paste your list of 13 ordered levels into the input field.
Adjust base length and thickness according to your timeframe.
Enable “Extend to the right” to position labels neatly beyond the last candle.
Use visibility toggles to focus on specific level groups (e.g., hide Whale Levels for short-term setups).
Optionally enable alerts to track price breakouts above/below Call and Put Walls.
The plotted levels are derived from aggregated options flow data, institutional positioning, and volatility-based deviations (σ). They serve as reference zones rather than predictive signals, helping visualize where liquidity and dealer hedging pressure may cluster.
📖 Level Definitions
Call Wall 🟢 — The strike with the highest call open interest; potential resistance area.
Put Wall 🔴 — The strike with the highest put open interest; potential support area.
Gamma Flip ⚖️ — Level where total gamma exposure changes sign; may reflect a shift in dealer hedging behavior.
Whales Pivot 🌑 — Represents the average institutional positioning from the previous trading day, reflecting where large option flows were most concentrated.
Whale Levels 🐋 — High-premium or large-volume strikes typically linked to institutional activity.
Upper σ¹ / σ² 📈 — One and two standard deviations above spot; potential overextension zones.
Lower σ¹ / σ² 📉 — One and two standard deviations below spot; potential mean-reversion zones.
Levels are manually input by the user. This script is a visual reference, not a predictive model.
⚠️ Notes
Levels are user-provided (not calculated by this script).
The indicator does not issue buy/sell signals or provide performance guarantees.
Designed purely as a visual aid for contextual market reference.
Optimized with barstate.islast for performance (draws only at the latest bar).
Disclaimer:
This indicator is for educational and visual purposes only. It does not generate buy/sell signals or guarantee future results. User-provided levels are meant for contextual reference only.
Developed for traders who rely on market structure and options flow context. Feedback and suggestions are welcome.

TwinPulse Q Lead SPY x QQQ Intermarket Pulse 1HTwinPulse Q Lead is a concise one hour indicator for SPY and QQQ that converts three sources of market information into a single pulse line, a mode readout with BUY SELL WAIT, and compact alerts. It blends intermarket leadership between QQQ and SPY, intraday flow from the slope of session VWAP, and where the current price sits inside the regular trading hours range. The three components are normalized, fused, compressed to a stable range, and smoothed for clear thresholds. The aim is a readable intraday regime signal that helps you decide when to participate and when to stand aside.
The script is built with Pine v6, uses request security with lookahead off, and does not repaint. It is an indicator, not a strategy. It does not contain any solicitation, links, or outside references. The description is self contained and explains both logic and use so that any trader can understand the design without reading code.
What makes this original and useful
Intermarket leadership is measured directly from QQQ and SPY on your working timeframe using a Z score of the return spread. When growth is leading value heavy large caps, leadership turns positive. When it lags, leadership turns negative. This gives a real time read of the Nasdaq versus S and P tug of war that most day traders watch informally.
Intraday flow is taken from the slope of the session VWAP. A linear regression of VWAP over a short window captures whether value is rising or falling inside the day. Dividing by ATR normalizes slope by typical movement so that the signal is comparable across weeks.
Session position places price inside the current regular hours high to low. It answers whether the day is trading in the top half, the bottom half, or the middle. This is a simple but powerful context filter for breakouts and fades.
The three components are fused into one pulse, compressed with either hyperbolic tangent or softsign to keep values bounded, and then smoothed by a short EMA. This yields a stable range with a zero line so the eye can read shifts quickly.
The panel shows a human readable mode with reasons and a strength score. Traders who do not want to read lines can rely on a simple state and a compact justification that explains why the state is set.
This is not a mashup that simply overlays unrelated indicators. Each component was chosen to answer a distinct question that is common to SPY and QQQ intraday decision making. Leadership answers who is in charge, flow answers whether value inside the session is building or leaking, and position answers if price is pressing the extremes or circling the middle. The pulse ties the three together and prevents any single component from dominating.
How the calculations work
Leadership. Compute a short rate of change for SPY and QQQ. Subtract SPY from QQQ to get spread returns, then compute a rolling Z score over a longer window. Positive values mean QQQ is leading. Negative values mean SPY is leading.
Flow. Compute session VWAP on the active symbol. Regress VWAP over a short window to obtain a slope estimate. Divide by ATR to scale slope by current volatility so that a small rise on a quiet day is not treated the same as a small rise on a wild day.
Position. Track the highest high and lowest low since the start of regular hours. Place the current close inside that range on a zero to one scale, then recenter to a minus one to plus one scale. Positive means the top half of the day, negative means the bottom half.
Fusion. Multiply each component by a weight so users can emphasize or de emphasize leadership, flow, or position. Sum to a raw pulse.
Compression. Pass the raw pulse through a bounded function. Hyperbolic tangent is smooth and has natural saturation near the extremes. Softsign is faster and behaves like a smoother version of sign near zero. Compression avoids unbounded excursions and makes thresholds meaningful across days.
Smoothing. Apply a short EMA to the compressed pulse to reduce noise. This creates the main line called TwinPulse in the plot.
Thresholds. You can use static symmetric levels or adaptive levels. The adaptive option computes a mean and a standard deviation of the smoothed pulse over a user window, then sets upper and lower thresholds as mean plus or minus sigma times standard deviation. This allows thresholds to adjust across regimes. Static levels are still available for traders who want repeatable levels.
Events and mode. A long event fires when the smoothed pulse crosses the upper threshold with positive flow and any optional filters agree. A short event fires on the symmetric condition. The mode reads the current state rather than fire and forget. It returns BUY when the smoothed pulse is above the upper threshold with positive flow, SELL when the smoothed pulse is below the lower threshold with negative flow, otherwise WAIT. A cooldown controls how often events can fire so alerts do not spam during choppy periods.
Inputs and default values
The script ships with defaults chosen for SPY and QQQ on one hour charts.
Symbols. SPY and QQQ by default. You can switch to any pair. Many users may test IWM versus SPY for small cap reads.
Regular hours selector. On by default. This restricts the position factor to New York regular hours. Turn it off if you prefer full session behavior.
ROC length is three bars. Z score length is fifty bars. VWAP slope window is ten bars. ATR length is fourteen bars. Pulse smoothing length is three bars.
Compression mode. Choose hyperbolic tangent or softsign. Hyperbolic tangent is default.
Weights. Leadership and flow are one by default. Position is set to zero point seven to give a modest influence to where price sits inside the day.
Thresholds. Adaptive thresholds are on by default with a lookback of one hundred bars and a sigma width of zero point eight. Static levels at plus or minus zero point six are ready if you disable adaptive mode.
Filters. ADX filter is off by default. If you enable it, the script requires ADX above a user minimum before it will signal. Higher time frame confirmation is off by default. When enabled it compares the smoothed pulse on the confirm timeframe to zero and requires alignment for longs or shorts.
Cooldown. Three bars by default so that alerts do not trigger too frequently.
UI. Bar coloring is on by default. The panel is on by default and sits at the top right.
All request security calls use lookahead off and will not request future data. All persistent state variables are assigned in a way that prevents repainting. The indicator does not use non standard chart types in its logic.
How to use the indicator
Load a one hour chart of SPY or QQQ. Keep a clean chart so that the script output is easy to read.
Turn on regular hours if you want the session position to reflect the cash session. This is recommended for SPY and QQQ.
Watch the panel. Mode reads BUY or SELL or WAIT. The strength value is a simple vote based score that ranges from zero to one hundred. It counts leadership, flow, ADX if enabled, and higher time frame confirmation if enabled. You can use strength to filter weak states.
Consider action only when mode is BUY or SELL and the signal has not just fired on the last bar. The triangles mark where an event fired. Alerts use the same logic as the events. WAIT means stand aside.
To slow the system, enable ADX and set a higher minimum or enable higher time frame confirmation. To speed it up, disable the filters, disable adaptive thresholds, or tighten the sigma width.
When publishing, use a clean chart with only this indicator. Show the symbol and timeframe clearly and make sure the plot legend is visible. If you add drawings on the chart, only include ones that help readers understand the output.
Publication notes and compliance
This description is written in English. The title uses ASCII and only uses capital letters for common abbreviations. The script is original and explains how and why the components work together. There are no links or promotional material. The script does not claim performance. It does not use lookahead. The panel and alerts exist to help a human read and act with discipline. The indicator can be published as open source or as protected. If you choose protected, the description still allows readers to understand how the logic works without access to the code.
If you later convert the logic into a strategy for publication, use realistic commission and slippage, risk no more than a small share of equity per trade, and choose a dataset that yields a large enough sample. Explain any deviations from these default recommendations in your strategy description. Do not publish results from non standard chart types since they can mislead readers on signal timing.
Limitations and risks
Intermarket leadership is a relative measure. There are hours when both SPY and QQQ fall while leadership remains positive. Treat leadership as a context, not a stand alone trigger.
VWAP slope is a path measure inside the session. It can flip several times on a choppy day. That is why the script uses a short smoothing and an optional cooldown. Use ADX or higher time frame confirmation to avoid the worst chop.
Session position assumes a meaningful regular hours range. On half days or around openings with gaps the position factor can be less informative. If this bothers you, reduce the weight of position or turn it off.
Compression and smoothing introduce lag by design. The goal is stability and clarity. If you want earlier but noisier signals, reduce smoothing and weights, and use static thresholds.
No indicator guarantees future results. TwinPulse Q Lead is a decision aid. It should be combined with your risk rules, position size policy, and a clear exit plan. Past behavior is not a promise for the future.
Frequently asked questions
What symbols are supported. Any symbol can be used as the chart symbol. Leadership uses the two user symbols which default to SPY and QQQ. Many traders may try IWM versus SPY or DIA versus SPY.
Can I change the timeframe. Yes, but the design target is one hour. On very short timeframes the VWAP slope becomes very sensitive and you should consider stronger filters.
Does the script repaint. No. It uses request security with lookahead off and the panel updates on the last bar only. Events are based on bar close conditions unless you attach alerts on any alert function call which will still respect the logic without looking into the future.
How are the strength numbers built. The strength score is the share of aligned votes across leadership, flow, ADX if enabled, and higher time frame confirmation if enabled. A value near one hundred means many filters agree. A value near fifty means partial alignment. It is not a probability or an accuracy number.
Can I use non standard chart types. You can view the indicator on them but do not publish signals from non standard chart types because that can mislead readers about timing. Use classic candles or bars when you publish and when you test.
Why do I sometimes see BUY but the price is not moving. A BUY mode requires pulse above the upper threshold and positive flow. It does not require higher highs immediately. Treat BUY as a permission to look for entries using your own execution rules.

QQQ Ladder → Adjusted to Active Ticker (5s & 10s)This indicator allows you to a grid of QQQ levels directly on futures chart like NQ, MNQ, ES and MES, automatically adjusting for the spread between the displayed symbol and QQQ. This is particularly useful for traders who perform technical analysis on QQQ but execute trades on Futures.
Features:
Renders every 5 and 10 points steps of QQQ in your current chart.
The script adjusts these levels in real-time based on the current spread between QQQ and the displayed symbol!
Plots updated horizontal lines that move with the spread
Supports Multiple Tickers, ES1!, MES1!, NQ1!, MNQ1! SPY and SPX500USD.

SPX Ladder → Adjusted to Active Ticker (5s & 10s)This indicator allows you to a grid of SPX levels directly on the ES1! (E-mini S&P 500 Futures) chart, automatically adjusting for the spread between SPX and ES1!. This is particularly useful for traders who perform technical analysis on SPX but execute trades on ES1!.
Features:
Renders every 5 and 10 points steps of the SPX in your current chart.
The script adjusts these levels in real-time based on the current spread between SPX and ES1!
Plots updated horizontal lines that move with the spread
Supports Multiple Tickers, ES1!, SPY and SPX500USD.
Ideal for futures traders who want SPX context while trading ES1!.


PRO Investing - Quant AlphaCentauri D |XLF|PRO Investing - Quant AlphaCentauri D |XLF|
1. Summary and Core Concept
This is a quantitative backtesting strategy engineered specifically for the Financial Select Sector SPDR Fund (XLF) on the Daily (1D) timeframe. The name "AlphaCentauri" reflects its goal: to seek alpha by identifying statistically significant opportunities through rigorous time series analysis.
The strategy's core principle is to move beyond conventional technical indicators and instead analyze the underlying structure and character of price data. It is designed to methodically identify conditions that have historically preceded sustained directional trends in the financial sector.
2. The Analytical Process: How It Works
This strategy employs a multi-stage quantitative process to filter for high-probability setups. It is a "mashup" of statistical concepts applied to price action.
Structural Pattern Recognition: The engine's primary function is to analyze the historical price series of XLF to identify specific, recurring structural patterns. It examines price geometry and cyclical behavior to find formations that often act as the foundation for a new, emerging trend.
Signal Execution: A signal to enter a trade is only generated when the findings from both the structural analysis and the validation stages are in agreement. This disciplined, multi-layered approach ensures the strategy remains flat during periods of high uncertainty and only engages when its quantitative criteria are fully met.
3. How to Use This Strategy
Timeframe: This strategy has been designed, tested, and optimized exclusively for the Daily (1D) timeframe on the XLF ticker. Its logic is not intended for other timeframes or assets and may produce unreliable results if used differently.
On-Chart Signals: The strategy's operation is transparent. It plots all historical buy and sell entries, along with their corresponding exits, directly on the chart for easy performance review and analysis.
4. Risk Management: The Strategy's Foundation
This strategy is built upon a foundation of strict, non-negotiable risk management, which is reflected in its code and backtesting parameters. This design complies with TradingView's guidelines for publishing realistic and responsible strategies.
Dynamic Stop-Loss and Position Sizing: A stop-loss is dynamically calculated for each trade based on recent market volatility. The strategy then automatically adjusts the position size for that trade to target a defined risk percentage. In cases of extreme market volatility, the maximum potential loss on a single trade may approach, but is designed not to exceed, 5% of total account equity. Under normal market conditions, the risk for most trades will be below this maximum threshold.
Realistic Backtesting Parameters:
Initial Capital: The backtest defaults to an initial capital of $100,000.
Commission: A realistic fee of $5.00 per order is included to simulate broker costs.
5. Disclaimer
This strategy is an educational tool provided for informational and research purposes. It is not financial advice. All trading carries a high level of risk, and past performance is not a guarantee of future results. You are solely responsible for your own trading decisions and risk management. Always conduct your own due diligence before deploying any trading strategy in a live account.

SPX Weekly Expected Moves# SPX Weekly Expected Moves Indicator
A professional Pine Script indicator for TradingView that displays weekly expected move levels for SPX based on real options data, with integrated Fibonacci retracement analysis and intelligent alerting system.
## Overview
This indicator helps options and equity traders visualize weekly expected move ranges for the S&P 500 Index (SPX) by plotting historical and current week expected move boundaries derived from weekly options pricing. Unlike theoretical volatility calculations, this indicator uses actual market-based expected move data that you provide from options platforms.
## Key Features
### 📈 **Expected Move Visualization**
- **Historical Lines**: Display past weeks' expected moves with configurable history (10, 26, or 52 weeks)
- **Current Week Focus**: Highlighted current week with extended lines to present time
- **Friday Close Reference**: Orange baseline showing the previous Friday's close price
- **Timeframe Independent**: Works consistently across all chart timeframes (1m to 1D)
### 🎯 **Fibonacci Integration**
- **Five Fibonacci Levels**: 23.6%, 38.2%, 50%, 61.8%, 76.4% between Friday close and expected move boundaries
- **Color-Coded Levels**:
- Red: 23.6% & 76.4% (outer levels)
- Blue: 38.2% & 61.8% (golden ratio levels)
- Black: 50% (midpoint - most critical level)
- **Current Week Only**: Fibonacci levels shown only for active trading week to reduce clutter
### 📊 **Real-Time Information Table**
- **Current SPX Price**: Live market price
- **Expected Move**: ±EM value for current week
- **Previous Close**: Friday close price (baseline for calculations)
- **100% EM Levels**: Exact upper and lower boundary prices
- **Current Location**: Real-time position within the EM structure (e.g., "Above 38.2% Fib (upper zone)")
### 🚨 **Intelligent Alert System**
- **Zone-Aware Alerts**: Separate alerts for upper and lower zones
- **Key Level Breaches**: Alerts for 23.6% and 76.4% Fibonacci level crossings
- **Bar Close Based**: Alerts trigger on confirmed bar closes, not tick-by-tick
- **Customizable**: Enable/disable alerts through settings
## How It Works
### Data Input Method
The indicator uses a **manual data entry approach** where you input actual expected move values obtained from options platforms:
```pinescript
// Add entries using the options expiration Friday date
map.put(expected_moves, 20250613, 91.244) // Week ending June 13, 2025
map.put(expected_moves, 20250620, 95.150) // Week ending June 20, 2025
```
### Weekly Structure
- **Monday 9:30 AM ET**: Week begins
- **Friday 4:00 PM ET**: Week ends
- **Lines Extend**: From Monday open to Friday close (historical) or current time + 5 bars (current week)
- **Timezone Handling**: Uses "America/New_York" for proper DST handling
### Calculation Logic
1. **Base Price**: Previous Friday's SPX close price
2. **Expected Move**: Market-derived ±EM value from weekly options
3. **Upper Boundary**: Friday Close + Expected Move
4. **Lower Boundary**: Friday Close - Expected Move
5. **Fibonacci Levels**: Proportional levels between Friday close and EM boundaries
## Setup Instructions
### 1. Data Collection
Obtain weekly expected move values from options platforms such as:
- **ThinkOrSwim**: Use thinkBack feature to look up weekly expected moves
- **Tastyworks**: Check weekly options expected move data
- **CBOE**: Reference SPX weekly options data
- **Manual Calculation**: (ATM Call Premium + ATM Put Premium) × 0.85
### 2. Data Entry
After each Friday close, update the indicator with the next week's expected move:
```pinescript
// Example: On Friday June 7, 2025, add data for week ending June 13
map.put(expected_moves, 20250613, 91.244) // Actual EM value from your platform
```
### 3. Configuration
Customize the indicator through the settings panel:
#### Visual Settings
- **Show Current Week EM**: Toggle current week display
- **Show Past Weeks**: Toggle historical weeks display
- **Max Weeks History**: Choose 10, 26, or 52 weeks of history
- **Show Fibonacci Levels**: Toggle Fibonacci retracement levels
- **Label Controls**: Customize which labels to display
#### Colors
- **Current Week EM**: Default yellow for active week
- **Past Weeks EM**: Default gray for historical weeks
- **Friday Close**: Default orange for baseline
- **Fibonacci Levels**: Customizable colors for each level type
#### Alerts
- **Enable EM Breach Alerts**: Master toggle for all alerts
- **Specific Alerts**: Four alert types for Fibonacci level breaches
## Trading Applications
### Options Trading
- **Straddle/Strangle Positioning**: Visualize breakeven levels for neutral strategies
- **Directional Plays**: Assess probability of reaching target levels
- **Earnings Plays**: Compare actual vs. expected move outcomes
### Equity Trading
- **Support/Resistance**: Use EM boundaries and Fibonacci levels as key levels
- **Breakout Trading**: Monitor for moves beyond expected ranges
- **Mean Reversion**: Look for reversals at extreme Fibonacci levels
### Risk Management
- **Position Sizing**: Gauge likely price ranges for the week
- **Stop Placement**: Use Fibonacci levels for logical stop locations
- **Profit Targets**: Set targets based on EM structure probabilities
## Technical Implementation
### Performance Features
- **Memory Managed**: Configurable history limits prevent memory issues
- **Timeframe Independent**: Uses timestamp-based calculations for consistency
- **Object Management**: Automatic cleanup of drawing objects prevents duplicates
- **Error Handling**: Robust bounds checking and NA value handling
### Pine Script Best Practices
- **v6 Compliance**: Uses latest Pine Script version features
- **User Defined Types**: Structured data management with WeeklyEM type
- **Efficient Drawing**: Smart line/label creation and deletion
- **Professional Standards**: Clean code organization and comprehensive documentation
## Customization Guide
### Adding New Weeks
```pinescript
// Add after market close each Friday
map.put(expected_moves, YYYYMMDD, EM_VALUE)
```
### Color Schemes
Customize colors for different trading styles:
- **Dark Theme**: Use bright colors for visibility
- **Light Theme**: Use contrasting dark colors
- **Minimalist**: Use single color with transparency
### Label Management
Control label density:
- **Show Current Week Labels Only**: Reduce clutter for active trading
- **Show All Labels**: Full information for analysis
- **Selective Display**: Choose specific label types
## Troubleshooting
### Common Issues
1. **No Lines Appearing**: Check that expected move data is entered for current/recent weeks
2. **Wrong Time Display**: Ensure "America/New_York" timezone is properly handled
3. **Duplicate Lines**: Restart indicator if drawing objects appear duplicated
4. **Missing Fibonacci Levels**: Verify "Show Fibonacci Levels" is enabled
### Data Validation
- **Expected Move Format**: Use positive numbers (e.g., 91.244, not ±91.244)
- **Date Format**: Use YYYYMMDD format (e.g., 20250613)
- **Reasonable Values**: Verify EM values are realistic (typically 50-200 for SPX)
## Version History
### Current Version
- **Pine Script v6**: Latest version compatibility
- **Fibonacci Integration**: Five-level retracement analysis
- **Zone-Aware Alerts**: Upper/lower zone differentiation
- **Dynamic Line Management**: Smart current week extension
- **Professional UI**: Comprehensive information table
### Future Enhancements
- **Multiple Symbols**: Extend beyond SPX to other indices
- **Automated Data**: Integration with options data APIs
- **Statistical Analysis**: Success rate tracking for EM predictions
- **Additional Levels**: Custom percentage levels beyond Fibonacci
## License & Usage
This indicator is designed for educational and trading purposes. Users are responsible for:
- **Data Accuracy**: Ensuring correct expected move values
- **Risk Management**: Proper position sizing and risk controls
- **Market Understanding**: Comprehending options-based expected move concepts
## Support
For questions, issues, or feature requests related to this indicator, please refer to the code comments and documentation within the Pine Script file.
---
**Disclaimer**: This indicator is for informational purposes only. Trading involves substantial risk of loss and is not suitable for all investors. Past performance does not guarantee future results.

IBS (Internal Bar Strength) Trading Strategy for SPY and NDQImplementation by AlgoTradeKit
Overview
The IBS Trading Strategy is a daily bars long-only trading system, based on the concept of Internal Bar Strength (IBS). The strategy aims to identify potential reversals by monitoring how the previous bar’s close positions itself within its high-low range. It is suitable for stock and US indices. The default parameters are optimized for SPY/SPX and NDQ/QQQ
Strategy Concept
The Internal Bar Strength (IBS) is calculated using the formula:
IBS = (Previous Close - Previous Low) / (Previous High - Previous Low)
This value always lies between 0 and 1. An IBS value below 0.2 is typically interpreted as an oversold condition, while a value above 0.9 suggests an overbought state.
Trading Rules
- Long Entry :
- Condition 1 : IBS is below the user-defined entry threshold (default is 0.2).
- Condition 2 : The current price is above an N-period Exponential Moving Average (EMA) (default period is 252).
- Note : You can disable the EMA condition by setting the EMA period to 0.
- Long Exit
- The position is closed when IBS rises above the user-defined exit threshold (default is 0.9).
Customization Options
- IBS Entry Threshold : Adjust to set the sensitivity for entering a long trade based on oversold conditions.
- IBS Exit Threshold : Customize to define the exit point when the market becomes overbought.
- EMA Period : Set the lookback period for the EMA to align with your trend bias; disable this condition by setting the period to 0.
Risk Management & Trading Considerations
- Designed for daily charts, the strategy captures higher timeframe trends and minimizes noise.
- The entry and exit conditions are straightforward, aiming to avoid over-trading while letting clear signals dictate trade management.
- Always use proper risk management techniques and test the strategy thoroughly on historical data and in a simulated environment before applying it in live markets.
Disclaimer
This strategy is for educational and informational purposes only and does not constitute financial advice. Trading involves risk, and past performance is not indicative of future results. Always conduct your own research and consider your risk tolerance before making any trades.

S&P 500 E-Mini TrackerThis script generates a reference price for the S&P 500 ETF - SPY based on the current price of the ES contract, which is an E-Mini Futures contract representing the S&P 500 index. The indicator plots this reference price on the chart, providing a unique view of the relationship between these two popular markets.
Advantages:
Identifies divergence between the ES and SPY prices, indicating potential trading opportunities or shifts in market sentiment.
Confirms trends by showing the correlation between the ES and SPY prices.
Eliminates the need for multiple charts, allowing traders to focus on a single screen and make more informed decisions.
Customizable Parameters:
Color Scheme: Choose from various color options to customize the appearance of the indicator.
Line Style: Select from different line styles to change the visual representation of the reference price.
Divisor: Set the dividing factor to adjust the ratio at which the reference price is calculated. (Default value: 10). It is recommended to keep it at 10 for SPY.
To use it with other Stocks/ ETFs, use simple ratio math to calculate the divisor and you can customize the indicator to scale accordingly.
By using this indicator, traders can gain a deeper understanding of the relationship between the E-Mini and SPY markets, making it easier to identify trading opportunities and confirm trends.

Simple RSI stock Strategy [1D] The "Simple RSI Stock Strategy " is designed to long-term traders. Strategy uses a daily time frame to capitalize on signals generated by the Relative Strength Index (RSI) and the Simple Moving Average (SMA). This strategy is suitable for low-leverage trading environments and focuses on identifying potential buy opportunities when the market is oversold, while incorporating strong risk management with both dynamic and static Stop Loss mechanisms.
This strategy is recommended for use with a relatively small amount of capital and is best applied by diversifying across multiple stocks in a strong uptrend, particularly in the S&P 500 stock market. It is specifically designed for equities, and may not perform well in other markets such as commodities, forex, or cryptocurrencies, where different market dynamics and volatility patterns apply.
Indicators Used in the Strategy:
1. RSI (Relative Strength Index):
- The RSI is a momentum oscillator used to identify overbought and oversold conditions in the market.
- This strategy enters long positions when the RSI drops below the oversold level (default: 30), indicating a potential buying opportunity.
- It focuses on oversold conditions but uses a filter (SMA 200) to ensure trades are only made in the context of an overall uptrend.
2. SMA 200 (Simple Moving Average):
- The 200-period SMA serves as a trend filter, ensuring that trades are only executed when the price is above the SMA, signaling a bullish market.
- This filter helps to avoid entering trades in a downtrend, thereby reducing the risk of holding positions in a declining market.
3. ATR (Average True Range):
- The ATR is used to measure market volatility and is instrumental in setting the Stop Loss.
- By multiplying the ATR value by a custom multiplier (default: 1.5), the strategy dynamically adjusts the Stop Loss level based on market volatility, allowing for flexibility in risk management.
How the Strategy Works:
Entry Signals:
The strategy opens long positions when RSI indicates that the market is oversold (below 30), and the price is above the 200-period SMA. This ensures that the strategy buys into potential market bottoms within the context of a long-term uptrend.
Take Profit Levels:
The strategy defines three distinct Take Profit (TP) levels:
TP 1: A 5% from the entry price.
TP 2: A 10% from the entry price.
TP 3: A 15% from the entry price.
As each TP level is reached, the strategy closes portions of the position to secure profits: 33% of the position is closed at TP 1, 66% at TP 2, and 100% at TP 3.
Visualizing Target Points:
The strategy provides visual feedback by plotting plotshapes at each Take Profit level (TP 1, TP 2, TP 3). This allows traders to easily see the target profit levels on the chart, making it easier to monitor and manage positions as they approach key profit-taking areas.
Stop Loss Mechanism:
The strategy uses a dual Stop Loss system to effectively manage risk:
ATR Trailing Stop: This dynamic Stop Loss adjusts based on the ATR value and trails the price as the position moves in the trader’s favor. If a price reversal occurs and the market begins to trend downward, the trailing stop closes the position, locking in gains or minimizing losses.
Basic Stop Loss: Additionally, a fixed Stop Loss is set at 25%, limiting potential losses. This basic Stop Loss serves as a safeguard, automatically closing the position if the price drops 25% from the entry point. This higher Stop Loss is designed specifically for low-leverage trading, allowing more room for market fluctuations without prematurely closing positions.
to determine the level of stop loss and target point I used a piece of code by RafaelZioni, here is the script from which a piece of code was taken
Together, these mechanisms ensure that the strategy dynamically manages risk while offering robust protection against significant losses in case of sharp market downturns.
The position size has been estimated by me at 75% of the total capital. For optimal capital allocation, a recommended value based on the Kelly Criterion, which is calculated to be 59.13% of the total capital per trade, can also be considered.
Enjoy !

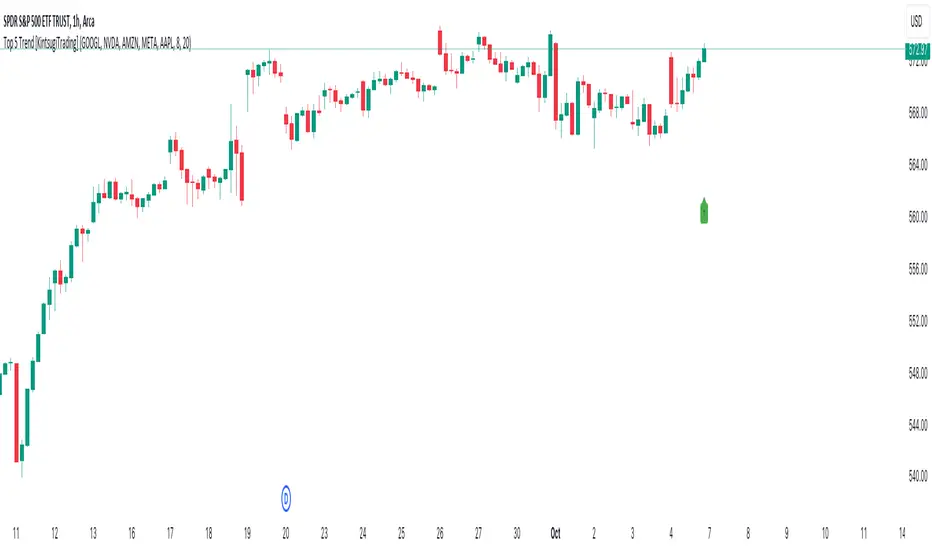
Top 5 Trend [KintsugiTrading]Top 5 Trend
This script provides a visual indicator for tracking the average trend of five selected stocks. By calculating the exponential moving average (EMA) of the closing price of the five selected stocks, the indicator helps users quickly assess overall market sentiment. The indicator's original purpose was to inform the user of the direction of the five largest stocks that make up ~25% of the S&P 500.
Key Features:
Custom Stock Selection: Choose any five stocks to monitor and visualize their combined trend.
EMA-Based Trend: The indicator compares a fast and slow EMA to determine the direction of the trend. When the fast EMA is above the slow EMA, the trend is considered bullish (uptrend); otherwise, it's bearish (downtrend).
Customizable Colors: You can easily customize the colors for both uptrends and downtrends, giving you control over the visual representation of the trend.
Trend Bar Display: For an easy, sleek, and simple reference - The script displays a trend arrow in the lower-right corner of the chart for bullish momentum and a trend arrow in the top-right corner of the chart for bearish momentum.
This indicator is perfect for traders who want to monitor the combined movement of a group of major stocks in order to easily compare strengths or weaknesses. It is a key visual aid in understanding if the overall sentiment is bullish or bearish based on the selected stocks' performance, thus making sure the user is always trading on the right side of momentum.
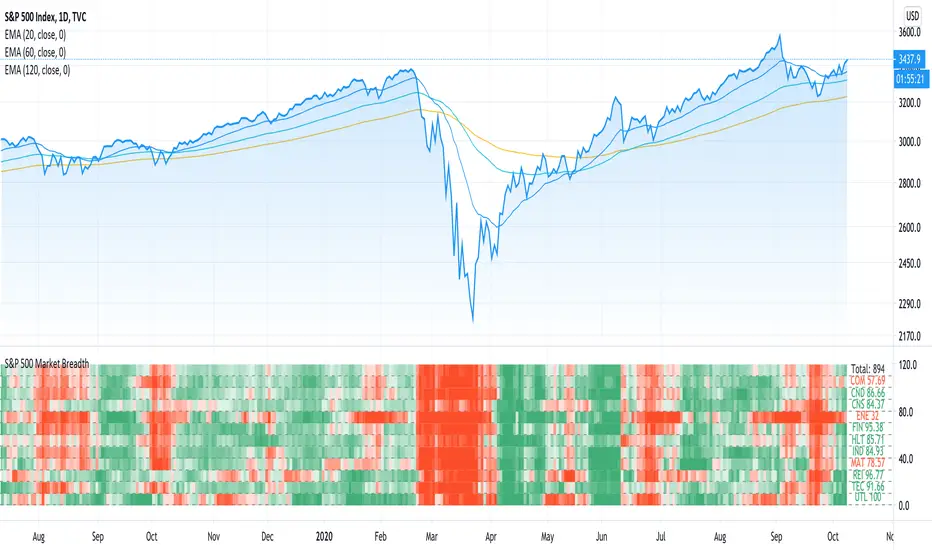
Market Breadth - AsymmetrikMarket Breadth - Asymmetrik User Manual
Overview
The Market Breadth - Asymmetrik is a script designed to provide insights into the overall market condition by plotting three key indicators based on stocks within the S&P 500 index. It helps traders assess market momentum and strength through visual cues and is especially useful for understanding the proportion of stocks trading above their respective moving averages.
Features
1. Market Breadth Indicators:
- Breadth 20D (green line): Represents the percentage of stocks in the S&P 500 that are above their 20-day moving average.
- Breadth 50D (yellow line): Represents the percentage of stocks in the S&P 500 that are above their 50-day moving average.
- Breadth 100D (red line): Represents the percentage of stocks in the S&P 500 that are above their 100-day moving average.
2. Horizontal Lines for Context:
- Green line at 10%
- Lighter green line at 20%
- Grey line at 50%
- Light red line at 80%
- Dark red line at 90%
3. Background Color Alerts:
- Green background when all three indicators are under 20%, indicating a potential oversold market condition.
- Red background when all three indicators are over 80%, indicating a potential overbought market condition.
Interpreting the Indicator
- Market Breadth Lines: Observe the plotted lines to assess the percentage of stocks above their moving averages.
- Horizontal Lines: Use the horizontal lines to quickly identify important threshold levels.
- Background Colors: Pay attention to background colors for quick insights:
- Green: All indicators suggest a potentially oversold market condition (below 20).
- Red: All indicators suggest a potentially overbought market condition (above 80).
Troubleshooting
- If the indicator does not appear as expected, please contact me.
- This indicator works only on daily and weekly timeframes.
Conclusion
This Market Breadth Indicator offers a visual representation of market momentum and strength through three key indicators, helping you identify potential buying and selling zones.

[TTI] Eric Krull's YTD Market Indexes––––HISTORY & CREDITS 🏦
The Eric Krull's Index and Sector Performance Indicator is a powerful tool designed to provide users with a comprehensive view of the market's health and leading sectors. This innovative indicator analyzes various indexes and sectors, including the Nasdaq Composite, Renaissance IPO ETF, NYSE Composite, DJIA, and SP500, as well as 11 custom (user input) ETFs representing major sectors. By offering a detailed look at these indexes and sectors, users can better understand market trends and make informed trading decisions. Credit for the indicator goes to Eric Krull from the Lifecycle Trade team who has showcased the idea for it.
––––WHAT IT DOES 💡
The Eric Krull's Index and Sector Performance Indicator allows traders to:
👉 Monitor the performance of various market indexes, such as the Nasdaq Composite, Renaissance IPO ETF, NYSE Composite, DJIA, and SP500 and compare them to one another
👉Track the performance of 11 user input tickers or ETFs representing major sectors, providing insights into market trends and sector strength (could also compare stocks or other instruments like bonds, crypto or FOREX)
👉Assess overall market health by analyzing the Year-to-Date (YTD) performance of the selected indexes and input tickers.
👉Calculate where in the year to date range is the ticker/sector currently since the beginning of the year.
––––HOW TO USE IT 🔧
Using the Eric Krull's Index and Sector Performance Indicator is simple:
👉Add the indicator to your TradingView chart by searching for " Eric Krull's YTD Market Indexes" in the indicators list.
👉Customize the indicator by entering your desired symbols for the 11 custom ETFs, representing the major sectors you wish to analyze.
👉Adjust the table position on your chart by selecting from the available options: Top Left, Top Center, Top Right, Middle Left, Middle Center, Middle Right, Bottom Left, Bottom Center, or Bottom Right.
👉Review the table to analyze the YTD performance, percentage change, and range of each index and sector, which will help you identify leading sectors and gauge overall market health. Compare the sectors against one another to see where money are flowing in and also compare the overall performance in the index.
By utilizing the Eric Krull's Index and Sector Performance Indicator, you can make informed trading decisions based on the current market trends and sector performance. Stay ahead of the market by understanding which sectors are leading and use this knowledge to adapt your trading strategy accordingly.

S5TH [SP500]This indicator is based on the percentage of S&P 500 Stocks Above 200-Day Moving Average ( S5TH )

Market StatsThis script escapes much of the subjective technical analysis and discretionary trading in general. With this Script/Indicator, you will be able to have access to the statistics tested day by day in the markets, statistics that will be a decisive support in your trading plan. Its analysis and creation is based on the quantitative trading system, since these statistics have a testing and database behind, which makes it a potential indicator for your trading.
You can change the time of the market you want to operate, also the colors of the labels of the statistics, their distance, color of the letters, fully editable to adapt it to the type of market you operate.
Its design involves values of the previous session ( RTH ) and extension session (OVERNIGHT), so it will be complemented with markets that are assimilated to that configuration (indices, stocks, futures, CFDs, forex, commodities ) maybe you can adapt it with cryptocurrencies, but being 24/7 you would have to modify its schedule.
Important levels included:
YHOD: Yesterday High of Day
ONH: Onvernight High
ONM: Overnight Mid
YPOC: Yesterday Point of Control
HALFGAP: Close Price Mid
GAP: Yesterday Close Price
ONL: Overnight Low
YLOD: Yesterday Low of Day
IBH: Initial Balance High
IBL: Initial Balance Low
The IBH and IBL levels will appear after 60 minutes into the session, indicating our balance zone. The one that will add more statistics to our trading.
_________________________________________________________________________________________________________________________________________________________________________________________________________
Este script, escapa mucho del análisis técnico subjetivo y del trading discrecional en general. Con este Script/Indicador, podrás tener acceso a las estadísticas testeadas día a día en los mercados, estadísticas que serán un apoyo decisivo en tu plan de trading. Su análisis y creación se basa en el sistema de trading cuantitativo, ya que estas estadísticas, tienen un testeo y base de datos por detrás, lo cual lo hace un indicador potencial para tu trading.
Podrás modificar el horario del mercado que quieres operar, también los colores de las etiquetas de las estadísticas, su distancia, color de las letras, completamente editable para que lo adaptes al tipo de mercado que operas.
Su diseño implica valores de la sesión anterior ( RTH ) y sesión de extensión (OVERNIGHT), por lo que se complementará con los mercados que se asimilen a esa configuración (índices, acciones, futuros, CFDs, forex, commodities ) quizás lo puedas adaptar con criptomonedas, pero al ser 24/7 habría que modificar su programación.
Niveles importantes incluidos:
YHOD: Yesterday High of Day
ONH: Onvernight High
ONM: Overnight Mid
YPOC: Yesterday Point of Control
HALFGAP: Close Price Mid
GAP: Yesterday Close Price
ONL: Overnight Low
YLOD: yesterday Low of Day
IBH: Initial Balance High
IBL: Initial Balance Low
Los niveles de IBH y IBL, aparecerán después de 60 minutos iniciada la sesión, indicando así́, nuestra zona de balance. La que agregará más estadísticas a nuestra operativa.

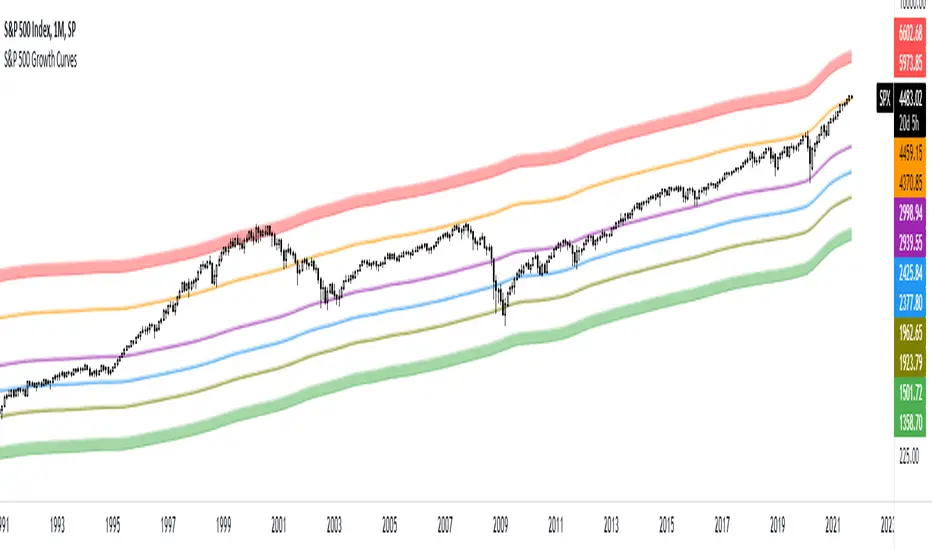
S&P 500 Growth CurvesThese curves are based on the growth of the money supply and the Fibonacci retracement levels. You can use this indicator to determine when the market is undervalued or overvalued. You can also see how often the price reacts to these curves.
Ichimoku with MACD/ CMF/ TSIThis is a very powerful trend strategy designed for markets such as stocks market , stock index and crypto.
For time frames I found out that 1h seems to do the trick.
Components:
Ichimoku full pack
MACD histogram
CMF oscillator
TSI oscillator
Rules for entry
Long :
For Ichimoku:Tenkan part of cloud is bigger than kijun, Chikou is above 0 , close of a candle is above the Senkou
MACD histogram is above 0
CMF oscillator is positive and bigger than 0.1
TSI oscillator is above 0
Short:
For Ichimoku:Tenkan part of cloud is smaller than kijun, Chikou is below 0 , close of a candle is belowthe Senkou
MACD histogram is below 0
CMF oscillator is negative and below -0.1
TSI oscillator is below 0
Rules for exit
This strategy does not have any risk management inside. Instead it exits whenver it receives an opposite signal form the original one used for entry.
If you have any questions let me know !

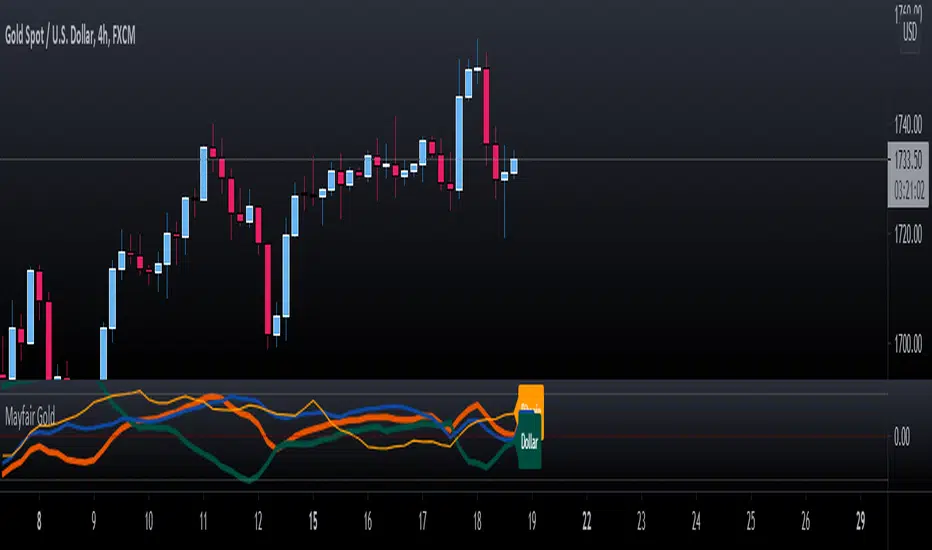
Mayfair GoldGold Oscillator using SPX & DXY to measure the moving average cross of the 3.
Gold in Orange
DXY in Green
SPX in Blue
To use this indicator, you need to see the strength (Orange above the 50%) line, use your own configurations and settings for the two MA's as a cross.
The idea is not to enter trades but to know when either SPX or/and DXY is getting stronger or weaker to help with profit-taking of gold positions.
As per any Oscillator - look for patterns, cross-overs and momentum shifts. (Treat like a MACD, RSI or Stochastic).
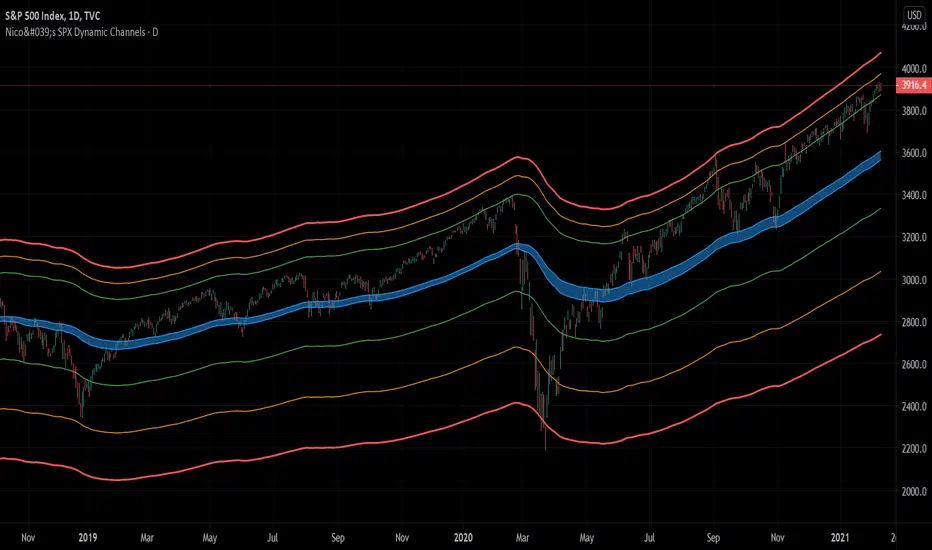
Nico's SPX Dynamic ChannelsTest of dynamic channels and some statistics made by hand.
This indicator was done specifically for the S&P500 index.
As you can see, below the 125 EMA there's a lot more volatility than in the upside. I've made some kind of a dynamic linear regression of the lows and the highs.
I've chosen the MA that best fits the SPX, and then calculated in Excel the percental mean and SDs of most important peaks and valleys that I've chosen in comparison to the 125 MA. This lead to the green, orange and red zones. BUT, I've calculated the peaks and valleys separately, as I assumed that a bear market and crashes have way more volatility than bull markets. That's why the difference between the upper and the lower channels.
The neutral blue zone is composed by an upper EMA of the highs and lower EMA of the lows. No MA in this script uses the close price as a source.
This MA makes sense because it represents a semester of trading, for this particular asset.
Backtest results
It's also interesting to try it here too, as it has a little bit more of data:
SPCFD:SPX
As it's not a trading system, I have no batting average nor ratios for this.
Still, the measures of the peaks and valleys are very accurate and repeat themselves over and over again. The results were:
3rd resistance: 12.88%
2nd resistance: 10.12%
1st resistance: 7.36%
1st support: -6.42%
2nd support: -14.8%
3rd support: -23.18%
All referred to the mean, which is the 125 EMA zone.
After the 1950's works like magic, but not before. You will see that it doesn't work in the great depression and it's crash.
How to use this indicator
Green = First grade support/resistance .
Orange = Second grade support/resistance . Caution.
Red = Third grade support/resistance . High chances of mean reversal.
Blue zone = This is the neutral zone, where the prices are not cheap nor expensive.
Often in a trending market, the price will have the blue zone as it's main support and when trending the price will stick to the green MA.
When the price touches the orange MA, the most probable is that it will return to the green MA.
If the price touches the red zone, there's a high chance that this is a big turning point and it will reverse to the mean (green or blue zone).
Imagine you've bought each time the price touched the red support, check that and you'll start liking this indicator. I think it is a great entry point for investors. The red resistance is good too, but of course it works for a short period of time.
I've backtested this indicator since the beginning of the dataset and it works like magic, but ONLY for the SPX index (spot price).
Leave a comment or some coins if you like it!!!
(I've posted it before like an analysis, not as a script, my bad)
Strategy - Bobo PAPATRHi I've revamped this bot mentioned in the linked idea to make it work with v4 of pine. In doing so there are some very significant changes to how it works. The main one is that it no longer uses traditional daily pivot calculations to calculate the bands. It creates a more dynamic intraday set of pivot points based on recent price action rather than yesterday's ohlc. As published, the bot is tuned for a 15 min time frame. But it actually works well on lower time frames you just need to adjust the lookback periods in settings a bit to re tune it. It's also tuned to ES really but will need tweaking for a different instrument at the very least.
The basic concept is recent price action is used to calculate a 'middle' around which red and green bands are located. Their position or width is largely determined by recent volatility. The middle line is again calculated from recent price action. The three lines from that form a tradeable range with green at the top and red at the bottom. The strategy is simple enough, it shorts as it sinks from outside red, and longs when rising above green. The basic principle being that once you enter that range you have a high probability of hitting the middle before you hit your stop loss. So the basic principle is you are trying to capture the inherent ranginess of liquid indices like S&P 500. That back and forth movement that happens. The bot is capturing this by fading extremes of a recent range but the problem with that is you'dd get murdered in a strong trend. To mitigate that there is a trend calculation running in the background the will prevent trading against firm trends mostly. So the bot should trade mostly in rangy conditions because that is what it is trying to do.
Bot will close issue close signals automatically upon crossing the middle, it also will close automatically at predefined stops or limits. These values are denominated in market mintick values. For example the CFD SPX500 has a mintick of 0.1. Therefore a stop value of 100 will equate to 10 points on the index. If trading the same market via ES1! the mintick value is different - 0.25. So in this case a value of 40 is required to set the stop at 10 points.
Anyway shout if you have questions. Hope it's useful.
TVC:SPX OANDA:SPX500USD
