SuperTrend + Relative Volume (Kernel Optimized)Introducing our new KDE Optimized Supertrend + Relative Volume Indicator!
This innovative indicator combines the power of the Supertrend indicator along with Relative Volume. It utilizes the Kernel Density Estimation (KDE) to estimate the probability of a candlestick marking a significant trend break or reversal.
❓How to Interpret the KDE %:
The KDE % is a crucial metric that reflects the likelihood that the current candlestick represents a true break in the SuperTrend line, supported by an increase in relative volume. It estimates the probability of a trend shift or continuation based on historical SuperTrend breaks and volume patterns:
Low KDE %: A lower probability that the current break is significant. Price action is less likely to reverse, and the trend may continue.
Moderate KDE - High KDE %: An increased possibility that a trend reversal or consolidation could occur. Traders should start watching for confirmation signals.
📌How Does It Work?
The SuperTrend indicator uses the Average True Range (ATR) to determine the direction of the trend and identifies when the price crosses the SuperTrend line, signaling a potential trend reversal. Here's how the KDE Optimized SuperTrend Indicator works:
SuperTrend Calculation: The SuperTrend indicator is calculated, and when the price breaks above (bullish) or below (bearish) the SuperTrend line, it is logged as a significant event.
Relative Volume: For each break in the SuperTrend line, we calculate the relative volume (current volume vs. the average volume over a defined period). High relative volume can suggest stronger confirmation of the trend break.
KDE Array Calculation: KDE is applied to the break points and relative volume data:
Define the KDE options: Bandwidth, Number of Steps, and Array Range (Array Max - Array Min).
Create a density range array using the defined number of steps, corresponding to potential break points.
Apply a Gaussian kernel function to the break points and volume data to estimate the likelihood of the trend break being significant.
KDE Value and Signal Generation: The KDE array is updated as each break occurs. The KDE % is calculated for the breakout candlestick, representing the likelihood of the trend break being significant. If the KDE value exceeds the defined activation threshold, a darker bullish or bearish arrow is plotted after bar confirmation. If the KDE value falls below the threshold, a more transparent arrow is drawn, indicating a possible but lower probability break.
⚙️Settings:
SuperTrend Settings:
ATR Length: The period over which the Average True Range (ATR) is calculated.
Multiplier: The multiplier applied to the ATR to determine the SuperTrend threshold.
KDE Settings:
Bandwidth: Determines the smoothness of the KDE function and the width of the influence of each break point.
Number of Bins (Steps): Defines the precision of the KDE algorithm, with higher values offering more detailed calculations.
KDE Threshold %: The level at which relative volume is considered significant for confirming a break.
Relative Volume Length: The number of historic candles used in calculating KDE %
Supertrend

Pivot Point+ Supertrend + EMA + Support/Resistance- LAXMANTAK98
Pivot Point Supertrend with EMA and Support/Resistance Indicator
This custom trading indicator combines the following key components to assist in market analysis and trade decision-making:
Pivot Points:
Pivot points are calculated based on a chosen price source (High, Low, Open, or Close). These levels are used to determine potential support and resistance zones.
Pivot Highs (Resistance) and Pivot Lows (Support) are plotted as labels on the chart for easy identification.
Supertrend Indicator:
The Supertrend is a trend-following indicator that helps to identify bullish or bearish trends.
It uses the Average True Range (ATR) to calculate dynamic support/resistance levels, with adjustable settings for ATR length and multiplier factor.
The trend direction is visually represented by green (bullish) and red (bearish) lines on the chart.
Exponential Moving Averages (EMA):
The indicator plots up to four EMAs with user-defined periods (e.g., 9, 21, 50, 200).
EMAs are commonly used to smooth out price data and identify trends over various timeframes.
Support and Resistance Levels:
Based on Pivot Points, support and resistance levels are plotted using crosses on the chart.
These levels indicate possible price reversal points, helping traders spot key zones for entry and exit.
Visual Alerts:
The indicator includes built-in alerts for trend changes and potential buy/sell signals based on the transition between uptrend and downtrend states.
This combined indicator allows traders to analyze trends, identify key levels for trading, and make more informed decisions by integrating Pivot Points, Supertrend, EMAs, and Support/Resistance in one cohesive system.

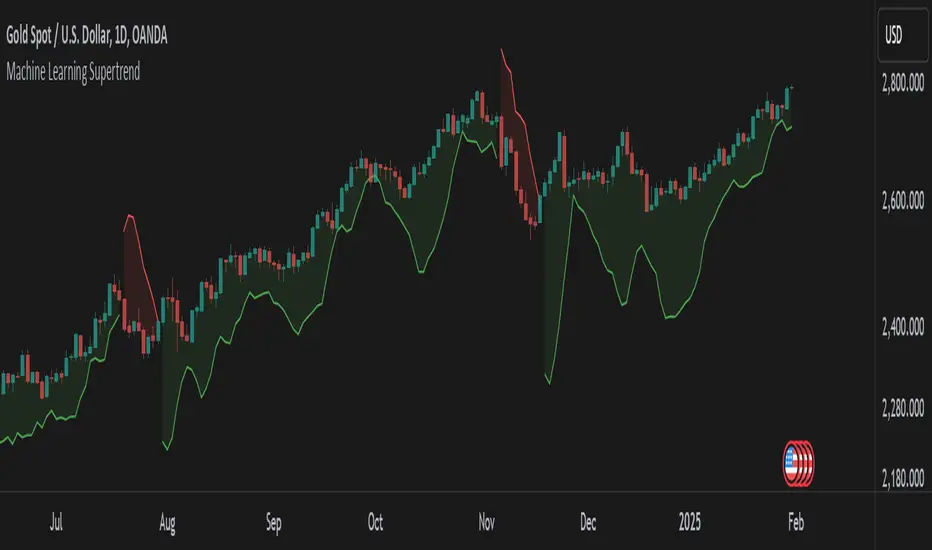
Machine Learning SupertrendThe Machine Learning Supertrend is an advanced trend-following indicator that enhances the traditional Supertrend with Gaussian Process Regression (GPR) and kernel-based learning. Unlike conventional methods that rely purely on historical ATR values, this indicator integrates machine learning techniques to dynamically estimate volatility and forecast future price movements, resulting in a more adaptive and robust trend detection system.
At the core of this indicator lies Gaussian Process Regression (GPR), which utilizes a Radial Basis Function (RBF) kernel to model price distributions and anticipate future trends. Instead of simply looking at past price action, it constructs a kernel matrix, enabling a probabilistic approach to price forecasting. This allows the indicator to not only detect current trends but also project potential trend reversals with greater accuracy.
By applying machine learning to ATR estimation, the ML Supertrend dynamically adjusts its thresholds based on predicted values rather than a fixed multiplier. This makes the trend signals more responsive to market conditions, reducing false signals and minimizing whipsaws often seen with traditional Supertrend indicators. The upper and lower bands are no longer static but evolve based on the underlying price structure, improving the reliability of trend shifts.
When the price crosses these adaptive levels, the indicator detects a trend change and plots it accordingly. Green signifies a bullish trend, while red indicates a bearish one. Alerts can also be triggered when the trend shifts, allowing traders to react quickly to potential reversals.
What makes this approach powerful is its ability to adapt to different market conditions. Traditional ATR-based methods use fixed parameters that might not always be optimal, whereas this ML-driven Supertrend continuously refines its estimations based on real-time data. The result is a more intelligent, less lagging, and highly adaptive trend-following tool.
This indicator is particularly useful for traders looking to enhance trend-following strategies with AI-driven insights. It reduces noise, improves signal reliability, and even offers a degree of trend forecasting, making it ideal for those who want a more advanced and dynamic alternative to standard Supertrend indicators.
This indicator is provided for educational and informational purposes only. It does not constitute financial advice, and past performance is not indicative of future results. Trading involves risk, and users should conduct their own research and use proper risk management before making investment decisions.
Enhanced Cumulative Volume Delta + MAThe Enhanced Cumulative Volume Delta (CVD) indicator is designed to help traders analyze the cumulative buying and selling pressure in the market by examining the delta between the up and down volume. By tracking this metric, traders can gain insights into the strength of a trend and potential reversals. This indicator uses advanced volume analysis combined with customizable moving averages to provide a more detailed view of market dynamics.
How to Use This Indicator:
Volume Delta Visualization:
The indicator plots the cumulative volume delta (CVD) using color-coded candles, where teal represents positive delta (buying pressure) and soft red represents negative delta (selling pressure).
Moving Averages:
Use the moving averages to smooth the CVD data and identify long-term trends. You can choose between SMA and EMA for each of the three available moving averages. The first and third moving averages are typically used for short-term and long-term trend analysis, respectively, while the second moving average can serve as a medium-term filter.
Arrow Markers:
The indicator will display arrows (green triangle up for crossing above, red triangle down for crossing below) when the CVD volume crosses the 3rd moving average. You can control the visibility of these arrows through the input parameters.
Volume Data:
The indicator provides error handling in case no volume data is available for the selected symbol, ensuring that you're not misled by incomplete data.
Practical Applications:
Trend Confirmation: Use the CVD and moving averages to confirm the overall trend direction and strength. Positive delta and a rising CVD can confirm an uptrend, while negative delta and a falling CVD indicate a downtrend.
Volume Breakouts: The arrows marking when the CVD crosses the 3rd moving average can help you spot potential volume breakouts or reversals, making them useful for entry or exit signals.
Volume Divergence: Pay attention to divergences between price and CVD, as these can often signal potential trend reversals or weakening momentum.

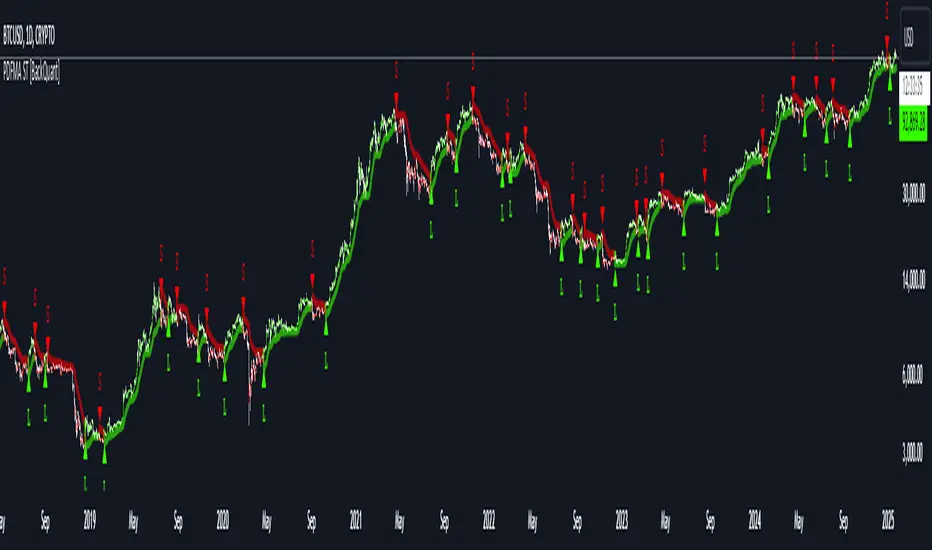
PDF-MA Supertrend [BackQuant]PDF-MA Supertrend
The PDF-MA Supertrend combines the innovative Probability Density Function (PDF) smoothing with the widely popular Supertrend methodology, creating a robust tool for identifying trends and generating actionable trading signals. This indicator is designed to provide precise entries and exits by dynamically adapting to market volatility while visualizing long and short opportunities directly on the chart.
Core Feature: PDF Smoothing
At the foundation of this indicator is the PDF smoothing technique, which applies a Probability Density Function to calculate a smoothed moving average. This method allows the indicator to assign adaptive weights to data points, making it responsive to market changes without overreacting to short-term volatility.
Key parameters include:
Variance: Controls the spread of the PDF weighting. A smaller variance results in sharper responses, while a larger variance smooths out the curve.
Mean: Shifts the PDF’s center, allowing traders to tweak how weights are distributed around the data points.
Smoothing Method: Offers the choice between EMA (Exponential Moving Average) and SMA (Simple Moving Average) for blending the PDF-smoothed data with traditional moving average methods.
By combining these parameters, the PDF smoothing creates a moving average that effectively captures underlying trends.
Supertrend: Adaptive Trend and Volatility Tracking
The Supertrend is a well-known volatility-based indicator that dynamically adjusts to market conditions using the ATR (Average True Range). In this script, the PDF-smoothed moving average acts as the price input, making the Supertrend calculation more adaptive and precise.
Key Supertrend Features:
ATR Period: Determines the lookback period for calculating market volatility.
Factor: Multiplies the ATR to set the distance between the Supertrend and the price. A higher factor creates wider bands, filtering out smaller price movements, while a lower factor captures tighter trends.
Dynamic Direction: The Supertrend flips its direction based on price interactions with the calculated upper and lower bands:
Uptrend : When the price is above the Supertrend, the direction turns bullish.
Downtrend : When the price is below the Supertrend, the direction turns bearish.
This combination of PDF smoothing and Supertrend calculation ensures that trends are detected with greater accuracy, while volatility filters out market noise.
Long and Short Signal Generation
The PDF-MA Supertrend generates actionable trading signals by detecting transitions in the trend direction:
Long Signal (𝕃): Triggered when the trend transitions from bearish to bullish. This is visually represented with a green triangle below the price bars.
Short Signal (𝕊): Triggered when the trend transitions from bullish to bearish. This is marked with a red triangle above the price bars.
These signals provide traders with clear entry and exit points, ensuring they can capitalize on emerging trends while avoiding false signals.
Customizable Visualization Options
The indicator offers a range of visualization settings to help traders interpret the data with ease:
Show Supertrend: Option to toggle the visibility of the Supertrend line.
Candle Coloring: Automatically colors candlesticks based on the trend direction:
Green for long trends.
Red for short trends.
Long and Short Signals (𝕃 + 𝕊): Displays long (𝕃) and short (𝕊) signals directly on the chart for quick identification of trade opportunities.
Line Color Customization: Allows users to customize the colors for long and short trends.
Alert Conditions
To ensure traders never miss an opportunity, the PDF-MA Supertrend includes built-in alerts for trend changes:
Long Signal Alert: Notifies when a bullish trend is identified.
Short Signal Alert: Notifies when a bearish trend is identified.
These alerts can be configured for real-time notifications via SMS, email, or push notifications, making it easier to stay updated on market movements.
Suggested Parameter Adjustments
The indicator’s effectiveness can be fine-tuned using the following guidelines:
Variance:
For low-volatility assets (e.g., indices): Use a smaller variance (1.0–1.5) for smoother trends.
For high-volatility assets (e.g., cryptocurrencies): Use a larger variance (1.5–2.0) to better capture rapid price changes.
ATR Factor:
A higher factor (e.g., 2.0) is better suited for long-term trend-following strategies.
A lower factor (e.g., 1.5) captures shorter-term trends.
Smoothing Period:
Shorter periods provide more reactive signals but may increase noise.
Longer periods offer stability and better alignment with significant trends.
Experimentation is encouraged to find the optimal settings for specific assets and trading strategies.
Trading Applications
The PDF-MA Supertrend is a versatile indicator suited to a variety of trading approaches:
Trend Following : Use the Supertrend line and signals to follow market trends and ride sustained price movements.
Reversal Trading : Spot potential trend reversals as the Supertrend flips direction.
Volatility Analysis : Adjust the ATR factor to filter out minor price fluctuations or capture sharp movements.
Final Thoughts
The PDF-MA Supertrend combines the precision of Probability Density Function smoothing with the adaptability of the Supertrend methodology, offering traders a powerful tool for identifying trends and volatility. With its customizable parameters, actionable signals, and built-in alerts, this indicator is an excellent choice for traders seeking a robust and reliable system for trend detection and entry/exit timing.
As always, backtesting and incorporating this indicator into a broader strategy are recommended for optimal results.
Adaptive Fourier Transform Supertrend [QuantAlgo]Discover a brand new way to analyze trend with Adaptive Fourier Transform Supertrend by QuantAlgo , an innovative technical indicator that combines the power of Fourier analysis with dynamic Supertrend methodology. In essence, it utilizes the frequency domain mathematics and the adaptive volatility control technique to transform complex wave patterns into clear and high probability signals—ideal for both sophisticated traders seeking mathematical precision and investors who appreciate robust trend confirmation!
🟢 Core Architecture
At its core, this indicator employs an adaptive Fourier Transform framework with dynamic volatility-controlled Supertrend bands. It utilizes multiple harmonic components that let you fine-tune how market frequencies influence trend detection. By combining wave analysis with adaptive volatility bands, the indicator creates a sophisticated yet clear framework for trend identification that dynamically adjusts to changing market conditions.
🟢 Technical Foundation
The indicator builds on three innovative components:
Fourier Wave Analysis: Decomposes price action into primary and harmonic components for precise trend detection
Adaptive Volatility Control: Dynamically adjusts Supertrend bands using combined ATR and standard deviation
Harmonic Integration: Merges multiple frequency components with decreasing weights for comprehensive trend analysis
🟢 Key Features & Signals
The Adaptive Fourier Transform Supertrend transforms complex wave calculations into clear visual signals with:
Dynamic trend bands that adapt to market volatility
Sophisticated cloud-fill visualization system
Strategic L/S markers at key trend reversals
Customizable bar coloring based on trend direction
Comprehensive alert system for trend shifts
🟢 Practical Usage Tips
Here's how you can get the most out of the Adaptive Fourier Transform Supertrend :
1/ Setup:
Add the indicator to your favorites, then apply it to your chart ⭐️
Start with close price as your base source
Use standard Fourier period (14) for balanced wave detection
Begin with default harmonic weight (0.5) for balanced sensitivity
Start with standard Supertrend multiplier (2.0) for reliable band width
2/ Signal Interpretation:
Monitor trend band crossovers for potential signals
Watch for convergence of price with Fourier trend
Use L/S markers for trade entry points
Monitor bar colors for trend confirmation
Configure alerts for significant trend reversals
🟢 Pro Tips
Fine-tune Fourier parameters for optimal sensitivity:
→ Lower Base Period (8-12) for more reactive analysis
→ Higher Base Period (15-30) to filter out noise
→ Adjust Harmonic Weight (0.3-0.7) to control shorter trend influence
Customize Supertrend settings:
→ Lower multiplier (1.5-2.0) for tighter bands
→ Higher multiplier (2.0-3.0) for wider bands
→ Adjust ATR length based on market volatility
Strategy Enhancement:
→ Compare signals across multiple timeframes
→ Combine with volume analysis
→ Use with support/resistance levels
→ Integrate with other momentum indicators

SuperTrend Heikin AshiSupertrend Heikin Ashi is an indicator based on the standard calculation of the Supertrend with the difference of using the Open and Close value of the Heikin Ashi candles instead of the normal Candle Sticks.
In this way the main characteristic of the HA candles is exploited, thus filtering movements that could generate false signals.
I recommend using SPY, SPX, QQQ to be aware of the market situation, not operating (or paying great attention) long on stocks when the indicator is red and the price is below the drawn line.

SuperTrend Volume [BigBeluga]SuperTrend Volume is an advanced trend-following indicator that combines the traditional SuperTrend method with a normalized volume visualization inside trend bands, offering enhanced insight into market dynamics and volume activity.
🔵 Key Features:
Dynamic Trend Bands: The indicator uses the SuperTrend methodology to plot upper and lower trend bands, which adapt dynamically to price movements. Green bands indicate an uptrend, while purple bands indicate a downtrend.
Normalized Volume Visualization:
Inside the trend bands, normalized volume is displayed to highlight the intensity of market participation during trends.
Users can choose between two visualization types:
Bars: Displays volume as vertical bars within the bands.
Area: Represents volume as a shaded area for a smoother look.
Color-Coded Trends: Trend direction is color-coded:
Green for bullish trends.
Purple for bearish trends.
Volume Labels: Each bar or area has a label showing the normalized volume value 0-4 for easier interpretation.
Trend Change Detection: Automatically identifies trend reversals by recalculating the SuperTrend levels and adjusting volume visualization accordingly.
🔵 Usage:
Trend Identification: Use the color-coded trend bands to confirm the current market direction and identify potential reversals.
Volume Confirmation: Assess the strength of trends using normalized volume inside the bands. Higher normalized volume indicates stronger market conviction.
Peak Volume can be a signal of the mean reversion of price
Customization: Adjust the visualization type (bars or area) based on personal preference or analysis needs.
Dynamic Updates: Use volume labels and trend bands to stay updated on market shifts and trading opportunities in real time.
SuperTrend Volume is a versatile tool suitable for traders who want to combine trend analysis with volume dynamics for a more comprehensive view of the market. It is ideal for identifying trend strength, detecting reversals, and gauging the participation of market players during directional moves.

[EmreKb] Dynamic Factor SupertrendThe Dynamic Factor Supertrend is an innovative variation of the classic Supertrend indicator, designed to provide traders with more accurate trend signals while reducing the impact of false breakouts. Unlike the traditional Supertrend, which relies on a fixed multiplier (Factor) applied to the Average True Range (ATR), this enhanced version introduces a dynamic adjustment mechanism based on price movements relative to the Supertrend line.
This indicator works by assessing the distance between the price and the Supertrend line. When the price moves significantly beyond the typical ATR × Factor distance, the remaining gap is recalculated using a Dynamic Factor. This additional scaling adjusts the base factor, effectively modifying the Supertrend line to better reflect current market conditions. This process ensures that the trend line adapts dynamically to changes in price behavior, reducing noise and improving signal reliability in volatile markets.
One of the key advantages of the Dynamic Factor Supertrend is its ability to minimize false trend reversals. By incorporating the Dynamic Factor adjustment, the indicator becomes more resilient to minor price fluctuations that could otherwise trigger incorrect signals. This makes it particularly effective in markets where volatility is high, or during periods of choppy price action, where traditional Supertrend indicators often struggle to maintain accuracy.
Traders can use the Dynamic Factor Supertrend to identify clear trend directions, with uptrends signaled when the price is above the trend line and downtrends when it is below. The Dynamic Factor parameter can be fine-tuned to match individual trading styles, offering greater flexibility. A lower value makes the trend line more responsive to price changes, while a higher value provides more stability by reducing the frequency of adjustments.
In summary, the Dynamic Factor Supertrend is an advanced trend-following tool that combines the foundational concepts of the Supertrend with a novel dynamic adjustment mechanism. It offers traders a more reliable way to navigate complex market conditions, making it a valuable addition to any trading strategy. This indicator is particularly well-suited for those seeking to reduce false signals and enhance the accuracy of their trend analysis in all market environments.

[EmreKb] Supertrend FakeoutSupertrend Fakeout
This script is an enhanced version of the classic Supertrend indicator. It incorporates an additional feature that ensures trend reversals are more reliable by introducing a Fakeout Index Limit and a Fakeout ATR Mult. This helps avoid false trend changes that could occur due to short-term price fluctuations or market noise.
How It Works:
The Supertrend indicator uses Average True Range (ATR) and a multiplier to determine the direction of the trend. When the price is above the Supertrend line, it indicates an uptrend; when the price is below the Supertrend line, it signals a downtrend.
This version goes a step further by adding the following checks before confirming a trend reversal:
The script will monitor if the price moves "Fakeout ATR Mult" ATR away from the Supertrend line after a potential breach. This distance helps ensure that the trend change is significant and not just a minor fluctuation.
In addition, the script checks the price action for a specific number of bars, which is controlled by the Fakeout Index Limit. This limit determines how many bars the price must remain below (for a downtrend) or above (for an uptrend) the Supertrend line before the trend is officially reversed.

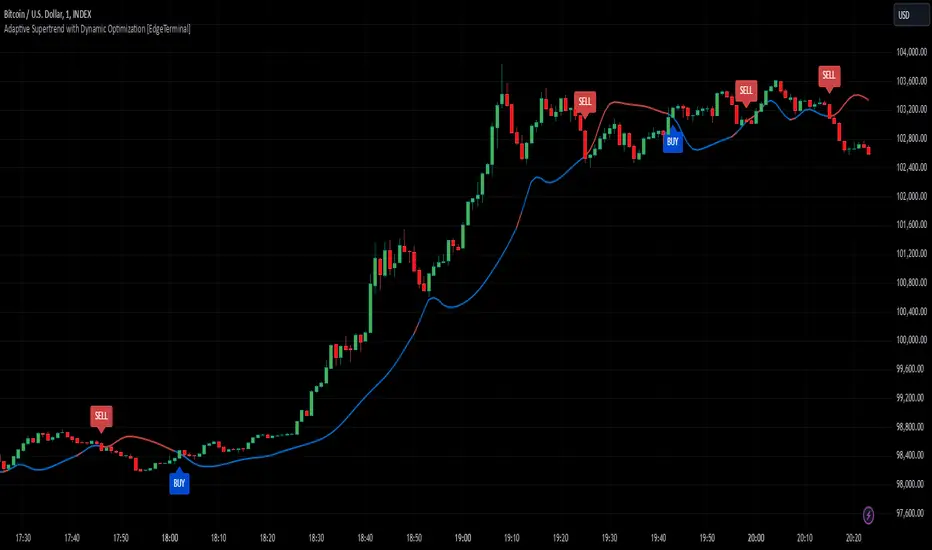
Adaptive Supertrend with Dynamic Optimization [EdgeTerminal]The Enhanced Adaptive Supertrend represents a significant evolution of the traditional Supertrend indicator, incorporating advanced mathematical optimization, dynamic volatility adjustment, intelligent signal filtering, reduced noise and false positives.
Key Features
Dynamic volatility-adjusted bands
Self-optimizing multiplier
Intelligent signal filtering system
Cooldown period to prevent signal clustering
Clear buy/sell signals with optimal positioning
Smooth trend visualization
RSI and MACD integration for confirmation
Performance-based optimization
Dynamic Band Calculation
Dynamic Band Calculation automatically adapts to market volatility, generates wider bands in volatile periods, reducing false signals. It also generates tighter bands in stable periods, capturing smaller moves and smooth transitions between different volatility regimes.
RSI Integration
The RSI and MACD play multiple crucial roles in the Adaptive Supertrend.
It first helps with momentum factor calculation. This dynamically adjusts band width based on momentum conditions. When the RSI is oversold, bands widen by 20% to prevent false signals during strong downtrends and provide more room for price movements in extreme conditions.
When the RSI is overbought, brands tighten by 20% and they become more sensitive to potential reversals to help catch trend changes earlier.
This reduces false signals in strong trends, helps detect potential reversals earlier than the usual, create adaptive band width based on market conditions and finally, better protection against whipsaws.
MACD Integration
The MACD in this supertrend indicator serves as a trend confirmation tool. The idea is to use MACD crossovers to confirm trend changes to reduce false trend change signals and enhance the signal quality.
For this to become a signal, MACD crossovers must align with price movement to help filter out weak or false signals, which acts as an additional layer of trend confirmation.
Additionally, MACD line position relative to signal line indicates trend strength, helps maintain positions in strong trends and assists in early detection of trend weakening.
Momentum Integration
Momentum Integration prevents false signals in extreme conditions, It adjusts dynamic bands based on market momentum, improves trend confirmation in strong moves and reduces whipsaws during consolidations.
Improved signals
There are a few systems to generate better signals, allowing for generally faster signals compared to original supertrend, such as:
Enforced cooldown period between signals
Prevents signal clustering
Clearer entry/exit points
Reduced false signals during choppy markets
Performance Optimization
This script implements a Sharpe ratio-inspired optimization algorithm to balance returns against risk, penalize large drawdowns, adapt parameters in real-time and improve risk-adjusted performance
Parameter Settings
ATR Period: 10 (default) - adjust based on timeframe
Initial Multiplier: 3.0 (default) - will self-optimize
Optimization Period: 50 (default) - longer periods for more stability
Smoothing Period: 3 (default) - adjust for signal smoothness
Best Practices
Use on multiple timeframes for confirmation
Allow the optimization process to run for at least 50 bars
Monitor the adaptive multiplier for trend strength indication
Consider RSI and MACD alignment for stronger signals
Ultra Smart TrailIntroduction
The Ultra Smart Trail indicator is a comprehensive tool for traders seeking to identify and follow market trends efficiently. Combining dynamic trend detection with adaptive price bands, this indicator simplifies the process of understanding market direction and strength. It provides clear visual cues and customizable settings, catering to both novice and experienced traders.
Detailed Description
The Ultra Smart Trail indicator works by calculating a Trend Flow Line (TFL) using a hybrid moving average technique. This TFL dynamically adjusts to market conditions, smoothing out price fluctuations while remaining responsive to significant market shifts.
.........
Trend Flow Line (TFL)
A color-coded line indicating bullish, bearish, or neutral trends based on price movement relative to the TFL.
The TFL uses a combination of weighted moving averages (WMA) and double-weighted moving averages (DWMA) for accuracy.
.....
Dynamic Price Bands
The indicator plots upper and lower bands around the TFL, based on customizable multipliers of standard deviation. These bands adapt dynamically to volatility, helping traders spot overbought or oversold conditions.
The script calculates standard deviation-based bands with customizable multipliers, enabling precise adjustment to trading styles or instruments.
.....
Uptrend/Downtrend Highlights
The background and price bands visually differentiate trending and ranging markets, making it easier to identify high-probability trade setups.
.....
Reversal Alerts
By analyzing the relationship between price and bands, the script highlights potential reversals or continuation zones with distinct levels and fills.
.........
This indicator is a powerful addition to any trader’s toolkit, simplifying market analysis and enhancing decision-making.

UVR Crypto TrendINDICATOR OVERVIEW: UVR CRYPTO TREND
The UVR Crypto Trend indicator is a custom-built tool designed specifically for cryptocurrency markets, utilizing advanced volatility, momentum, and trend-following techniques. It aims to identify trend reversals and provide buy and sell signals by analyzing multiple factors, such as price volatility(UVR), RSI (Relative Strength Index), CMF (Chaikin Money Flow), and EMA (Exponential Moving Average). The indicator is optimized for CRYPTO MARKETS only.
KEY FEATURES AND HOW IT WORKS
Volatility Analysis with UVR
The UVR (Ultimate Volatility Rate) is a proprietary calculation that measures market volatility by comparing significant price extremes and smoothing the data over time.
Purpose: UVR aims to reduce noise in low-volatility environments and highlight significant movements during higher-volatility periods. While it strives to improve filtering in low-volatility conditions, it does not guarantee perfect performance, making it a balanced and adaptable tool for dynamic markets like cryptocurrency.
HOW UVR (ULTIMATE VOLATILITY RATE) IS CALCULATED
UVR is calculated using a method that ensures precise measurement of market volatility by comparing price extremes across consecutive candles:
Volatility Components:
Two values are calculated to represent potential price fluctuations:
The absolute difference between the current candle's high and the previous candle's low:
Volatility Component 1=∣High−Low ∣
The absolute difference between the previous candle's high and the current candle's low:
Volatility Component 2=∣High −Low∣
Volatility Ratio:
The larger of the two components is selected as the Volatility Ratio, ensuring UVR captures the most significant movement:
Volatility Ratio=max(Volatility Component 1,Volatility Component 2)
Smoothing with SMMA:
To stabilize the volatility calculation, the Volatility Ratio is smoothed using a Smoothed Moving Average (SMMA) over a user-defined period (e.g., 14 candles):
UVR=(UVR(Previous)×(Period−1)+Volatility Ratio)/Period
This calculation ensures UVR adapts dynamically to market conditions, focusing on significant price movements while filtering out noise.
RSI FOR MOMENTUM DETECTION
RSI (Relative Strength Index) identifies overbought and oversold conditions.
Trend Confirmation at the 50 Level
RSI values crossing above 50 signal the potential start of an upward trend.
RSI values crossing below 50 indicate the potential start of a downward trend.
Key Reversals at Extreme Levels
RSI detects trend reversals at overbought (>70) and oversold (<30) levels.
For example:
Overbought Trend Reversal: RSI >70 followed by bearish price action signals a potential downtrend.
Oversold Trend Reversal: RSI <30 with bullish confirmation signals a potential uptrend.
Rare Extreme RSI Readings
Extreme levels, such as RSI <12 (oversold) or RSI >88 (overbought), are used to identify rare yet powerful reversals.
---HOW IT DIFFERS FROM OTHER INDICATORS---
Using UVR High and Low Values
The Ultimate Volatility Rate (UVR) focuses on analyzing the high and low price ranges of the market to measure volatility.
Unlike traditional trend indicators that rely primarily on momentum or moving average crossovers, UVR leverages price extremes to better identify trend reversals.
This approach ensures fewer false signals during low-volatility phases and more accurate trend detection during high-volatility conditions.
UVR as the Core Component
The indicator is fundamentally built around UVR as the primary filter, while supporting tools like RSI (momentum detection), CMF (volume confirmation), and EMA (trend validation) complement its functionality.
By integrating these additional components, the indicator provides a multidimensional analysis rather than relying solely on a single approach.
Dynamic Adaptation to Volatility
UVR dynamically adjusts to market conditions, striving to improve filtering in low-volatility phases. While not flawless, this approach minimizes false signals and adapts more effectively to varying levels of market activity.
Trend Clouds for Visual Guidance
UVR-based dynamic clouds visually mark high and low price areas, highlighting potential consolidation or retracement zones.
These clouds serve as guides for setting stop-loss or take-profit levels, offering clear risk management strategies.
BUY AND SELL SIGNAL LOGIC
BUY CONDITIONS
Momentum-Based Buy-Entry
RSI >50, CMF >0, and the close price is above EMA50.
The price difference between open and close exceeds a threshold based on UVR.
Oversold Reversal
RSI <30 and CMF >0 with a strong bullish candle (close > open and UVR-based sensitivity filter).
Breakout Confirmation
The price breaks above a previously identified resistance, with conditions for RSI and CMF supporting the breakout.
Reversal from Oversold RSI Extreme
RSI <12 on the previous candle with a strong rebound on the current candle with UVR confirmation filter.
SELL CONDITIONS
Momentum-Based Sell-Entry
RSI <50, CMF <0, and the close price is below EMA50.
The price difference between open and close exceeds the UVR threshold.
Overbought Reversal
RSI >70 with bearish price action (open > close and UVR-based sensitivity filter).
Breakdown Confirmation
The price breaks below a previously identified support, with RSI and CMF supporting the breakdown.
Reversal from Overbought RSI Extreme
RSI >88 on the previous candle with a bearish confirmation on the current candle with UVR confirmation filter.
BUY AND SELL SIGNALS VISUALIZATION
The UVR Crypto Trend Indicator visually represents buy and sell conditions using dynamic plots, making it easier for traders to interpret and act on the signals. Below is an explanation of the visual representation:
Buy Signals and Visualization
Signal Trigger:
A buy signal is generated when one of the defined Buy Conditions is met (e.g., RSI >50, CMF >0, price above EMA50).
Visual Representation:
A blue upward arrow appears at the candle where the buy condition is triggered.
A blue cloud forms above the price candles, representing the strength of the bullish trend. The cloud dynamically adapts to market volatility, using the UVR calculation to mark support zones or consolidation levels.
Purpose of the Blue Cloud:
It acts as a visual guide for price movements and stay horizontal when the trend is not moving up
Sell Signals and Visualization
Signal Trigger:
A sell signal is generated when one of the defined Sell Conditions is met (e.g., RSI <50, CMF <0, price below EMA50).
Visual Representation:
A red downward arrow appears at the candle where the sell condition is triggered.
A red cloud forms below the price candles, representing the strength of the bearish trend. Like the blue cloud, it uses the UVR calculation to dynamically mark resistance zones or potential retracement levels.
Purpose of the Red Cloud:
It acts as a visual guide for price movements and stay horizontal when the trend is not moving down.
CONCLUSION
The UVR Crypto Trend indicator provides a powerful tool for trend reversal detection by combining volatility analysis, momentum confirmation, and trend-following techniques. Its unique use of the Ultimate Volatility Rate (UVR) as a core element, supported by proven indicators like RSI, CMF, and EMA, ensures reliable and actionable signals tailored for the crypto market's dynamic nature. By leveraging UVR’s high and low price range analysis, it achieves a level of precision that traditional indicators lack, making it a high-performing system for cryptocurrency traders.

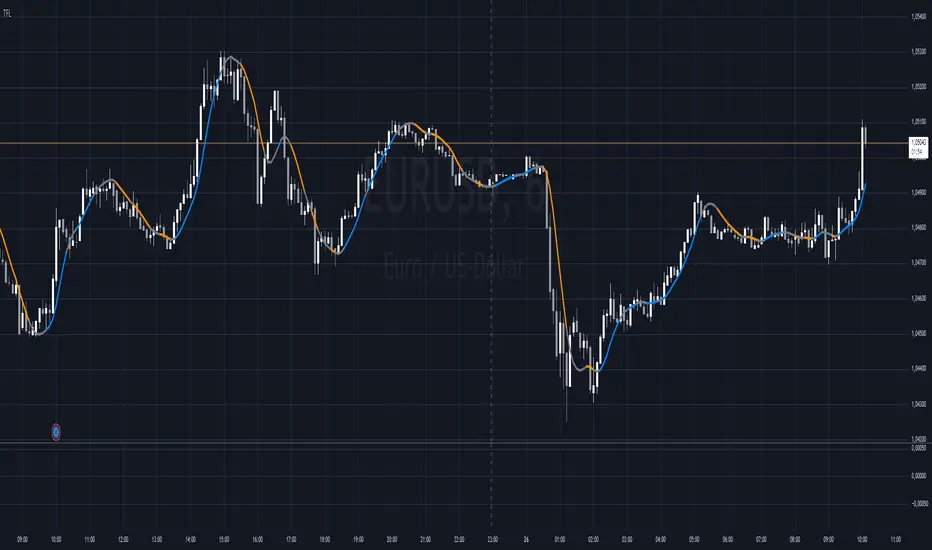
Trend Flow Line (TFL)The Trend Flow Line (TFL) is a versatile moving average indicator that dynamically adjusts to trends using a combination of Hull and Weighted Moving Averages, with optional color coding for bullish and bearish trends.
Introduction
The Trend Flow Line (TFL) is a powerful indicator designed to help traders identify and follow market trends with precision. It combines multiple moving average techniques to create a responsive yet smooth trendline. Whether you're a beginner or an experienced trader, the TFL can enhance your chart analysis by highlighting key price movements and trends.
Detailed Description
The Trend Flow Line (TFL) goes beyond traditional moving averages by leveraging a hybrid approach to calculate trends.
Here's how it works:
.........
Combination of Hull and Weighted Moving Averages
The TFL integrates the Hull Moving Average (HMA), known for its fast responsiveness, and the Double Weighted Moving Average (DWMA), which offers smooth transitions.
The HMA is adjusted dynamically based on the user-defined length, ensuring adaptability to various trading styles and timeframes.
.....
Dynamic Smoothing
The TFL calculates its value by averaging the HMA and DWMA, creating a balanced line that responds to market fluctuations without excessive noise.
This balance makes it ideal for identifying both short-term reversals and long-term trends.
.....
Customizable Features
Timeframe: Analyze the indicator on custom timeframes, independent of the chart's current timeframe.
Color Coding: Optional color settings visually differentiate bullish (uptrend) and bearish (downtrend) phases.
Line Width: Adjust the line thickness to suit your chart preferences.
Color Smoothness: Fine-tune how quickly the color changes to reflect trend shifts, providing a visual cue for potential reversals.
The TFL's algorithm ensures a blend of precision and adaptability, making it suitable for any market or trading strategy.
.........
The Trend Flow Line (TFL) is an essential tool for traders looking to stay ahead of market trends while maintaining a clear and visually intuitive charting experience. It combines HMA and DWMA for trend sensitivity and smoothness.
Stock_Cloud-EMA,VWAP,ST Indicator_V1Stock_Cloud V1 - EMA, VWAP, SuperTrend Strategy Indicator
This indicator combines three powerful technical indicators (EMA, VWAP, and SuperTrend) to create a comprehensive trading system that helps identify high-probability trading setups when all components align.
Strategy Components & Logic:
• EMA (Exponential Moving Average): Acts as a dynamic support/resistance and trend direction indicator
• VWAP (Volume Weighted Average Price): Provides important institutional price levels and volume-based trend strength
• SuperTrend: Offers trend direction and potential reversal points
Why These Components Work Together:
1. EMA filters out market noise while maintaining responsiveness to price changes
2. VWAP adds volume-based price validation, especially useful for intraday trading
3. SuperTrend confirms trend direction and potential reversal points
4. When all three indicators align, it creates a high-probability setup
Signal Generation:
• Bullish Signal: Generated when price crosses above all three indicators (EMA, VWAP, and SuperTrend turns bullish)
• Bearish Signal: Generated when price crosses below all three indicators (EMA, VWAP, and SuperTrend turns bearish)
• Background color changes help visualize the current market condition
Settings:
- EMA Length: 20 (default, adjustable)
- SuperTrend Period: 10 (default, adjustable)
- SuperTrend Multiplier: 3.0 (default, adjustable)
How to Use:
1. Look for potential entries when all three indicators align
2. Small triangles mark key entry points when alignment occurs
3. Use background color as additional confirmation
4. Monitor price action relative to all three indicators for exit signals
Best Timeframes:
Works well on all timeframes, but particularly effective on 5-minute to daily charts for stocks and indices.
Note: This indicator combines traditional technical analysis tools in a unique way to provide clear, actionable signals. Always use proper risk management and consider other factors like market conditions and support/resistance levels.
Created by Stock_Cloud
Version 2.0

McCrayTrendTraders often rely on price breaking above or below the 50-day moving average (50D-MA) as a buy/sell signal. However, this approach frequently results in false breakouts, especially during low-volatility periods when price compression precedes major moves. To address this issue, we use an 8-day exponential moving average (8D-EMA) to represent price and focus on the crossovers between the 8D-EMA and the 48D-EMA as entry/exit signals. This method reduces noise in low-volatility conditions, enables earlier trend entries, and helps traders stay in trends longer.
The indicator incorporates a 111-day EMA (111D-EMA) to define market bias:
• Above the 111D-EMA: Bias is long, favoring buying and selling into cash.
• Below the 111D-EMA: Bias is short, favoring selling and buying into cash.
An exception to this rule occurs when a bullish cross happens within 40% of the 200-week moving average (200W-MA), as these conditions historically signal optimal times to acquire BTC.
Signals:
Buy signals:
• A bullish cross while price is above the 111D-EMA.
• A bullish cross near the 200W-MA threshold (optional setting).
Sell signals:
• A bearish cross while price is below the 111D-EMA.
Exit signals:
• Both EMAs turn red (for long trades) or green (for short trades).
• The shading between the 111D-EMA and 200W-MA turns red (for longs) or green (for shorts), if enabled.
Reversal opportunities:
• A buy or sell label during an exit signal may indicate a reversal point, allowing traders to take profit and reopen positions in the opposite direction.
The methodology behind this indicator has generated 132% alpha since October 6, 2015. Special thanks to Anurag Parashar for refining the stylistic elements of the indicator.

simple swing indicator-KTRNSE:NIFTY
1. Pivot High/Low as Lines:
Purpose: Identifies local peaks (pivot highs) and troughs (pivot lows) in price and draws horizontal lines at these levels.
How it Works:
A pivot high occurs when the price is higher than the surrounding bars (based on the pivotLength parameter).
A pivot low occurs when the price is lower than the surrounding bars.
These pivots are drawn as horizontal lines at the price level of the pivot.
Visualization:
Pivot High: A red horizontal line is drawn at the price level of the pivot high.
Pivot Low: A green horizontal line is drawn at the price level of the pivot low.
Example:
Imagine the price is trending up, and at some point, it forms a peak. The script identifies this peak as a pivot high and draws a red line at the price of that peak. Similarly, if the price forms a trough, the script will draw a green line at the low point.
2. Moving Averages (20-day and 50-day):
Purpose: Plots the 20-day and 50-day simple moving averages (SMA) on the chart.
How it Works:
The 20-day SMA smooths the closing price over the last 20 days.
The 50-day SMA smooths the closing price over the last 50 days.
These lines provide an overview of short-term and long-term price trends.
Visualization:
20-day SMA: A blue line showing the 20-day moving average.
50-day SMA: An orange line showing the 50-day moving average.
Example:
When the price is above both moving averages, it indicates an uptrend. If the price crosses below these averages, it might signal a downtrend.
3. Supertrend:
Purpose: The Supertrend is an indicator based on the Average True Range (ATR) and is used to track the market trend.
How it Works:
When the market is in an uptrend, the Supertrend line will be green.
When the market is in a downtrend, the Supertrend line will be red.
Visualization:
Uptrend: The Supertrend line will be plotted in green.
Downtrend: The Supertrend line will be plotted in red.
Example:
If the price is above the Supertrend, the market is considered to be in an uptrend, and if the price is below the Supertrend, the market is in a downtrend.
4. Momentum (Rate of Change):
Purpose: Measures the rate at which the price changes over a set period, showing if the momentum is positive or negative.
How it Works:
The Rate of Change (ROC) measures how much the price has changed over a certain number of periods (e.g., 14).
Positive ROC indicates upward momentum, and negative ROC indicates downward momentum.
Visualization:
Positive ROC: A purple line is plotted above the zero line.
Negative ROC: A purple line is plotted below the zero line.
Example:
If the ROC line is above zero, it means the price is increasing, suggesting bullish momentum. If the ROC is below zero, it indicates bearish momentum.
5. Volume:
Purpose: Displays the volume of traded assets, giving insight into the strength of price movements.
How it Works:
The script will color the volume bars based on whether the price closed higher or lower than the previous bar.
Green bars indicate bullish volume (closing price higher than the previous bar), and red bars indicate bearish volume (closing price lower than the previous bar).
Visualization:
Bullish Volume: Green volume bars when the price closes higher.
Bearish Volume: Red volume bars when the price closes lower.
Example:
If you see a green volume bar, it suggests that the market is participating in an uptrend, and the price has closed higher than the previous period. Red bars indicate a downtrend or selling pressure.
6. MACD (Moving Average Convergence Divergence):
Purpose: The MACD is a trend-following momentum indicator that shows the relationship between two moving averages of the price.
How it Works:
The MACD Line is the difference between the 12-period EMA (Exponential Moving Average) and the 26-period EMA.
The Signal Line is the 9-period EMA of the MACD Line.
The MACD Histogram shows the difference between the MACD line and the Signal line.
Visualization:
MACD Line: A blue line representing the difference between the 12-period and 26-period EMAs.
Signal Line: An orange line representing the 9-period EMA of the MACD line.
MACD Histogram: A red or green histogram that shows the difference between the MACD line and the Signal line.
Example:
When the MACD line crosses above the Signal line, it’s considered a bullish signal. When the MACD line crosses below the Signal line, it’s considered a bearish signal.
Full Chart Example:
Imagine you're looking at a price chart with all the indicators:
Pivot High/Low Lines are drawn as red and green horizontal lines.
20-day and 50-day SMAs are plotted as blue and orange lines, respectively.
Supertrend shows a green or red line indicating the trend.
Momentum (ROC) is shown as a purple line oscillating around zero.
Volume bars are green or red based on whether the close is higher or lower.
MACD appears as a blue line and orange line, with a red or green histogram showing the MACD vs. Signal line difference.
How the Indicators Work Together:
Trend Confirmation: If the price is above the Supertrend line and both SMAs are trending up, it indicates a strong bullish trend.
Momentum: If the ROC is positive and the MACD line is above the Signal line, it further confirms bullish momentum.
Volume: Increasing volume, especially with green bars, suggests that the trend is being supported by active participation.
By using these combined indicators, you can get a comprehensive view of the market's trend, momentum, and potential reversal points (via pivot highs and lows).

Entropy-Based Adaptive SuperTrendOverview:
Introducing the Entropy-Based Adaptive SuperTrend – a groundbreaking trading indicator designed to adapt dynamically to market conditions using market entropy. This enhanced SuperTrend indicator adjusts its sensitivity according to the level of chaos (or order) in price movements, providing more stable signals during volatile periods and more responsive signals when the market becomes orderly.
Key Features:
Entropy-Adaptive Mechanism: By incorporating an entropy measure, this indicator estimates the degree of unpredictability in the market. During high entropy periods (more chaotic), signals are made less sensitive, while during low entropy periods, the indicator reacts more quickly to price changes.
Adaptive ATR Multiplier: Unlike traditional SuperTrend indicators that use a fixed ATR multiplier, this version calculates a dynamic ATR multiplier based on the entropy score, ensuring more flexibility and adaptability in setting stop levels.
Visual Clarity: The indicator is overlayed on the price chart with customizable visual elements. The bullish and bearish trends are color-coded for ease of use, and optional entry signals ("L" for long and "S" for short) are plotted to clearly mark potential entry opportunities.
Alerts for Key Opportunities : Never miss an opportunity with built-in alerts for buy and sell signals. Traders can easily configure these alerts to be notified instantly when market conditions trigger a new trend.
How It Works:
Entropy Calculation: The entropy of the price data is calculated over a user-defined period, giving an indication of the degree of randomness in the price movements. The result is then smoothed to reduce noise and create a meaningful trend indication.
Dynamic ATR Adjustment: The ATR (Average True Range) multiplier, which controls the distance of the trailing stop, is adjusted based on the entropy score. This allows the SuperTrend line to widen in chaotic times, reducing false signals, while tightening in orderly times, allowing quicker trend captures.
Parameters Explained:
Entropy Settings: Control the sensitivity of entropy calculations, including the look-back period, number of bins for price distribution, and smoothing length.
Adaptive Settings: Adjust how the indicator adapts to different levels of entropy, including the adaptation period and the filtering weight.
SuperTrend Settings : Customize the ATR period and the dynamic multiplier range to fine-tune the trailing stops for your trading style.
Visual Settings: Choose your preferred colors for bullish and bearish trends, and decide if you want the entry labels displayed directly on the chart.
Use Cases:
Swing Traders can utilize the indicator to capture trend reversals while filtering out the noise during high entropy periods.
Intraday Traders can adapt the settings for shorter time frames to benefit from dynamic adjustments that reduce overtrading and false signals.
Risk Management: The entropy-based adaptive feature provides an edge in risk management by reducing sensitivity during times of increased chaos, thus helping to limit unnecessary trades.
How to Use It:
Look for entry labels ("L" for long, "S" for short) to identify potential opportunities.
Use the color-coded trendlines to determine market bias: greenish hue for bullish trends, reddish hue for bearish trends.
Customize the input settings to align with your preferred market timeframe and risk profile.
Alerts & Notifications:
Built-in alerts notify you of significant trend changes. Simply enable these alerts to receive updates when a new long or short opportunity is detected, helping you stay ahead without needing to watch the screen constantly.
Customization Tips:
Longer Timeframes : Increase the Entropy Period to better capture macro trends in high timeframe charts.
Higher Volatility Markets: Increase the ATR Max Multiplier to ensure stops are set farther away during high entropy.
Lower Volatility Markets: Use a lower ATR Base Multiplier and tighter entropy thresholds to capture rapid price movements.
Final Thoughts:
The Entropy-Based Adaptive SuperTrend indicator merges traditional trend-following logic with an adaptive mechanism driven by market entropy, aiming to address the challenges of whipsaws and false signals common in conventional SuperTrend setups. This indicator offers an intelligent and flexible way to track market trends, suitable for both beginners and experienced trade

Supertrend with EMASupertrend + EMA Indicator
This custom indicator combines the popular Supertrend and Exponential Moving Average (EMA) indicators to enhance trend analysis and signal accuracy. The Supertrend tracks price volatility to identify potential trend directions, while the EMA provides a smooth moving average to help refine entries and exits based on trend momentum.
Features:
Supertrend: Detects trend reversals by using price action and volatility, making it effective in trending markets.
Exponential Moving Average (EMA): Smoothens price fluctuations, helping you gauge the trend’s strength and filter out false signals.
Versatile for multiple timeframes and asset classes.
Ideal for traders looking to catch sustained trends and avoid false breakouts, this indicator offers an improved way to follow market momentum and confirm trend strength. Customize the Supertrend ATR multiplier and EMA length to suit your trading style and timeframe.
Multi Fibonacci Supertrend with Signals【FIbonacciFlux】Multi Fibonacci Supertrend with Signals (MFSS)
Overview
The Multi Fibonacci Supertrend with Signals (MFSS) is an advanced technical analysis tool that combines multiple Supertrend indicators using Fibonacci ratios to identify trend directions and potential trading opportunities.
Key Features
1. Fibonacci-Based Supertrend Levels
* Factor 1 (Weak) : 0.618 - The golden ratio
* Factor 2 (Medium) : 1.618 - The Fibonacci ratio
* Factor 3 (Strong) : 2.618 - The extension ratio
2. Visual Components
* Multi-layered Trend Lines
* Different line weights for easy identification
* Progressive transparency from Factor 1 to Factor 3
* Color-coded trend directions (Green for bullish, Red for bearish)
* Dynamic Fill Areas
* Gradient fills between price and trend lines
* Visual representation of trend strength
* Automatic color adjustment based on trend direction
* Signal Indicators
* Clear BUY/SELL labels on chart
* Position-adaptive signal placement
* High-visibility color scheme
3. Signal Generation Logic
The system generates signals based on two key conditions:
* Primary Condition :
* BUY : Price crossunder Supertrend2 (Factor 1.618)
* SELL : Price crossover Supertrend2 (Factor 1.618)
* Confirmation Filter :
* Signals only trigger when Supertrend3 confirms the trend direction
* Reduces false signals in volatile markets
Technical Details
Input Parameters
* ATR Period : 10 (default)
* Customizable for different market conditions
* Affects sensitivity of all Supertrend levels
* Factor Settings :
* All factors are customizable
* Default values based on Fibonacci sequence
* Minimum value: 0.01
* Step size: 0.01
Alert System
* Built-in alert conditions
* Customizable alert messages
* Real-time notification support
Use Cases
* Trend Trading
* Identify strong trend directions
* Filter out weak signals
* Confirm trend continuations
* Risk Management
* Multiple trend levels for stop-loss placement
* Clear entry and exit signals
* Trend strength visualization
* Market Analysis
* Multi-timeframe analysis capability
* Trend strength assessment
* Market structure identification
Benefits
* Reliability
* Based on proven Supertrend algorithm
* Enhanced with Fibonacci mathematics
* Multiple confirmation levels
* Clarity
* Clear visual signals
* Easy-to-interpret interface
* Reduced noise in signal generation
* Flexibility
* Customizable parameters
* Adaptable to different markets
* Suitable for various trading styles
Performance Considerations
* Optimized code structure
* Efficient calculation methods
* Minimal resource usage
Installation and Usage
Setup
* Add indicator to chart
* Adjust parameters if needed
* Enable alerts as required
Best Practices
* Use with other confirmation tools
* Adjust factors based on market volatility
* Consider timeframe appropriateness
Backtesting Results and Strategy Performance
This indicator is specifically designed for pullback trading with optimized risk-reward ratios in trend-following strategies. Below are the detailed backtesting results from our proprietary strategy implementation:
BTCUSDT Performance (Binance)
* Test Period: Approximately 7 years
* Risk-Reward Ratio: 2:1
* Take Profit: 8%
* Stop Loss: 4%
Key Metrics (BTCUSDT):
* Net Profit: +2,579%
* Total Trades: 551
* Win Rate: 44.8%
* Profit Factor: 1.278
* Maximum Drawdown: 42.86%
ETHUSD Performance (Binance)
* Risk-Reward Ratio: 4.33:1
* Take Profit: 13%
* Stop Loss: 3%
Key Metrics (ETHUSD):
* Net Profit: +8,563%
* Total Trades: 581
* Win Rate: 32%
* Profit Factor: 1.32
* Maximum Drawdown: 55%
Strategy Highlights:
* Optimized for pullback trading in strong trends
* Focus on high risk-reward ratios
* Proven effectiveness in major cryptocurrency pairs
* Consistent performance across different market conditions
* Robust profit factor despite moderate win rates
Note: These results are from our proprietary strategy implementation and should be used as reference only. Individual results may vary based on market conditions and implementation.
Important Considerations:
* The strategy demonstrates strong profitability despite lower win rates, emphasizing the importance of proper risk-reward ratios
* Higher drawdowns are compensated by significant overall returns
* The system shows adaptability across different cryptocurrencies with consistent profit factors
* Results suggest optimal performance in volatile crypto markets
Real Trading Examples
BTCUSDT 4-Hour Chart Analysis
Example of pullback strategy implementation on Bitcoin, showing clear trend definition and entry points
ETHUSDT 4-Hour Chart Analysis
Ethereum chart demonstrating effective signal generation during strong trends
BTCUSDT Detailed Signal Example (15-Minute Scalping)
Close-up view of signal generation and trend confirmation process on 15-minute timeframe, demonstrating the indicator's effectiveness for scalping operations
Chart Analysis Notes:
* Green and red zones clearly indicate trend direction
* Multiple timeframe confirmation visible through different Supertrend levels
* Clear entry signals during pullbacks in established trends
* Precise stop-loss placement opportunities below support levels
Implementation Guidelines:
* Wait for main trend confirmation from Factor 3 (2.618)
* Enter trades on pullbacks to Factor 2 (1.618)
* Use Factor 1 (0.618) for fine-tuning entry points
* Place stops below the relevant Supertrend level
Footnotes:
* Charts provided are from Binance exchange, using both 4-hour and 15-minute timeframes
* Trading view screenshots captured during actual market conditions
* Indicators shown: Multi Fibonacci Supertrend with all three factors
* Time period: Recent market activity showing various market conditions
Important Notice:
These charts are for educational purposes only. Past performance does not guarantee future results. Always conduct your own analysis and risk management.
Disclaimer
This indicator is for informational purposes only. Past performance is not indicative of future results. Always conduct proper risk management and due diligence.
License
Open source under MIT License
Author's Note
Contributions and suggestions for improvement are welcome. Please feel free to fork and enhance.

Dynamic Score Supertrend [QuantAlgo]Dynamic Score Supertrend 📈🚀
The Dynamic Score Supertrend by QuantAlgo introduces a sophisticated trend-following tool that combines the well-known Supertrend indicator with an innovative dynamic trend scoring technique . By tracking market momentum through a scoring system that evaluates price behavior over a customizable window, this indicator adapts to changing market conditions. The result is a clearer, more adaptive tool that helps traders and investors detect and capitalize on trend shifts with greater precision.
💫 Conceptual Foundation and Innovation
At the core of the Dynamic Score Supertrend is the dynamic trend score system , which measures price movements relative to the Supertrend’s upper and lower bands. This scoring technique adds a layer of trend validation, assessing the strength of price trends over time. Unlike traditional Supertrend indicators that rely solely on ATR calculations, this system incorporates a scoring mechanism that provides more insight into trend direction, allowing traders and investors to navigate both trending and choppy markets with greater confidence.
✨ Technical Composition and Calculation
The Dynamic Score Supertrend utilizes the Average True Range (ATR) to calculate the upper and lower Supertrend bands. The dynamic trend scoring technique then compares the price to these bands over a customizable window, generating a trend score that reflects the current market direction.
When the score exceeds the uptrend or downtrend thresholds, it signals a possible shift in market direction. By adjusting the ATR settings and window length, the indicator becomes more adaptable to different market conditions, from steady trends to periods of higher volatility. This customization allows users to refine the Supertrend’s sensitivity and responsiveness based on their trading or investing style.
📈 Features and Practical Applications
Customizable ATR Settings: Adjust the ATR length and multiplier to control the sensitivity of the Supertrend bands. This allows the indicator to smooth out noise or react more quickly to price shifts, depending on market conditions.
Window Length for Dynamic Scoring: Modify the window length to adjust how many data points the scoring system considers, allowing you to tailor the indicator’s responsiveness to short-term or long-term trends.
Uptrend/Downtrend Thresholds: Set thresholds for identifying trend signals. Increase these thresholds for more reliable signals in choppy markets, or lower them for more aggressive entry points in trending markets.
Bar and Background Coloring: Visual cues such as bar coloring and background fills highlight the direction of the current trend, making it easier to spot potential reversals and trend shifts.
Trend Confirmation: The dynamic trend score system provides a clearer confirmation of trend strength, helping you identify strong, sustained movements while filtering out false signals.
⚡️ How to Use
✅ Add the Indicator: Add the Dynamic Score Supertrend to your favourites, then apply it to your chart. Adjust the ATR length, multiplier, and dynamic score settings to suit your trading or investing strategy.
👀 Monitor Trend Shifts: Track price movements relative to the Supertrend bands and use the dynamic trend score to confirm the strength of a trend. Bar and background colors make it easy to visualize key trend shifts.
🔔 Set Alerts: Configure alerts when the dynamic trend score crosses key thresholds, so you can act on significant trend changes without constantly monitoring the charts.
🌟 Summary and Usage Tips
The Dynamic Score Supertrend by QuantAlgo is a robust trend-following tool that combines the power of the Supertrend with an advanced dynamic scoring system. This approach provides more adaptable and reliable trend signals, helping traders and investors make informed decisions in trending markets. The customizable ATR settings and scoring thresholds make it versatile across various market conditions, allowing you to fine-tune the indicator for both short-term momentum and long-term trend following. To maximize its effectiveness, adjust the settings based on current market volatility and use the visual cues to confirm trend shifts. The Dynamic Score Supertrend offers a refined, probabilistic approach to trading and investing, making it a valuable addition to your toolkit.

Options Series - Supertrend, HalfTrend, Ichimoku Cloud and P_SAR➤ Supertrend:
➤ HalfTrend:
➤ Ichimoku Cloud:
➤ Parabolic SAR:
⭐ Overview and How It Works:
This script combines multiple popular technical indicators—Supertrend, HalfTrend, Ichimoku Cloud, and Parabolic SAR—into a single, cohesive tool for analyzing price trends and reversals. Designed for traders who prefer multi-layered confirmation, it displays non-overlay signals in a candlestick format, helping users make sense of intricate market dynamics. It also includes a "Master Candle" condition, which aggregates the signals from all indicators, providing a powerful snapshot of market sentiment.
References for study,
Supertrend and HalfTrend and Ichimoku Cloud and Parabolic SAR
⭐ Key Features and Functionality:
The script integrates four indicators and visually represents them in a non-overlay fashion, meaning that each indicator's signal appears on separate candlestick layers. It uses color coding to differentiate between bullish and bearish signals. The Master Candle is a unique feature that aggregates the signals from all indicators to show the overall sentiment.
Supertrend: It uses ATR and a multiplier factor to create a trailing stop, identifying bullish and bearish trends.
HalfTrend: It analyzes market volatility that provides buy and sell signals based on volatility channels and historical highs and lows.
Ichimoku Cloud: It leverages historical highs and lows to form the conversion and baseline, which are compared to assess market strength.
Parabolic SAR: A stop-and-reverse system that highlights potential reversals. It is based on time and price, offering traders potential reversal points.
Master Candle: It computes a score based on the confluence of all four indicators, adding another layer of confirmation.
🎨 Visualizations and User Experience:
The script's user interface is highly visual, with color-coded candlesticks plotted across multiple layers. Each indicator has its own color coding for bullish and bearish signals, ensuring clarity:
➤ Green for bullish signals.
➤ Red for bearish signals.
➤ Each candlestick layer represents a different indicator (e.g., Supertrend, HalfTrend, etc.), making it easy for the trader to isolate and interpret signals.
➤ The "Master Candle" provides an overarching view of the market by displaying a consolidated signal, which can reduce confusion from mixed indicator signals.
⭐ Settings and Customization:
The script is highly customizable, allowing users to adjust the settings for each indicator. Key customizable parameters include:
• Supertrend ATR Period and Factor
• HalfTrend Amplitude and Channel Deviation
• Ichimoku Conversion, Base, and Lagging Span Periods
• Parabolic SAR Start, Increment, and Maximum value
Additionally, users can toggle the visibility of each indicator and customize the look of the plot to suit their preferences.
⭐ Uniqueness of the Concept:
No repaints. This is the advanced representation and the combination of multiple indicators into a single script, along with a powerful "Master Candle" that aggregates them, makes this tool unique. Most scripts provide isolated indicator signals, while this one brings together four powerful indicators and visually simplifies the analysis. The non-overlay style and color-coded candlesticks offer traders an easy-to-understand, actionable visual cue, which stands out from traditional indicator overlays.
🚀 Conclusion:
This script is a comprehensive, multi-indicator trading tool suitable for traders looking for reliable trend-following and reversal detection. Its ability to provide an aggregated "Master Candle" signal reduces noise and aids in better decision-making. Customization options allow users to tailor it to their trading style, while its clear visualizations provide an excellent user experience.

Multi-timeframe 24 moving averages + BB+SAR+Supertrend+VWAP █ OVERVIEW
The script allows to display up to 24 moving averages ("MA"'s) across 5 timeframes plus two bands (Bollinger Bands or Supertrend or Parabolic SAR or VWAP bands) each from its own timeframe.
The main difference of this script from many similar ones is the flexibility of its settings:
- Bulk enable/disable and/or change properties of several MAs at once.
- Save 3 of your frequently used templates as presets using CSV text configurations.
█ HOW TO USE
Some use examples:
In order to "show 31, 50, 200 EMAs and 20, 100, 200 SMAs for each of 1H, 4H, D, W, M timeframes using blue for short MA, yellow for mid MA and red for long MA" use the settings as shown on a screenshot below.
In order to "Show a band of chart timeframe MA's of lengths 5, 8, 13, 21, 34, 55, 100 and 200 plus some 1H, 4H, D and W MAs. Be able to quickly switch off the band of chart tf's MAs. For chart timeframe MA's only show labels for 21, 100 and 200 EMAs". You can set TF1 and TF2 to chart's TF and set you fib MAs there and configure fixed higher timeframe MAs using TF3, TF4 and TF5 (e.g. using 1H, D and W timeframes and using 1H 800 in place of 4H 200 MA). However, quicker way may be using CSV - the syntax is very simple and intuitive, see Preset 2 as it comes in the script. You can easily switch chart tf's band of MAs by toggling on/off your chart timeframe TF's (in our example, TF1 and TF2).
The settings are either obvious or explained in tooltips.
Note 1: When using group settings and CSV presets do not forget that individual setting affected will no have any effect. So, if some setting does not work, check whether it is overridden with some group setting or a CSV preset.
Note 2: Sometimes you can notice parts of MA's hanging in the air, not lasting up to the last bar. This is not a bug as explained on this screenshot:
█ FOR DEVELOPERS
The script is a use case of my CSVParser library, which in turn uses Autotable library, both of which I hope will be quite helpful. Autotable is so powerful and comprehensive that you will hardly ever wish to use normal table functions again for complex tables.
The indicator was inspired by Pablo Limonetti's url=https://www.tradingview.com/script/nFs56VUZ/]Multi Timeframe Moving Averages and Raging @RagingRocketBull's # Multi SMA EMA WMA HMA BB (5x8 MAs Bollinger Bands) MAX MTF - RRB
