ZigZag Multi Time Frame with Fibonacci RetracementHello Traders,
This is ZigZag Multi Time Frame with Fibonacci Retracement script. It calculates the ZigZag using Higher Time Frame, draw Fibonacci Retracement lines and put labels accordingly. I already published Zigzag with Fibonacci Levels script but this one is Multi Time Frame and I didn't want to change/update it.
You can set ZigZag Period and Resolution as you wish. Zigzag is calculated using higher time frames (ex: 1day) so you better choose small numbers as Zigzag Period, such 2, 3 etc. you should choose higher time frame wisely, meaning that you should not set 1Day while chart resolution is 1min ;)
It draws Fibonacci levels between 0%-100% and If the price goes higher/lower than 100% level than the script draws Fibonacci Levels accordingly. This means it draws Fibonacci levels until this levels get higher/lower than the price.
"Show Zig Zag" is not enabled by default, you can enable it if you want to see ZigZag as well.
You have options to set Text Color, Line Color, Zigzag Up Color and Zigzag Down Color.
You can set the location of the Fibonnaci Levels -> Left or Right
You also have option to enable/disable following Fibonnaci Levels:
---> 0.236
---> 0.382
---> 0.500
---> 0.618
---> 0.786
I added "Colorful Fibonacci Levels" for fun. if you enable it then Fibonacci line colors will be different randomly on each move, see it for yourself :)
Some Screenshots:
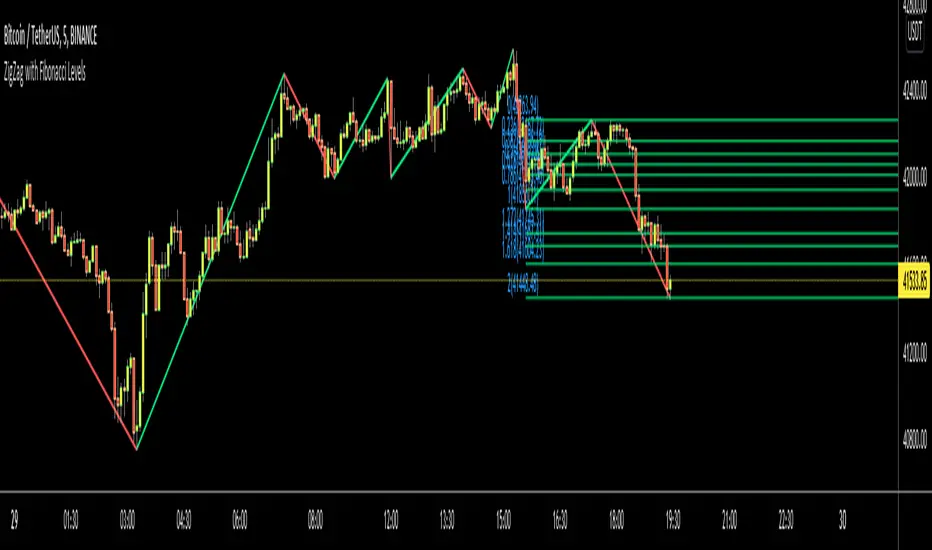
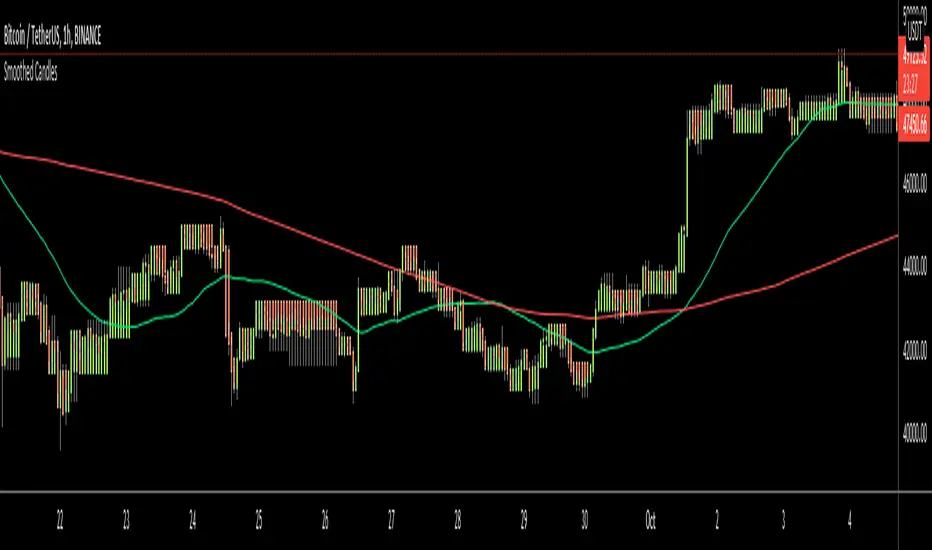
if you enable "Show Zigzag Option":
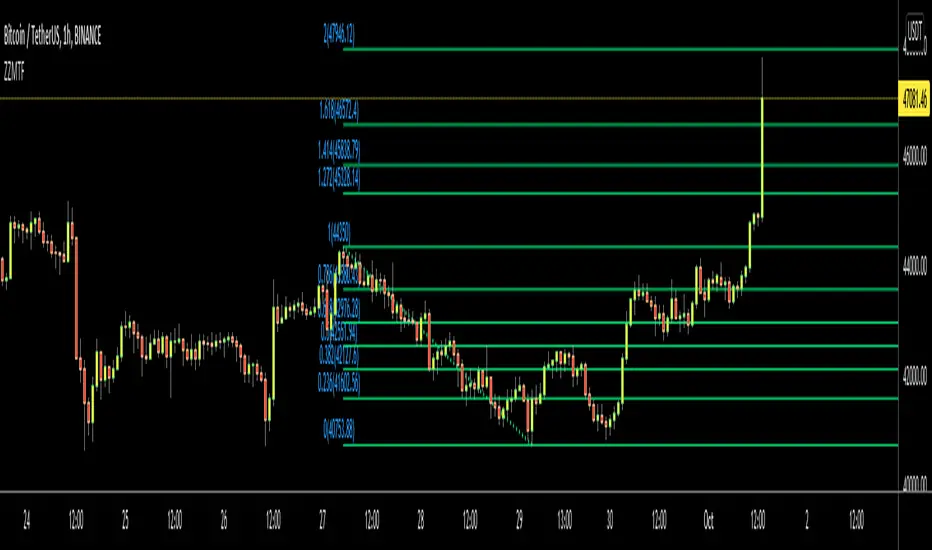
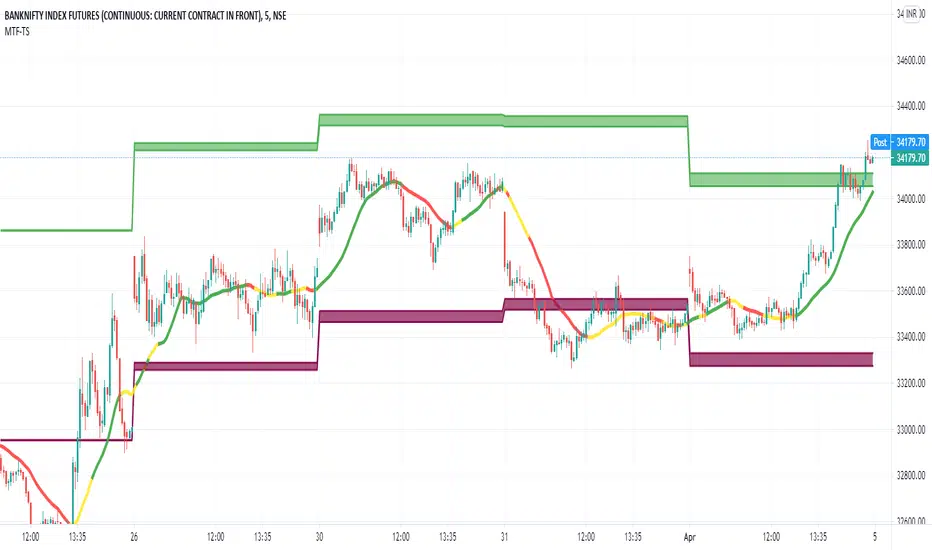
how the script adjust levels automatically:
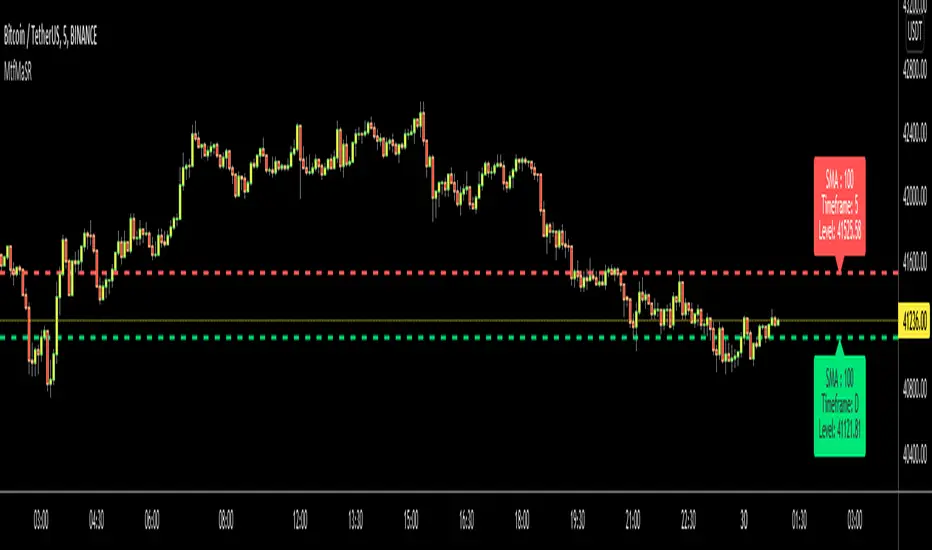
if you set Label Location as "Right":
if you enable "Colorful Fibonacci Levels" then Line colors will be changed on each move randomly ;)
Enjoy!
Pine Script®指标