NSDT NQ Asia Open TargetsThis indicator provides potential entries and targets (both long and short) for the NQ/MNQ Asian session. It creates potential target lines on the chart as well as a gray box with the potential levels in text format. Both options can be turned on or off at the discretion of the trader. You may need to adjust the chart width so the box shows on the screen. It's position is adjustable.
The lines and the text box are updated after the first 1 MINUTE bar closes for Asian session. The Asian session open is defined as 6:00PM - 6:01PM, Eastern time.
Place the chart on a 1 MIN time interval for best results. You can change the chart timeframe after the 1st min bar closes and the data is updated.
To get access to this indicator, use the link in the profile signature or private message us here in Tradingview.
Targets

Bhoomi AbsoluteThis is a custom indicator which helps with current trend analysis of lower and higher timeframes and also to know the daily levels of the script.
Crafted for Intraday and Positional users, making their entry, stop loss and targets more precise.

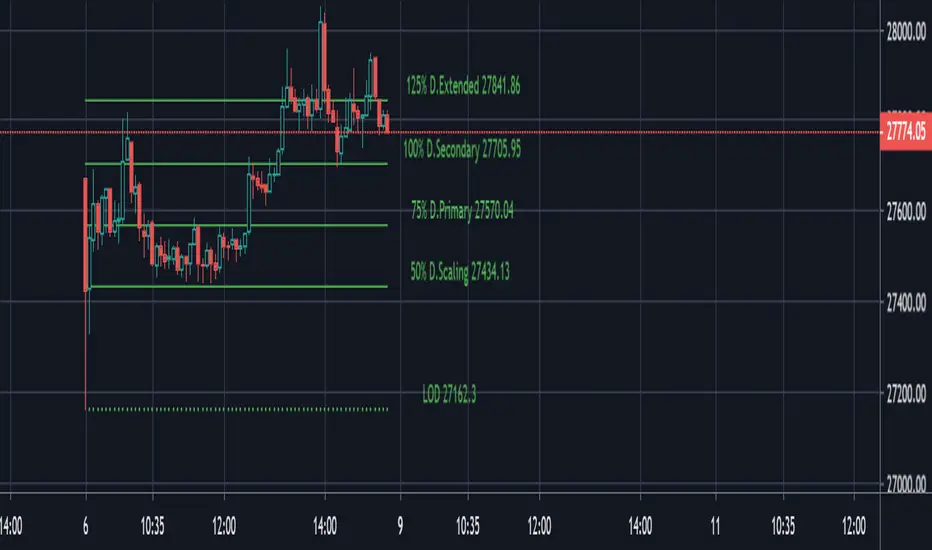
PivotBoss ADR Price TargetsThis script forcasts daily, weekly, Monthly targets well in advance so that you can position yourself accordingly. Script has four target levels such as 50% target level, 75% target level, 100% target level and 125% target level. You can scale out your position across these levels. Price has 80% potential to reach 1st target level, 70% potential to reach 2nd second target level and 50% potential to reach 3rd and 4th target level.
The script takes 10 period average daily range and high of the period to project the downside targets, 10 period ADR and low of the peiod to project upsdie target levels.
When the price is trades in the narrow range in the prior period then the potehtial to reach 125% target level increase by 90%.
This script is purely price based use it with other pivotBoss pivots and volume profile for confirmation of your bias
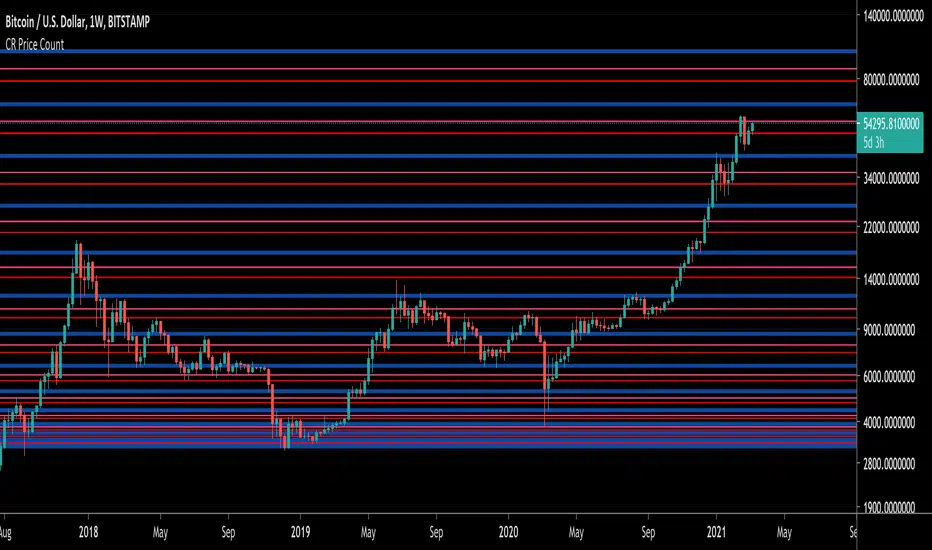
CR Price CountThis indicator calculates previous and upcoming S/R levels to predict potential targets and pivot points.
SFL ATR BandsMany traders use ATR as a way to determine stop loss placement. It usually works like this:
- Stop loss for a short trade = high of last candle + ATR value
- Stop loss for a long trade = low of last candle – ATR value
This is an indicator that allows you to do just that: it gives you an easy way to view current and historical volatility using ATR-based price bands .
Features
The indicator is configurable with the following settings:
ATR period
ATR multiplier
ATR applied to highs/lows OR the close price
Bands offset
Only show for the last X candles
How To Use This Indicator
Since this indicator shows average volatility bands, it is a good measure of how much the price moves. So we can use ATR bands in a number of ways:
it’s an easy way to see where you can place your stop loss
you can use a multiple of ATR as your trade target
you can trail your stops alongside the ATR bands

camarilla - Daily,Weekly,Monthly by Ganeshcamarilla - Daily,Weekly,Monthly levels in one chart for support and resitance

Wick Fill Targets - JDThis is a small, but usefull, script that gives you targets and possible risk/reward according to the last significant highs and lows.
When a high or low is "tapped" and price turns back away it typically tends to return to these levels before bouncing back or "taking a break" and then continuing.
The risk/rewards percentages kan be adjusted for leverage, the leverage can be adjusted in the settings.
The script shows a short term and long term "high" and "low" level, the lookback period can be adjusted in the settings.
I tried to make it as "uninvasive" as possible and it's very handy to have on your chart to quickly turn on off I you need it.
I hope you like it, enjoy!
JD.
#NotTradingAdvice
#DYOR

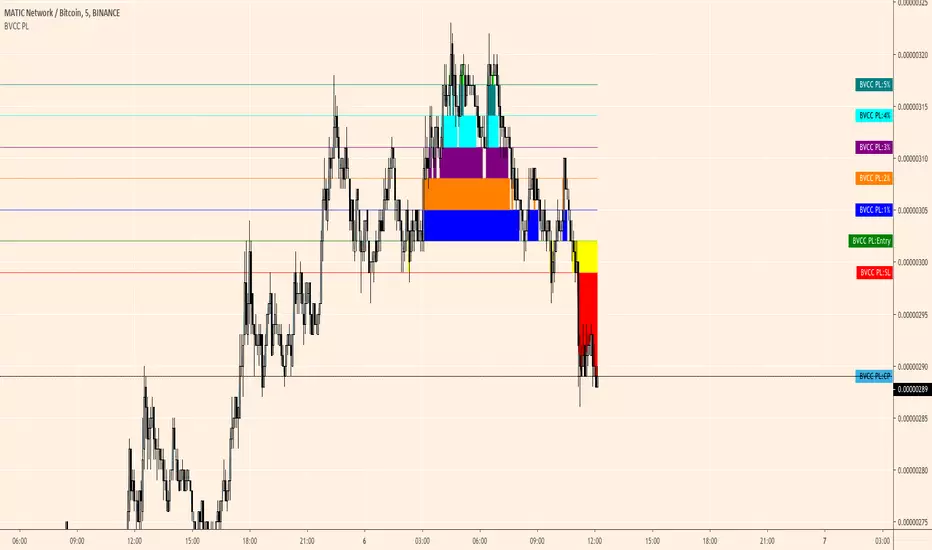
Target Painter [BVCC]Another addition to the "HUD series'. This is not an indicator in the sense that it is attempting to provide OHLCV data in some new way. Instead, this is a tool designed to help you quickly place visual references on your chart of a current position. It is easy enough to paint an entry, Target, and SL with the long position tool on TV, but if you have multiple targets it can be a pain to work with 2 or 3 of these and especially if you are trying to work quickly or just want a minimalistic way to see your references of entry, targets, and SL, this can help.
simply input your entry and up to 3 targets along with a stop loss and it will plot them for you and then you can set alarms on the indicator itself to alert you to price changes.
entry and all targets can be input in sats and if you enable 'auto sat calculation' then you can just enter in a whole number and it will do the math for you. so, .000374 sats can be entered as 374 - Yes, it can differentiate between .000374 and .00000374. no matter what the actual decimal place needed, you only need to enter the whole number.
Enter Stop Loss as a whole number percent. So, if you want a 10% SL on the order, just put '10' in the Stop Loss input box. As with the other recent indicators in this series, this is a quick and dirty prototype allowing me to deploy it in the real world to see how it works and what improvements could be made.
please comment here or come talk to me in my telegram channel for more ideas, suggestions and improvement ideas or indicator ideas of your own you would like to see!

Percent Ladder Scalp Helper [BVCC]This is a simple proof of concept model for a tool that allows you to overlay a percent reference anchored on a specific price point. It projects a ladder of horizontal lines at percent levels 1%, 2%, 3%, 4%, and 5%. It will then begin filling in target zones when price closes above these targets. Above 5% all fills will be lime green, below entry, fill will be yellow as a warning and below SL, red to remind you GTFO of the trade.
this tool is intended for use in quick trade setups where the trader is looking to scalp for small percentages and will help save time in determining % based targets. The colored alarms are a bit fancy but simply serve as a graphical feedback system that can perhaps be developed into something more useful in the future.
User may input entry price and preferred SL in the format dialogue.
If 'auto calculate sat value' is checked, then the user can enter whole numbers for their entry. For instance if your entry is at .00000585 sats, you can just enter 585. If you are working with something besides btc or prefer to enter full sat input, simply uncheck this option.
Amazing Crossover System - 100+ pips per day!I got the main concept for this system on another site. While I have made one important change, I must stress that the heart of this system was created by someone else! We must give credit where credit is due!
Y'all know baby pips. @ForexPhantom published about this system and did both back and forward test around 10 years ago.
I found it on the sit and now I put it to code to see how it performs. I assume 10 points spread for every trade. I use Renesource or AxiTrader to get the low spreads.
There are 2 mods, the single trades and constant trading on the direction.
Main concept
Indicators
5 EMA -- YELLOW
10 EMA -- RED
RSI (10 - Apply to Median Price: HL/2) -- One level at 50.
TIME FRAME
1 Hour Only (very important!)
PAIRS
Virtually any pair seems to work as this is strictly technical analysis.
I recommend sticking to the main currencies and avoiding cross currencies (just his preference).
WHEN TO ENTER A TRADE
Enter LONG when the Yellow EMA crosses the Red EMA from underneath.
RSI must be approaching 50 from the BOTTOM and cross 50 to warrant entry.
Enter SHORT when the Yellow EMA crosses the Red EMA from the top.
RSI must be approaching 50 from the TOP and cross 50 to warrant entry.
I've attached a picture which demonstrates all these conditions.
That's it!
f.bpcdn.co

SignalToSignal.com - Logical Trade LevelsOur Logical Trade Levels (Targets and Stall Points) indicator is a simple but powerful version of support and resistance. We do a fair bit a behind the scenes algorithmic magic but essentially these levels act as very strong support and resistance for entries and also targets. Many of our previously published ideas use these levels to determine likely stall points for our entries as well as best targets up and down. You can see from those published levels how easily you know where price will likely stall out or needs to move through.
While these levels work great for simple support and resistance style break out trading, they work even better when used in combination with our other systems. When using Logical Trade Levels with our other indicators you have a complete solution for not only entering trades correctly (using our Volume Analysis Trading System) but also exiting and avoiding trades at what are the best and worst areas based on the Logical Trade Levels.
To gain access to the Logical Volume Trading System, please visit our website .
If you have any questions, please contact us through the Contact link on our website - signaltosignal.com

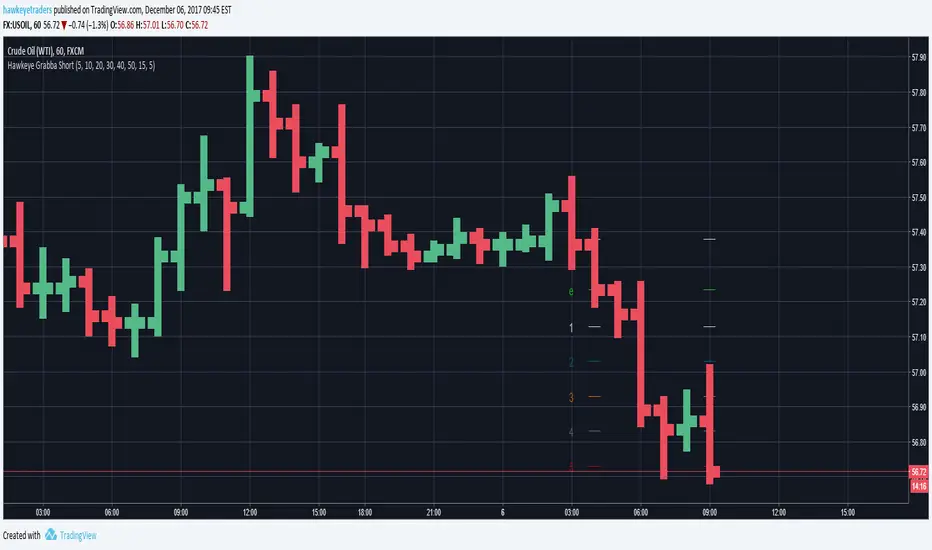
Hawkeye Grabba ShortGrab pips with Hawkeye Grabba
Grabba is a simple mechanical system that you can manage yourself, using your own risk and reward profile.
The Hawkeye Grabba is a risk management tool which provides traders with a visual representation of the risk-to-reward profile on every trade.
For example, you can apply your own profit targets (say 10 pips) and each line will show you that multiple.
As with all the Hawkeye Indicators, Grabba can be applied to any timeframe and any chart and can be custom set to be used on any market, i.e. Forex, stock indices, commodities, etc.
Mayer Multiple v2.0 - Klahr ThresholdThis is a simple update to the Mayer Multiple script by Unbound , which charts an indicator created by Trace Mayer and popularized by Preston Pysh.
The original post identified any price below 2.4x the 100-day MA as the BTC buy threshold. While the logic there is historically sound, it does not account for the fact that the BTC trend is parabolic in nature. With that in mind, I've attempted to update the 2.4x multiple to react based on the moving average of the Mayer Multiple itself. To do so, I simply found the number that, when added to the MM moving average, historically hit the 2.4x multiple during periods of low volatility. This turns out to be 1.17.
The green line represents the Klahr Threshold (is it obnoxious if I call it that? I've always wanted an indicator named after me). As you can see from the above chart, it hovers around 2.4x in late 2012 to early 2013, rises above it until mid 2014, and then stays below until 2016. It then stays almost exactly at 2.4x until April 2017, when it rises significantly above it for the first time since July 2014. The convergence in late 2012 and 2016-2017 is what leads me to believe that this should be the basis for the updated threshold.
It's entirely possible that there's a more robust method of calculating a reactive threshold (or a different number that should be added to the multiple's MA), but I think this is a good first step in refining the multiple to withstand the test of time.
