Example - HTF Values Without 'Security()'This is an example of how to reference higher timeframe data without the
need for a 'security()' call.
I have attempted to create the function example:
f_insecurity()
with the purpose of wrapping up and pumping out all common relevent HTF
price data that's needed for your everyday indicators in a reliable fashion.
时间

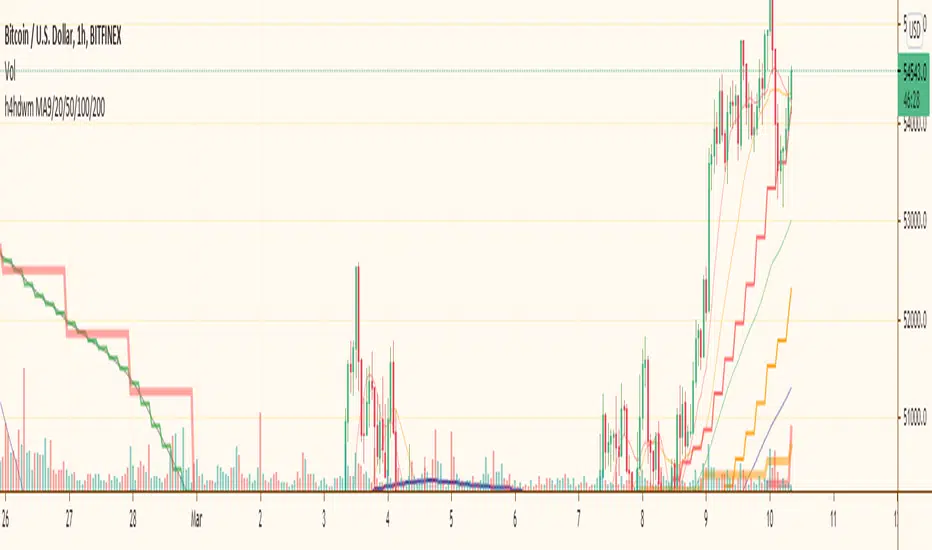
h4hdwm (updated)I put most importand moving avarages for most importand time frames together. When you whatching a graph you are sometimes missing another time frime very importand moving avarage and there is a reaction on price. with this multi time frame multi ma indicator you can see all of them at once. it makes a little mass if you let all of them together. so you might close some of them.
Bigger time frames Moving Avarages has ticker lines and bigger steps.
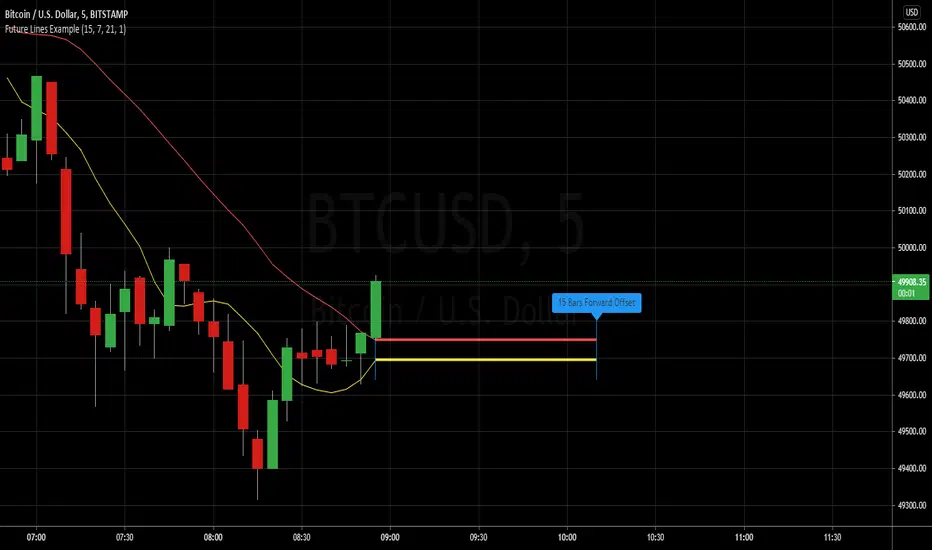
Example - Future Line DrawingExample primarily focuses on:
• creating a simple function to get a time offset value
• using the offset to set drawing locations in the future
• how to properly set up and manipulate line positions
Extras ( end of script ):
• inclusion of vertical lines for visualising start and end points using the time offsets
• inclusion of label to read out the current time offset forwards/backwards
This script publication is intended for:
• Educational Purposes
Who is it for?
• anyone who wants to learn the basics of drawing using 'time' for purposes of positioning
Realtime All-Time High and All-Time Low Tracker [WIP]This is a study intended to port the work of /u/QuantNomad's "Kozlod - All-time high/low alerts" to pine version 4 without giving any alerts. It is intended to capture the most extreme points on any given price chart in real time, the absolute high and absolute low points. Ideally, the plotted lines would strictly diverge from one another in opposite directions and widen with new highs or lows on a hypothetical "all-time" resolution.
Most of the original code was replaced and I'm trying to resolve a bug where the script fails to register new highs or lows while at the same time making sure that earlier data is plotted correctly. If applied to an asset that has not yet recovered , is just too new, or has not achieved a lower low than its opening price, this indicator ceases to function correctly. This would not be an issue if pine script was more general purpose and had something similar to Python's max(list) function.
Any and all suggestions are welcome. This is simply to serve as a springboard for any programmers trying to design algorithms or strategies that use these variables on any price chart.
Happy Hunting!
- Patch Hemlock

Relative Volume at Time█ OVERVIEW
This indicator calculates relative volume, which is the ratio of present volume over an average of past volume.
It offers two calculation modes, both using a time reference as an anchor.
█ CONCEPTS
Calculation modes
The simplest way to calculate relative volume is by using the ratio of a bar's volume over a simple moving average of the last n volume values.
This indicator uses one of two, more subtle ways to calculate both values of the relative volume ratio: current volume:past volume .
The two calculations modes are:
1 — Cumulate from Beginning of TF to Current Bar where:
current volume = the cumulative volume since the beginning of the timeframe unit, and
past volume = the mean of volume during that same relative period of time in the past n timeframe units.
2 — Point-to-Point Bars at Same Offset from Beginning of TF where:
current volume = the volume on a single chart bar, and
past volume = the mean of volume values from that same relative bar in time from the past n timeframe units.
Timeframe units
Timeframe units can be defined in three different ways:
1 — Using Auto-steps, where the timeframe unit automatically adjusts to the timeframe used on the chart:
— A 1 min timeframe unit will be used on 1sec charts,
— 1H will be used for charts at 1min and less,
— 1D will be used for other intraday chart timeframes,
— 1W will be used for 1D charts,
— 1M will be used for charts at less than 1M,
— 1Y will be used for charts at greater or equal than 1M.
2 — As a fixed timeframe that you define.
3 — By time of day (for intraday chart timeframes only), which you also define. If you use non-intraday chart timeframes in this mode, the indicator will switch to Auto-steps.
Relative Relativity
A relative volume value of 1.0 indicates that current volume is equal to the mean of past volume , but how can we determine what constitutes a high relative volume value?
The traditional way is to settle for an arbitrary threshold, with 2.0 often used to indicate that relative volume is worthy of attention.
We wanted to provide traders with a contextual method of calculating threshold values, so in addition to the conventional fixed threshold value,
this indicator includes two methods of calculating a threshold channel on past relative volume values:
1 — Using the standard deviation of relative volume over a fixed lookback.
2 — Using the highs/lows of relative volume over a variable lookback.
Channels calculated on relative volume provide meta-relativity, if you will, as they are relative values of relative volume.
█ FEATURES
Controls in the "Display" section of inputs determine what is visible in the indicator's pane. The next "Settings" section is where you configure the parameters used in the calculations. The "Column Coloring Conditions" section controls the color of the columns, which you will see in three of the five display modes available. Whether columns are plotted or not, the coloring conditions also determine when markers appear, if you have chosen to show the markers in the "Display" section. The presence of markers is what triggers the alerts configured on this indicator. Finally, the "Colors" section of inputs allows you to control the color of the indicator's visual components.
Display
Five display modes are available:
• Current Volume Columns : shows columns of current volume , with past volume displayed as an outlined column.
• Relative Volume Columns : shows relative volume as a column.
• Relative Volume Columns With Average : shows relative volume as a column, with the average of relative volume.
• Directional Relative Volume Average : shows a line calculated using the average of +/- values of relative volume.
The positive value of relative volume is used on up bars; its negative value on down bars.
• Relative Volume Average : shows the average of relative volume.
A Hull moving average is used to calculate the average used in the three last display modes.
You can also control the display of:
• The value or relative volume, when in the first three display modes. Only the last 500 values will be shown.
• Timeframe transitions, shown in the background.
• A reminder of the active timeframe unit, which appears to the right of the indicator's last bar.
• The threshold used, which can be a fixed value or a channel, as determined in the next "Settings" section of inputs.
• Up/Down markers, which appear on transitions of the color of the volume columns (determined by coloring conditions), which in turn control when alerts are triggered.
• Conditions of high volatility.
Settings
Use this section of inputs to change:
• Calculation mode : this is where you select one of this indicator's two calculation modes for current volume and past volume , as explained in the "Concepts" section.
• Past Volume Lookback in TF units : the quantity of timeframe units used in the calculation of past volume .
• Define Timeframes Units Using : the mode used to determine what one timeframe unit is. Note that when using a fixed timeframe, it must be higher than the chart's timeframe.
Also, note that time of day timeframe units only work on intraday chart timeframes.
• Threshold Mode : Five different modes can be selected:
— Fixed Value : You can define the value using the "Fixed Threshold" field below. The default value is 2.0.
— Standard Deviation Channel From Fixed Lookback : This is a channel calculated using the simple moving average of relative volume
(so not the Hull moving average used elsewhere in the indicator), plus/minus the standard deviation multiplied by a user-defined factor.
The lookback used is the value of the "Channel Lookback" field. Its default is 100.
— High/Low Channel From Beginning of TF : in this mode, the High/Low values reset at the beginning of each timeframe unit.
— High/Low Channel From Beginning of Past Volume Lookback : in this mode, the High/Low values start from the farthest point back where we are calculating past volume ,
which is determined by the combination of timeframe units and the "Past Volume Lookback in TF units" value.
— High/Low Channel From Fixed Lookback : In this mode the lookback is fixed. You can define the value using the "Channel Lookback" field. The default value is 100.
• Period of RelVol Moving Average : the period of the Hull moving average used in the "Directional Relative Volume Average" and the "Relative Volume Average".
• High Volatility is defined using fast and slow ATR periods, so this represents the volatility of price.
Volatility is considered to be high when the fast ATR value is greater than its slow value. Volatility can be used as a filter in the column coloring conditions.
Column Coloring Conditions
• Eight different conditions can be turned on or off to determine the color of the volume columns. All "ON" conditions must be met to determine a high/low state of relative volume,
or, in the case of directional relative volume, a bull/bear state.
• A volatility state can also be used to filter the conditions.
• When the coloring conditions and the filter do not allow for a high/low state to be determined, the neutral color is used.
• Transitions of the color of the volume columns determined by coloring conditions are used to plot the up/down markers, which in turn control when alerts are triggered.
Colors
• You can define your own colors for all of the oscillator's plots.
• The default colors will perform well on light or dark chart backgrounds.
Alerts
• An alert can be defined for the script. The alert will trigger whenever an up/down marker appears in the indicator's display.
The particular combination of coloring conditions and the display settings for up/down markers when you create the alert will determine which conditions trigger the alert.
After alerts are created, subsequent changes to the conditions controlling the display of markers will not affect existing alerts.
• By configuring the script's inputs in different ways before you create your alerts, you can create multiple, functionally distinct alerts from this script.
When creating multiple alerts, it is useful to include in the alert's message a reminder of the particular conditions you used for each alert.
• As is usually the case, alerts triggering "Once Per Bar Close" will prevent repainting.
Error messages
Error messages will appear at the end of the chart upon the following conditions:
• When the combination of the timeframe units used and the "Past Volume Lookback in TF units" value create a lookback that is greater than 5000 bars.
The lookback will then be recalculated to a value such that a runtime error does not occur.
• If the chart's timeframe is higher than the timeframe units. This error cannot occur when using Auto-steps to calculate timeframe units.
• If relative volume cannot be calculated, for example, when no volume data is available for the chart's symbol.
• When the threshold of relative volume is configured to be visible but the indicator's scale does not allow it to be visible (in "Current Volume Columns" display mode).
█ NOTES
For traders
The chart shown here uses the following display modes: "Current Volume Columns", "Relative Volume Columns With Average", "Directional Relative Volume Average" and "Relative Volume Average". The last one also shows the threshold channel in standard deviation mode, and the TF Unit reminder to the right, in red.
Volume, like price, is a value with a market-dependent scale. The only valid reference for volume being its past values, any improvement in the way past volume is calculated thus represents a potential opportunity to traders. Relative volume calculated as it is here can help traders extract useful information from markets in many circumstances, markets with cyclical volume such as Forex being one, obvious case. The relative nature of the values calculated by this indicator also make it a natural fit for cross-market and cross-sector analysis, or to identify behavioral changes in the different futures contracts of the same market. Relative volume can also be put to more exotic uses, such as in evaluating changes in the popularity of exchanges.
Relative volume alone has no directional bias. While higher relative volume values always indicate higher trading activity, that activity does not necessarily translate into significant price movement. In a tightly fought battle between buyers and sellers, you could theoretically have very large volume for many bars, with no change whatsoever in bid/ask prices. This of course, is unlikely to happen in reality, and so traders are justified in considering high relative volume values as indicating periods where more attention is required, because imbalances in the strength of buying/selling power during high-volume trading periods can amplify price variations, providing traders with the generally useful gift of volatility.
Be sure to give the "Directional Relative Volume Average" a try. Contrary to the always-positive ratio widely used in this indicator, the "Directional Relative Volume Average" produces a value able to determine a bullish/bearish bias for relative volume.
Note that realtime bars must be complete for the relative volume value to be confirmed. Values calculated on historical or elapsed realtime bars will not recalculate unless historical volume data changes.
Finally, as with all indicators using volume information, keep in mind that some exchanges/brokers supply different feeds for intraday and daily data, and the volume data on both feeds can sometimes vary quite a bit.
For coders
Our script was written using the PineCoders Coding Conventions for Pine .
The description was formatted using the techniques explained in the How We Write and Format Script Descriptions PineCoders publication.
Bits and pieces of code were lifted from the MTF Selection Framework and the MTF Oscillator Framework , also by PineCoders.
█ THANKS
Thanks to dgtrd for suggesting to add the channel using standard deviation.
Thanks to adolgov for helpful suggestions on calculations and visuals.
Look first. Then leap.

Gann Toolbox V2// ========================================================================//
This script is meant to help you save a lot of time plotting your Gann Boxes and Cycles correctly and accurately.
This is a recoded version of "Gann ToolBox V1.5/1.7"
This script allows you to scale your boxes and square them with a simple input in the script's settings "$ per degree".
It includes a few default cycles already built into it ( March and September ) and an advance mode that lets you place the box anywhere you want and create your own custom cycle. through any time period you want.
You get the 1:1, 1:2, 2:1 Gann fan angles at each corner of the box and some additional angles at the midpoint to give you a complete star formation.
Using the Advance mode you can also adjust the length of your custom cycle and the global height increments. Default is 360degrees.
You can also play with the offset values for your cycles.
That's not all, you also get to plot your horizontal lines between each cycle at an increment of your choosing.
Using this script you will be able to plot any cycle that you want with a few clicks & and a few seconds.
in the advance more you could extend the advance custom cycle to engulf future price action.
This script work with all the assets correctly and beautifully from Stocks to Crypto-Currencies.
// ========================================================================//
This script comes with "Gann Seasonal Dates, Gann Planets vs Sun, Moon at Zero" as addons if you decide to purchase it.
// ========================================================================//
My contact information are available and listed below.
Enjoy!

Analog/Digital World Clock by DGTWorld Clocks - something for fun
Happy New Year!
ps: in case no update on the charts then the clock will not update too and will lag or stop till a new update is received

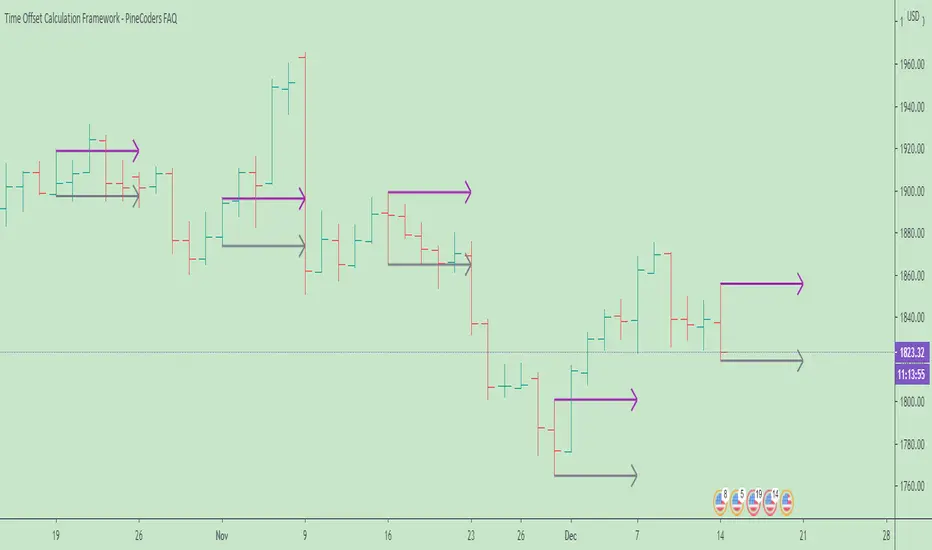
Time Offset Calculation Framework - PineCoders FAQ█ OVERVIEW
Calculating time-based offsets is necessary when coders need to draw lines or labels into the future because using `xloc = xloc.bar_time` in `label.new()` or `line.new()` is then mandatory.
This script provides a function to help with those calculations:
f_timeFrom(_from, _qty, _units)
The function calculates a negative (into the past) or positive (into the future) offset from the current bar's starting or closing time, or from the current time of day.
The offset can be expressed in units of chart resolution, or in seconds, minutes, hours, days, months or years.
█ HOW TO USE THE FRAMEWORK
1. You will need to include the supplied `f_resInMinutes()` function in your script in order to use `f_timeFrom()`.
It is used to calculate offsets using chart units when `f_timeFrom(_, _, "chart")` is used.
2. Whether you use `f_timeFrom()` for labels or lines, remember to use `xloc = xloc.bar_time`, as the default is `xloc = xloc.bar_index`.
3. Use `f_timeFrom()` for the `x` argument in `label.new()`, or for `x1` or `x2` in `line.new()`.
It can of course also be used in the relevant `label.set_*()` or `line.set_*()` functions.
Examples
// Label 3 days into the future from current bar's time.
label.new(f_timeFrom("bar", 3, "days"), high, "time + 3 days", xloc.bar_time)
// Label 2 hours into the future from current time
label.new(f_timeFrom("now", 2, "hours"), high, "timenow + 3 hours", xloc.bar_time)
// Label at bar's time plus 4 units of the chart's resolution.
label.new(f_timeFrom("bar", 4, "chart"), high, "time + 3 chart units", xloc.bar_time)
The parameters are:
f_timeFrom(_from, _qty, _units) =>
// _from : starting time from where the offset is calculated: "bar" to start from the bar's starting time, "close" to start from the bar's closing time, "now" to start from the current time.
// _qty : the +/- qty of _units of offset required. A "series float" can be used but it will be cast to a "series int".
// _units : string containing one of the seven allowed time units: "chart" (chart's resolution), "seconds", "minutes", "hours", "days", "months", "years".
█ LIMITATIONS
While this function makes it easier for coders to calculate time offsets using a variety of methods, it does not solve the inherent problematic that offsets do not calculate accurately when bars are missing between the start and end times of the offset. There is currently no way to circumvent this challenge in Pine.
Missing bars will occur on holidays, during no-trade periods (including normal periods where markets are closed) and when there are irregularities in data feeds. Charts at seconds resolutions, for example, will often miss bars when there are no trades to update the feed. On hourly charts of non 24x7 markets, periods when the markets are closed will also cause irregularities, as will holidays on day charts.
Other irregularities can occur because of how the offsets are calculated. A calculation of a one second offset from the bar's time will end one bar further on daily charts, for example. `f_timeFrom()` is no panacea; it simply makes offsets easier to calculate, however imprecise they are.
█ HOW TO USE THIS SCRIPT
The script's Inputs allow you to specify an offset, its units and starting time, and control the frequency of bars where lines are drawn.
Use the Inputs to play around with the parameters; you will quickly notice the irregularities mentioned above and be able to judge the usefulness of time-based offsets on the type of chart you use.
Look first. Then leap.
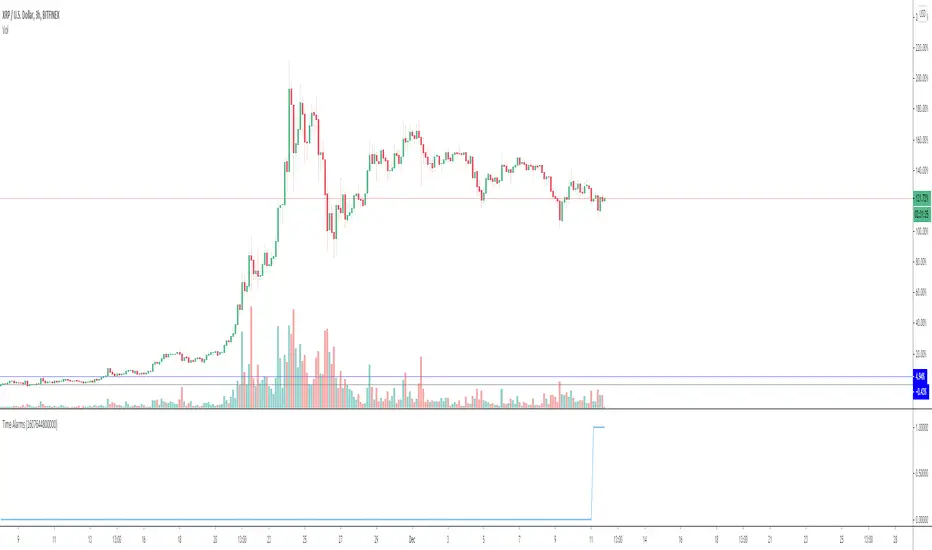
Time AlarmsA basic functionality addition to alarms
Now you will be able to fire an alarm at a desired time
It needs to be added in a timeframe small enough for the alarms to show. So if you want to fire at a specific hour an alarm you need to add it minimum at the 1h timeframe
Enjoy it
Time Divergence - TDV [SHK]A truly time based indicator to check the strength of the asset based on "Time". The main idea came to my mind about 2 years ago, When i was counting the candles in an impulse move and comparing it to number of retracement candles .
So i got a period (13 for example) and checked the price change between the 13 candles, Then the space between those two points (the price!) is divided to 13 (the time!).
The result can be analyzed by checking the Divergence, or checking the Linear Regression, or bollinger band, or trend lines and channels, or ...
You can also test different periods.
I'm price action trader and i don't use indicators, But i publish my past works for other users.
Hope you find new usage methods and share them in comments.

Gann Toolbox V1.5Gann ToolBox V1.5
// ========================================================================//
This script is meant to save you a lot of time plotting your Gann Boxes and Cycles correctly and accurately.
It allows you to scale your boxes and square them based on $ per degree.
It includes a few default cycles already built into into and an advance mode that lets you box the box anywhere you want through any time period you want.
You get the 1:1, 1:2, 2:1 Gann fan angles at each corner of the box and some additional angles at the midpoint to give you a complete star formation.
Using the Advance mode you can also adjust the length of your custom cycle and the global height increments. Default is 360degrees.
You can also play with offset values for your cycles.
That's not all, you also get to plot your horizontal lines between each cycle at an increment of your choosing.
Using this script you will be able to plot any cycle you want with a few clicks. And get your planetary lines and cycles quickly.
This script work with all the assets correctly and beautifully
Examples :
// ========================================================================//
This script comes with "Gann Seasonal Dates" as an add-on if you decide to purchase it.
// ========================================================================//
My contact information are available and listed below.
Enjoy!

Start the Script on Last Nth Bar [Experimental]Hello Pine Scripters,
Sometimes we need to run some processes in the scripts on last N bar but currently we don't know bar_index value of realtime bar or number of remaining bars before we reached it. So most of us use "start date" as input and run some processes after "start date".
This experimental script finds last Nth bar approximately. As you can see in the script we (should) use GMT, otherwise as I see the result might not be accurate (we don't know timezone used on the chart)
The idea is to find/use similar bar in the past (using timenow as reference) and then calculate aproximate the time of last Nth bar. the results may not be accurate all the time, also we can not know local holidays etc.
At the moment the script works on 1minute or higher time frames (it won't work on less 1min timeframes)
In the future if the Pine Team add something like "bar_index_realtime" then we will not need such things. by the way many thanks to Pine Team, they are doing great job.
You can use this script in your scripts as you want, no need to ask permission. If you can improve it let me know ;)
Enjoy!

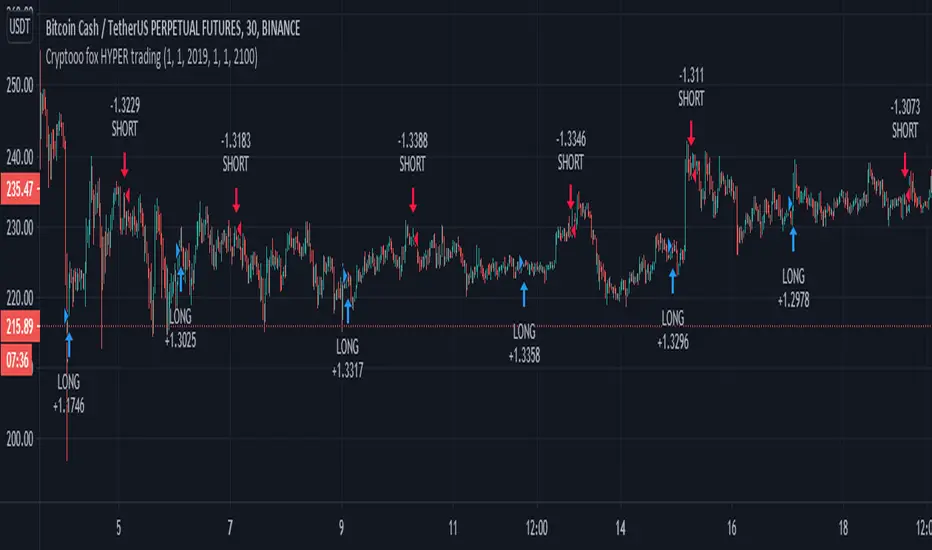
Alert of Cryptooo fox HYPER trading(CRYPTOOO FOX ( BCH ) long & short no repaint strategy)
Hello traders
- The alert of strategy is using higher time frame but it never repaint .
- The alert of strategy is working only in ( 10 % of equity ) you can change it as you want .
- When you use this alert you will get this message alert ( THIS INDICATOR MAY BE REPAINT )
and this is normal so we use higher time frame but as i said it ( never repaint )
- The alert of strategy is working in ( BCH / USDTP ) and ( BTC / USDTP) IN BINANCE FUTURE MARKET .
- I recommanded too much using ( 15 min , 30 min ) charts .
- This script is working in standard charts no ( heikien ashi or range ) charts .
- ( TO ACCES THIS SCRIPT PLEASE USE THE LINKS BELOW ) .

Cryptooo fox HYPER trading(CRYPTOOO FOX ( BCH ) long & short no repaint strategy)
Hello traders
- The strategy is using higher time frame but it never repaint .
- The strategy is working only in ( 10 % of equity ) you can change it as you want .
- I use 0.04 % as fees ( this future market in binance fees ) .
- I use 1000 dollar as capital ( you also can change it as your capital ) .
- The strategy is working in ( BCH / USDTP ) and ( BTC / USDTP) IN BINANCE FUTURE MARKET .
- I recommanded too much using ( 15 min , 30 min ) charts .
- This script is working in standard charts no ( heikien ashi or range ) charts .
- ( TO ACCES THIS SCRIPT PLEASE USE THE LINKS BELOW ) .
Forex Session Breaks DST AWARE!There seems to be no open source forex trading session DST (Daylight Savings Time) aware scripts which I think is absurd. This amazing community deserves better. So I adapted some code by icostan adding DST capabilities.
Original code by icostan here
I added DST code. Warning may not be perfect yet. Could be a bug or two. It only supports 3 major sessions right now but you can add your own rules for the other timezones by copying my logic.
It is open source so please add the other sessions and regions as needed and update me please.

Love.Gunfire - Giant All For One 巨人VIPGiant is All For One , the Last special version for all markets, optimized by Love.Gunfire from Gann. Each one contains natural numbers. If you want to know the recent support. resistance and trends, read on.
Only disciples who have learned "Giant Weapons" can select VIPs to use and the version will be continuously updated.
There the usage settings:
Enable/Disable signals on chart
Enable/Disable XTV based on trend
Enable/Disable label code to smart trade
How does it work?
Basic usage
After the small/medium giant appears BUY, and above T line, may be you can consider the operation of buying
After the small/medium giant appears SELL, and below T line, may be you can consider the operation of selling
What are the signals?
Advanced usage
The small/medium giant cooperates with the giant weapon operation to confirm the upward trend and consider buying
The small/medium giant cooperates with the giant weapon operation to confirm the downward trend and consider selling
For giants to operate, no matter how to make any transaction, they must have the mind of "continuing to stop making profits is the emperor's way, and strictly guarding against erosion is a virtue."
Want to get this indicator today!
For access, please DM us or visit the link/Telegram below in our Signature.
Contact: Love.Gunfire
US30 CURRENCYCOM:US30
GOLD OANDA:XAUUSD
HKEX:700
FX:EURUSD
BINANCE:BTCUSDT
--------------------------------------------------------------------------------------------
巨人是結合天地為一。特別的版本可以應用全球商品,是由彥暉從江恩中使用八多年來優化而來,每一個都含有自然的數字,如果想知道近來的支持、阻力和趨勢,一定不可錯過。
更新設定方法 :
開啟/關閉 訊號
開啟/關閉 XTV趨勢
開啟/關閉 數字
如何使用?
基本使用方法 :
待小/中巨人出現BUY後配合T線以上 ,可考慮買入的操作動作。
待小/中巨人出現SELL後配合T線以下,可考慮沽空的操作動作。
訊號是什麼?
進階使用方法 :
小/中巨人配合巨人兵器操作,確認向上的趨勢可考慮買入。
小/中巨人配合巨人兵器操作,確認向下的趨勢可考慮沽空。
暫時只開放給「巨人兵器」的弟子和特選VIP使用,版本會持續更新。
巨人操作,無論做任何交易,必須要有「不斷止賺是皇道,嚴守止蝕是美德。」的心思。
立刻行動,良機勿失 !
想獲取權限,請給本族訊息或訪問Telegram,本族簽名中的以下鏈接。
請聯絡 : Love.Gunfire
US30 CURRENCYCOM:US30
GOLD OANDA:XAUUSD
HKEX:700
FX:EURUSD
BINANCE:BTCUSDT

[RS]Supertrend GridDynamic grid system based on supertrend.
note: the input nlines/nfractions are not locked so if values too high might start overlapping line objects.
indicatorenindicatoren is one non-overlaying indicator with multiple oscillators combined.
indicatoren provides the following functions:
- RSI (Relative Strength Index)
- Stochastics (representation of mathematically calculated momentum)
- Configurable MAcd (Moving Average Convergence Divergence) visually compressed to 0-100 range
- DMI & ADX (Directional Movement Index & Average Directional indeX) with visual lowering option
- Bollinger Bands direction
- COMBI Average
- Hourly, 4Hourly, Daily and Weekly time-indications
The length and appearance for each element can be adjusted. The MAcd has several modes and the brightness
of its elements can be adjusted with one single control.
The COMBI Average consists of a weighted average of the RSI, Stochastics, MAcd, DMI and the BB Direction.
It has its own definable length. Depending on the timeframe used, a visual indication of Hours, 4 Hours,
Days and Weeks might prove handy, especially on shorter timeframes.
Displaying this number of oscillators all at once may look like a carnival, therefore, each function can easily
be switched on or off. indicatoren can be used as just an advanced MAcd for example, or have it show the
combination of functions suiting you the most.
In order to combine a MAcd (+/- infinite scale) with Stochastics or RSI (0-100 scale), the MAcd is being visually
compressed and a Visual Multiplier parameter is provided to make it fit under any circumstances on any timeframe.
The DMI +/- and ADX scale are divided by 2.5 by default. Having the DMI’s on the lower portion of the indicator
does still provide decent info at a glance while it is not in the way of the other oscillators.
Books have been written and many articles and videos have been made about the meaning and possible applications
of these oscillators in trading.
The unique combination of these oscillators within indicatoren , together with the simple, yet useful,
visual options, make it to quite a versatile indicator on every timeframe on any chart.
GuidoN - November 2019, July 2020

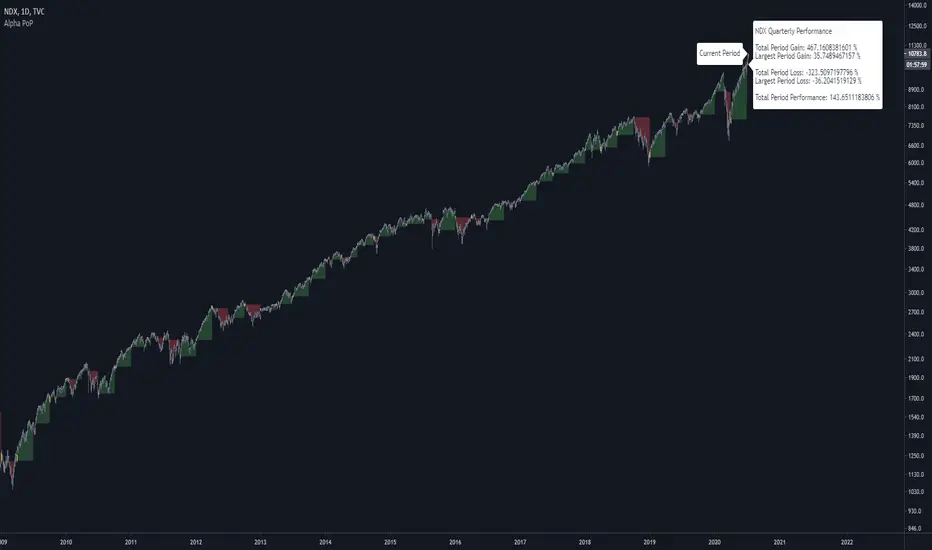
Alpha Performance of PeriodAlpha Performance of Period (PoP) produces a visualization of returns (gains and losses) over a quarterly, monthly, or annual period. It also displays the total % gain and loss over any length of days, months, and years as defined by the user.
Performance of Period (PoP) can be used to understand the performance of an asset over multiple periods using a single chart layout, and to compare the performance of different assets by using a multi-chart layout.
This can, for example, be used to compare the NASDAQ, S&P, and DJI over the past 20 years to create a dow vs. nasdaq vs. s&p performance chart. This can help you understand a comparison of historical returns by showing which performs the best month-over-month, quarter-to-quarter, year-to-year, throughout any custom period of days/months/years.
The ability to get a visualization of the % gain/loss can help to better understand how markets have performed over time and which markets have historically performed the best.
Check out the up and coming Educational Idea we will be releasing soon after this is live to see an example of how we use this tool.
Current Period Label
-----
Current Period : This label shows the current period's performance only when you hover over it.
(This label is located to the left of the current period's open candle and at the current candles close price)
TICKER "Time Period" Performance Label
-----
Total Period Gain : The total of all % gain periods from the start to end date.
Largest Period Gain : The biggest % gain period from the start to end date.
Total Period Loss : The total of all % loss periods from the start to end date.
Largest Period Loss : The biggest % loss period from the start to end date.
Total period Performance : The total % performance, the difference between the total gain and total loss.
NOTE : The "Current Period" performance is excluded from ALL five of the above-mentioned figures. This was done to avoid giving inaccurate comparison figures due to the period not being finished yet.
Inputs
-----
Current Script Version + Info : A drop-down list of instructions for the user to refer to.
Dark Mode Labels : Toggle on for Dark Mode. This is done since Labels text and background color can not be adjusted separately within the visual inputs so this is the best fit solution.
Time Period of Returns : Pick the period of performance you would like to emulate monthly/quarterly/annual.
Start Date : The day to start tracking performance.
Start Month : The month to start tracking performance.
Start Year : The year to start tracking performance.
End Date : The day to stop tracking performance.
End Month : The month to stop tracking performance.
End Year : The year to stop tracking performance.
As always if you have any feedback let us know in the comments and leave a like if you enjoy this tool :)
DC Time KeeperBefore anything, take notes of the script limitations :
1) This script doesn't give trading information on itself.
It is intended has additional value to my other script named : Time Dilated Donchian Channel
Blue line = Normal time of the day
Orange line = Observed time of the day
Red line = What if time travel was allowed... Which time would I observe?
More information about this script :
2) The script has the setting : "Max_bars_back" set to 390. This is required to use dynamic length and an "internal clock"
*390 is the normal number of bars in a typical stock trading day.
3) The script requires volume data to work correctly
* I use a way to represent volatility that requires ( volume + price movement + time, no sma , no stdev)
Why ? Because:
HIGH-LOW = Fail to get gap information, fail to get volume information
TR /ATR = Fail to get volume information
STDEV = Not very good with dynamic length as it use SMA and fails when length <2
SMA = SMA give very strange results when using non-integer numbers.
So a good idea is to use the 1 minute timeframe for this indicator.
Conclusion: this script is basically limited to stock trading.
If I could set Max_bars_back to 23 400 this would even work better with a 1 second time frame as more data would be entered in the system.
The idea behind the script is that volatility exists in two different formats depending on how you observe the situation.
Remember your physics class? Light can be a wave or a particle depending of the situation.
Volatility seems to share a strange similar property.
If volatility share similarities with light, then time dilation effect could be applied to stock movement.
Time Dilation formula
Time observed = (Last time - First time) / sqrt(1-(pow(v,2)/pow(c,2))
I've tried a lot of ways to use this formula as is.
Problem is : C.
C is the speed of light and I haven't found the equivalent stock market constant yet.
In order to keep the law of physics like they actually work, when a new time is set, I had to "Protect its value".
protected_new_time = highest_(observed time , normal time)
No time travel is allowed. *yet.
For more information about time dilation:
en.wikipedia.org

Mercury Retrograde Cycles V2 [Moon]Plots Mercury Retrograde cycles from start to end.
What is Mercury Retrograde?
Mercury Retrograde is when the planet Mercury appears to be traveling in reverse or backwards across the night sky with respect to the stars, the zodiac, and other bodies in the celestial canopy.
It happens when Mercury goes in between the Earth and the Sun. Basically, Mercury is lapping or passing Earth during this period.
An illusion created by the way that Earth and Mercury orbit around the sun. In reality, this is both planets perpetually orbiting in the same uniform direction.
In ancient Roman mythology Mercury is supposed to rule all types of communication including - buying, selling, speaking, reading or contractual agreements.
Does this work or mean anything
I don't hold the answers to the universe you'll have to go looking for yourself.
Works best right now on the Daily (D) timeframe.
Send me a DM if interested.

Combination Parabolic MA/IIR/ALMA Strategy, and other goodies Okay, so this is a lot. It started mostly with me combining indicators and looking for ideal entry criteria.
It is also a collection of conditions, whether used or unused, for my current chosen "best" strategy. It is currently set how I like it, but it has changed with time, and will continue to do so. Within, there are variables that are unused, but offer some insight into the overall odds of a trade. They were, in fact, once used but fell out of favor. And all details for this strategy are within the comment header of the script.
As this evolves, I most certainly wont keep any future findings and hope for profit from my peers (yinz). Also, I'd like to give a sincere thanks to the people of TV for what I learned in a few month's time and their flexible membership plans. Basically, I'm just a mad scientist, but this monster's a masterpiece and folks here before me made many indirect contributions to it.
--------------------------
Okay guys, lastly and most importantly,
Each smack of the like button is a vote of your confidence in me, to my beautiful landladies, Celeste and Adele, that my rent will be caught up and that it won't always be a problem. Which, in my mind, makes me a graph. And they've got strong hands and don't sell the low. I more than respect that. Seriously. And I'm very grateful for their willingness to work with me, but the thing is that I didn't ask first; life just happens. But few are tolerant of others. And quite importantly, I truly believe that I will be successful one day, and that "thumbs-up" button is your vote of confidence. If you're not sure, then don't hit it yet. Maybe my scripts will boost your confidence in me :)
-------------------------
PS: And you know what? I'ma give a shout-out to Philakone for teaching me everything that I know about Elliot Wave . Absolutely. Two years ago, I would keep telling myself that one day I will put something in his gratuity wallet or pursue the paid courses. And, I still plan on it, because I'm grateful. And so also, to everybody else, I'm recommending him to learn from. because as a trader who might not know everything for free, you can certainly fill in the gaps with his altruistic offerings. And I'm betting that you will then feel more than inclined to buy the Udemy course.
"If wave 2 retraces a lot; number 4 will not". Repetition. Philakone didn't fix my memory but he sure did find a workaround, haha
Okay, everyone, Thanks!
