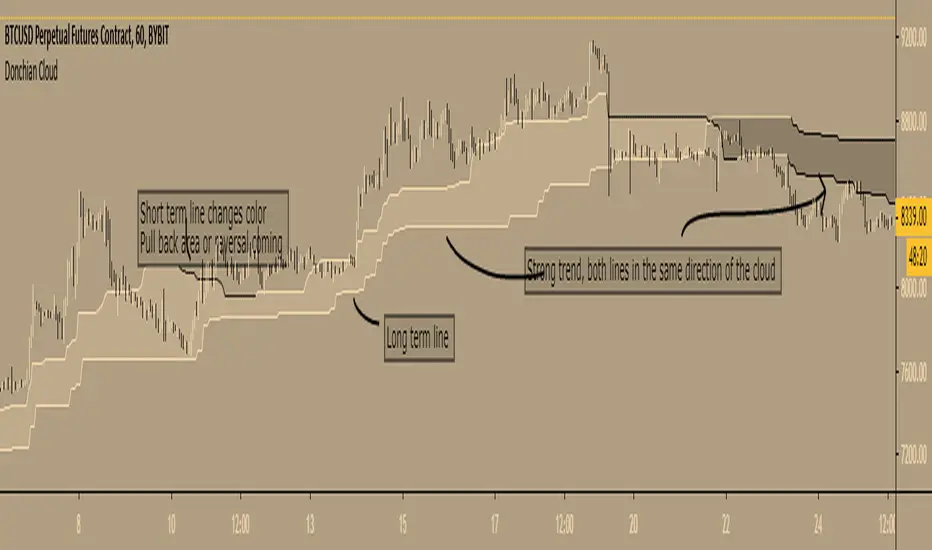
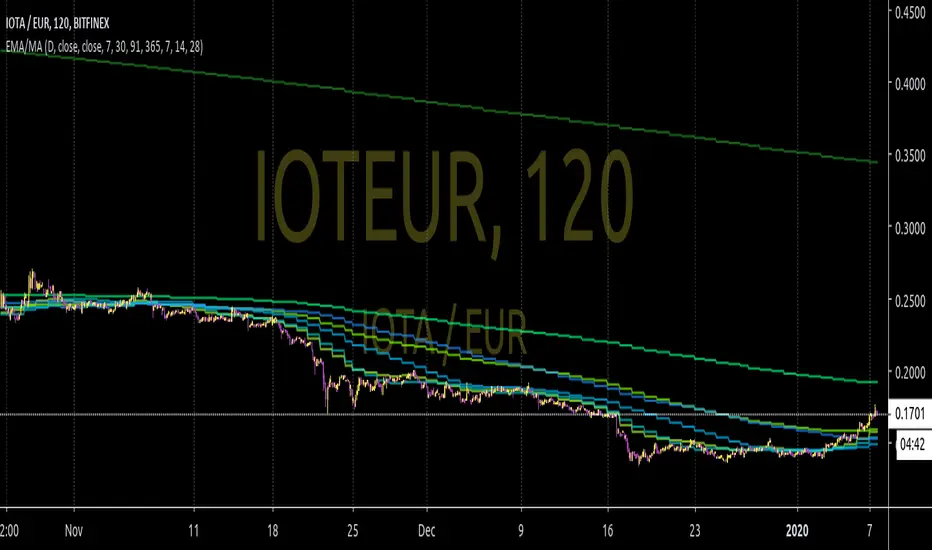
Donchian Cloud - evoA cloud based on the highest high and lowest low of a given period (Donchian), same lines used in Ichimoku Cloud (Conversion line or Base line).
Short term line is based on current time frame, long term line is based on your given multiple of current time frame.
The color of the lines is based on up or down movement.
I stole a piece of code from PineCoders for the multiple time frame:
I have not used this in my trades (yet) so I don't know how good it is, just posting because it looks nice :)
Feel free to share your settings if you can find good ones.
Timeframe
[KICK] Volatility HeatmapWith this indicator you can gauge the price volatility of an instrument across multiple timeframes in a very compact visualization. It allows you to find critically low areas of volatility and predict the likelihood of an imminent move or the conclusion of a move. While you can do this with other indicators, it is often easy to miss low volatility on timeframes that you don't normally survey.
Features:
Measure volatility using either Average True Range Percentile Rank (ATR-PR) or Historical Volatility Percentile (HVP)
Measure volatility from any other source (e.g. Volume, or custom series from another indicator) using HVP
2 Rendering Modes (Smooth and Distinct) as seen in the sample chart above
Ability to show current timeframe Volatility in bar chart above the heatmap
Get alerts when a certain number of timeframe levels (configurable) are showing critically low volatility (implying imminent move)
Get an alert when the current timeframe volatility level emerges from a critically low volatility zone (usually indicating the start of a significant move)
The bands on the map are 1x, 2x, 3x, 5x, 8x, 13x, 21x, and 34x the curent timeframe. The volatility measurements go (from lowest to highest): Lime, Blue, Dark Purple -> Light Purple (gradient), Magenta, Pink. If you see grey blocks/bands, these indicate that the instrument you are using does not have enough historical data to determine the volatility based on your timeframe and reference period. For example, if you are using a reference period of 100 and are on the daily view, to render the bottom-most band (x34) you would need around 3400 days of data (over 9 years).
You can use this indicator in multiple ways. My favorite way personally is to look for areas that have multiple consecutive timeframes showing low volatility warnings and then enter when the highest of those timeframes turns back to purple. Use other methods, analysis, or indicators to determine direction (or just straddle P.A. with market stops). If I am scalping, then I will generally mostly watch the "current timeframe" and get alerts when it emerges from low volatility.
Use the link below to watch a tutorial video, request a trial, or purchase for access.

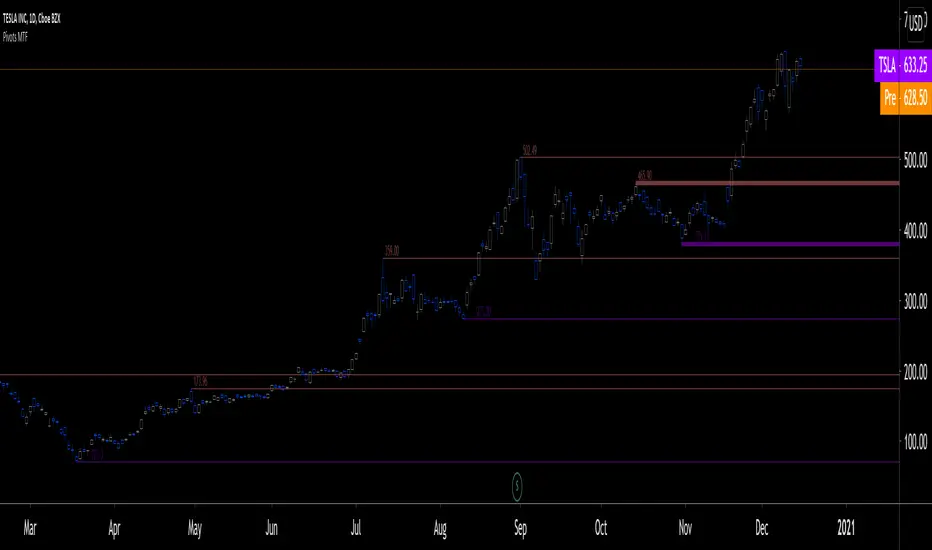
Pivots MTF [LucF]Pivots detected at higher timeframes are more significant because more market activity—or work—is required to produce them. This indicator displays pivots calculated on the higher timeframe of your choice.
Features
► Timeframe selection
— The higher timeframe (HTF) can be selected in 3 different ways:
• By steps (15 min., 60 min., 4H, 1D, 3D, 1W, 1M, 1Y). This setting is the default.
• As a multiple of the current chart's resolution, which can be fractional, so 3.5 will work.
• Fixed.
— The HTF used can be displayed near the last bar (default).
— Note that using the HTF is not mandatory. If it is disabled, the indicator will calculate on the chart's resolution.
— Non-repainting or repainting mode can be selected. This has no impact on the display of historical bars, but when no repainting is selected, pivot detection in the realtime bar will be delayed by one chart bar (not one bar at the HTF).
► Pivots
— Three color schemes are provided: green/red, aqua/pink and coral/violet (the default).
— Both the thickness and brightness of lines can be controlled separately for the hi and lo pivots.
— The visibility of the last hi/lo pivots can be enhanced.
— Prices can be displayed on pivot lines and the text's size and color can be adjusted.
— The number of bars required for the left/right pivot legs can be controlled (the default is 4).
— The source can be selected individually for hi and lo pivots (the default is hlc3 and low .
— The mean of the hi/lo pivot values of the last few thousand chart bars can be displayed. Pivots having lasted longer during the mean's period will weigh more in the calculation. The mean can be displayed in running mode and/or only showing its last level as a long horizontal line. I don't find it very useful; maybe others will.
► Markers and Alerts
— Markers can be configured on breaches of either the last hi/lo pivot levels, or the hi/lo mean. Crossovers and crossunders are controlled separately.
— Alerts can be configured using any of the marker combinations. As is usual for my indicators, only one alert is used. It will trigger on the markers that are active when you create your alert. Once your markers are set up the way you want, create your alert from the chart/timeframe you want the alert to run on, and be sure to use the “Once Per Bar Close” triggering condition. Use an alert message that will remind you of the combination of markers used when creating the alert. If you use multiple markers to trigger one alert, then having the indicator show those markers will be important to help you figure out which marker triggered the alert when it fired.
A quick look at the pattern of these markers will hopefully convince you that using them as entry/exit signals would be perilous, as they are prone to whipsaw. I have included them because some traders may use the markers as reminders.
Using Pivots
These pivots can be used in a few different ways:
— When using the high / low sources they will show extreme levels, breaches of which should be more significant.
— Another way to use them is with hlc3 (the average of the high , low and close ) for hi pivots and low for the lo pivots. This accounts for my personal mythology to the effect that drops typically reach previous lows more easily than rallies make newer highs.
— Using low for hi pivots and high for lo pivots (so backward) can be a useful way to set stops or to detect weakness in movements.
You will usually be better served by pivots if you consider them as denoting regions rather than precise levels. The flexibility in the display options of this indicator will help you adapt it to the way you use your pivots. To indicate areas rather than levels, for example, try using a brightness of 1 with a line thickness of 30. The cloud effect generated this way will show areas better than fine lines.
Realize that these pivot lines are positioned in the past, and so they are drawn after the fact because a given number of bars need to elapse before calculations determine a pivot has occurred. You will thus never see a pivot top, for example, identified on the realtime bar. To detect a pivot, it takes a number of bars corresponding to the dilation of the higher timeframe in the current one, multiplied by the number of bars you use for your pivots' right leg. Also note that the Pine native function used to detect pivots in this indicator considers a summit to be a top when the number of bars in each leg are lower or equal to that top. Bars in legs do not need to be progressively lower on each side of the pivot for a pivot to be detected.
If you program in Pine
— See the Pinecoders MTF Selection Framework for an explanation of the functions used in this script to provide the selection mechanism for the higher timeframe.
— This code uses the Pine Script Coding Conventions .
Thanks
— To the Pine coders asking questions in the Pine Script chat on TV ; your questions got me to write this indicator.
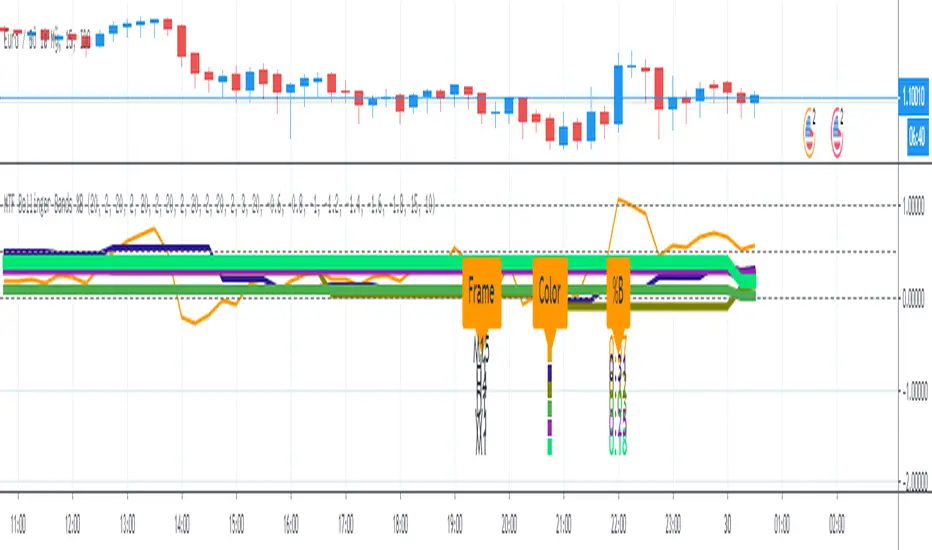
MTF Bollinger Bands %BMulti Time Frame (MTF) Bollinger Bands %B option:
1. On/ Off Bollinger Bands %B - M15 (15-Minute)
2. On/Off Bollinger Bands %B - H1 (1-Hour)
3. On/Off Bollinger Bands %B - H4 (4 Hour)
4. On/Off Bollinger Bands %B - D1 (Daily)
5. On/Off Bollinger Bands %B - W1 (Weekly)
6. On/Off Bollinger Bands %B - M1 (Monthly)
7. On/Off Panel Info: Color note & %B value
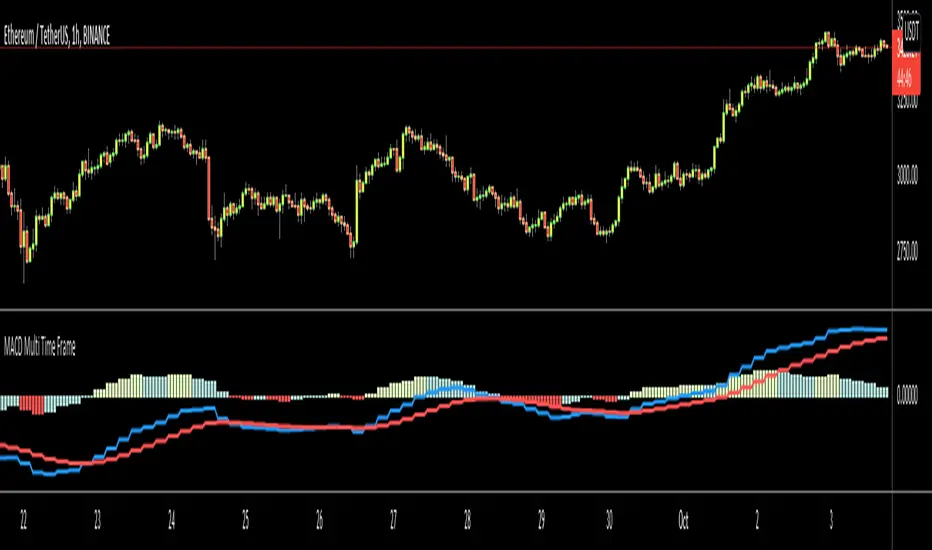
MACD Multi Time FrameThis is non-repainting multi time frame MACD script. You can choose HTF manually or HTF is calculated automatically if HTF Mode is "Auto" that is default.
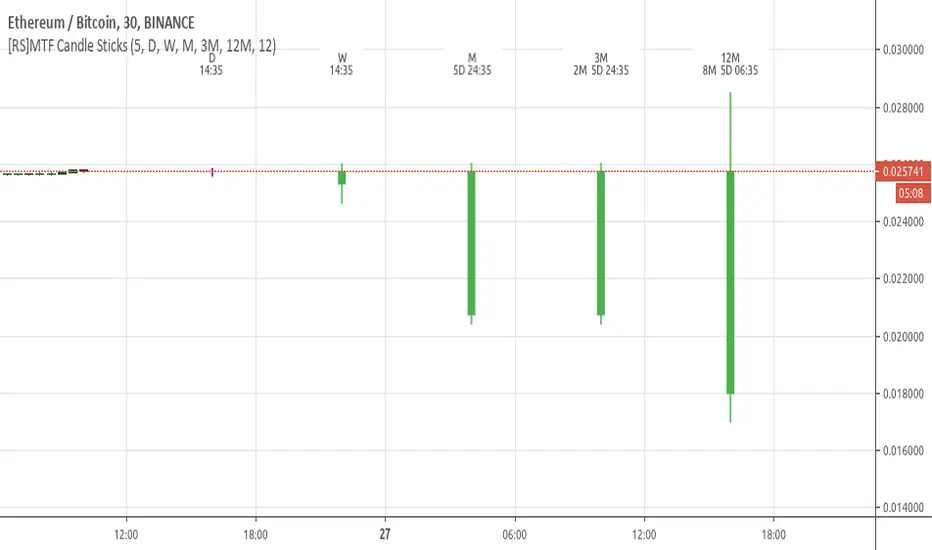
MultiTimeFrame Fractals D W M [xdecow]This indicator shows fractals in different timeframes. With the possibility of coloring the bars with any combination of current, daily, weekly and monthly timeframes.
The return points are calculated as follows:
high > last 3 highs and close above highest low
low < last 3 lows and closes below lowest high
The direction of higher timeframes fractals tend to be more durable and reliable. This indicator helps to find the fractal alignment of different timeframes, so that you can look for trade opportunities in the same direction as the higher timeframes and improve your chances.

ALLinTension v5.0 ::: Allin® MarketEnergy™You need two indicators for it to work: AllinTension 5.0 and AllinStrategy 5.0 and use them in sinergy.
They measure and gather information and then present them in an intuitive way for better opportunity spotting and a better and quicker decision making about buy or sell entries in certain markets.
In works with crypto, stock, fiat and futures market.
I will explain how it works o a page but as a thumb rule: the more GREEN you see turning up like an energy the more LONG situation is and the more RED you see turning up like en energy the more SHORT the situation is.
The best thing about a product of mine is that it can be backtested. Results of backtesting yields up to 85% of accuracy and risk-reward ratio up to 5X or more.
Indicator - AllinTension 5.0
This indicator will enable you to actually feel the market on several levels. Exploiting informations from different timeframes and different oscillators with different setting and average them out.
With this indicator you will either confirm the sensed direction or you will skip the opportunity because signals are not properly aligned. To be able to resist FOMO is really crucial here. Opportunities are in abundance. There will be more. A lot more. Really.
How to read it and properly use it?
For more in depth understanding on how it works and proper usage of it There is lot of information on the page.
Strategy: AllinStrategy 5.0
This strategy indicator is used as a backtesting platform for different types of various settings for a selected pair.
Backtesting means you can test each TimeFrame (best 1-9min) with various AllinTension indicator settings. You will get a result for profitability in the last period (but it is not that important anything but for maybe feeling bad you missed it), success rate in percent (anything above 70% is good enough) and you have to watch the ratio of the max dropdown and average trade size (least acceptable is -5x, better is 2x or less).
So you will learn which strategy (TF and indicator setting) has steadily preformed best while being profitable in the past and assume it will do that in the same manner with same accuracy in the future. It sometimes changes so you need to preform rutine testing after some bigger market movements.
With this you will find the best preforming TImeFrame for each window. You will adjust settings for each window differently to diversify view on the market. My personal best setting are for the first window 4-16-64, second window 3-9-27, third window 2-8-32 and forth last window 5-20-80.
So ALLinStrategy is a visual representation of the market and the most important thing, it includes a feature "Strategy Tester" to backtest chosen strategy. The results may surprise you and they can all be proven!:) So what do you do in this case? :):)
But to really understand the market and given signals from this Strategy, you will need indicator ALLinTension or you are going blindfolded guess trading.
How to read it and properly use it?
For more in depth understanding on how it works and proper usage of it There is lot of information on the page.
For strategy to work you first have to find profitable and accurate enaugh TF (more than 70% should do the trick)and indicator settings (there are some favorites) and apply it to your executing strategy.

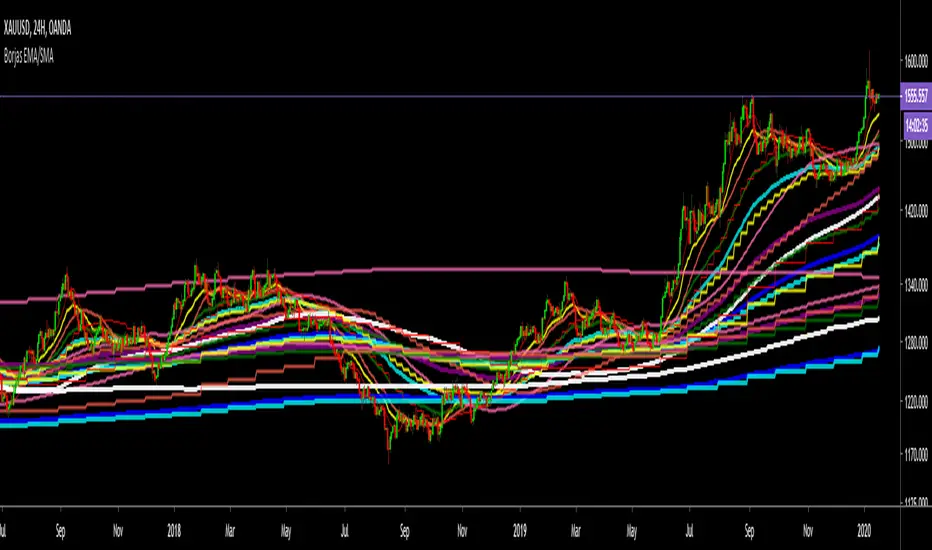
Borjas Tarh EMA/SMA Combo MTFBorjas Tarh EMA/SMA Combo MTF
Include 4 Sets of EMA s & SMA s which can apply to multiple Time Frames .
Each Moving Average can be edited or be toggled. So you can watch specific EMA s/ SMA s on other Time Frames .
© mrhashem
© Borjas Tarh Company
Multi Timeframe EMA Golden Ropes [SOMMI 1.0 EDIT]Come and try out my famous Golden Ropes 💛💛💛💛
When a boxer is in the ring, they lean on the ropes for safety. And I provide this technique here, to you for free! 🥊 🏆
...
How SOMMI uses his Golden Ropes...
It is simple 200 period EMA.
Be bullish when price is above it, and be bearish when price is below it.
This is meant to establish a bias, and not a strategy by itself.
Execution
- You can use this with a strategy such as Stochastics, RSI or MACD. 💚
- For example, when we're above the Golden Ropes, look for "dips" to buy, using your indicator 🧡
- And when we are below the Golden Ropes, look for "peaks" to sell. 💙
- Make sure you use a stop which is just beyond the Golden Ropes, if you are close to it.
...
Two of my favorite scalping strategies...
STRATEGY #1:
- The market is trending one way (example: Down) and then comes back and touches the Golden Rope and holds there .
- This is a great selling opportunity, most indicators will tell you to sell at this point. Lean on the Golden ropes!
STRATEGY #2:
- The market is slowly grinding upwards and comes back near the Golden Ropes, and holds.
- Buy the dip, and put a stop beyond the Golden Ropes. 💛
BONUS!!
STRATEGY #3:
- The market has been grinding one way for a long time, on your selected time-frame. In this example, imagine it's been going up...
- It comes back towards the Golden Ropes and CUTS right through it on the downside.
- Sell through the Golden Rope, with a stop just above it.
- You MUST have a good price on this strategy, if you are too late and miss it, avoid FOMO and wait for the next trade!
🥊

MTF Smoothed Moving Averages x4A set of smoothed moving averages that stay at a fixed timeframe, regardless of the timeframe of the chart but don't have nasty jaggedy lines. Instead, they are smooooooooooooth...

Multi EMA/MA with fixed timeframe by TopsyKrettThis script shows several EMAs and MAs, fully editable
The moving averages dont change when changing candlelength
Unedited it gives:
- 4 EMA (weekly, monthly, quarterly, anual)
- 3 MA (7day, 14day, 28day)
based on daily close
In the script are two additional EMAs and MAs mutet, easy to activate with pine editor
ANN BTC MTF Golden Cross Period MACDHi, this is the MACD version of the ANN BTC Multi Timeframe Script.
The MACD Periods were approximated to the Golden Cross values.
MACD Lengths :
Signal Length = 25
Fast Length = 50
Slow Length = 200
Regards.

Shade a particular timeframeI couldn't find a script that shades a particular timeframe so I created one where you can adjust the times, colors, and transparency. Pretty simple but nice if you just want to trade before or after certain times. Only issue is it seems to default to Eastern times. Lucky you if you are on the east coast of the USA! Everyone else add or subtract from that timeframe.

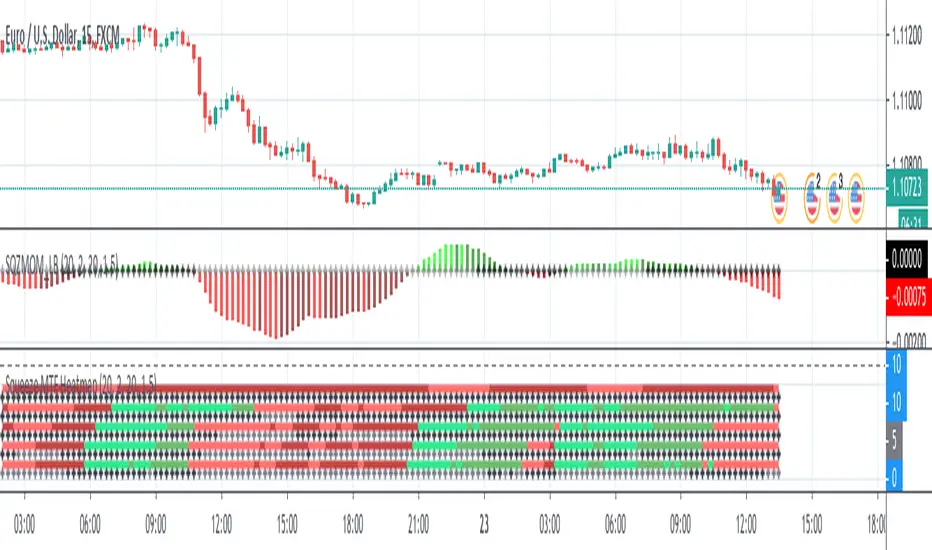
Squeeze MTF HeatmapHere is a multi-timeframe heat map using one of the most apreciated indicators in Tradingview: Squeeze Momentum Indicator by LazyBear.
Study shall be added to 15min chart.
It indicates squeeze and momentum at: 15 min, 30 min, 60 min, 240 min and 1 Day.
Thanks to © azimuthdynamics for inspiration and portion of code
Thanks to Lazy Bear for coding Squeeze Momentum Indicator
BB-levels_MTFThis indicator draws Bollinger Bands- levels from higher timeframes on the chart's right border as a horizontal support/resistance lines. BB(20)- levels are shown from timeframes MN, 2W, 1W, 1D, 4H and 1H.
Levels are shown both for Standard Deviation 1 (dotted BB25- and BB75- lines) and STD 2 (solid BB0- and BB100- lines), as well as SMA20 (blue BB50- line).
You can choose if you want to see only the lines or the labels also. And you can modify the line's length and width, and the label's position on the screen also.

Multi Timeframe Trending State DetectionThis script shows the "trending" state of a symbol at a certain moment in time on a certain set of timeframes. A trending symbol is a symbol that is moving out of a current balanced state to search for a new accepted price level. The detection of the state is done by looking at the place where the current price is related to 2 bollinger bands.
Depending on the place where the price is, the symbol is ...
a) ... not trending. It is chopping around. (Color Gray)
b) ... trending. The trend shows a certain strength. (Color Green for uptrend, Color Red for downtrend)
c) ... trending and arriving at (a temporary) peak and can possibly revert. Good for profit taking, or entering counter-trend. (Color Yellow for uptrend, Color Orange for downtrend)
By moving over the current main chart, you can see in the data window at the right, what was the state on a certain date for all timeframes together. All states are color-coded. By checking the bubble help in input, a textual explanation of the actual colored states (1 per timeframe) is displayed on top of the history and is updated at every change. To read well the bubble help, the control has to be set on full-screen temporarily.
The script is dynamic in 2 dimensions.
a) When you select a certain timeframe, all lower timeframes will not be displayed. Only the higher supported timeframes are included.
b) In input, you can specifiy a subset of timeframes you want to follow by checking or unchecking the appropriate timeframes.
The combination of the 2 selections gives you the ultimate list of timeframes shown.
You can infuence the detection by selecting in input another set of bollinger bands, characterized by the number of standard deviations and the length of the mean needed for the calculation of the bollinger bands .
How to read the indictor ?
A horizontal line gives you the history of the "trending state" on 1 timeframe over all bars accessible.
A vertical column gives you the "trending state" on all timeframes at a certain bar.
The last vertical column gives you the most recent "trending state" on all timeframes.

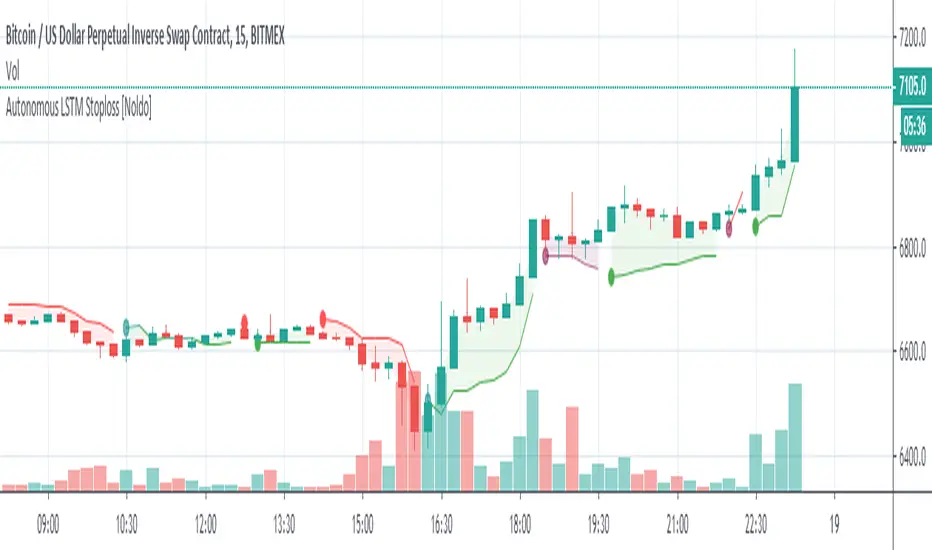
Autonomous LSTM Stop-LossStructure
Autonomous LSTM Stop-Loss is a stop-loss technique that uses the Autonomous LSTM algorithm.
For detailed info about Autonomous LSTM :
*** Features
This structure is different from standard stop-losses.
The base frame is based on "Market Adaptive Stop-Loss" script.
For detailed information about Market Adaptive Stop-Loss:
This script uses the Autonomous LSTM as cross method.
Tradeable / Non Tradeable Region Detector :
This script separates tradeable and non-tradeable regions with a coloring method.
Plotting Rules :
* Maroon : Uncorfirmed Short Positions
* Teal : Unconfirmed Long Positions
* Green : Confirmed Long Positions
* Red : Confirmed Short Positions
This script can be used in all time frames.
Does not repaint. ( Source = close )
*** Settings :
The only option here is the ATR multiplier.
The default use value of this ATR multiplier, which is of the standard of stop-loss, is 2.You can set it from the menu.
No alert is set.
Because the positive and negative regions are the same as Autonomous LSTM.
Since the traders can trade according to the support and resistance outside the definite regions, the unnecessary signal was confused and the alerts were removed.
*** Usage
The Stop-Loss indicator can slide on the chart.
So you have to make sure you put it in place.
Since this is a region scan from the OHLC levels, indicator contains small blue dots to the ohlc levels and made it serve as a guide.
However, since we cannot know the OHLC values precisely, it is best to use them as follows:
Because it is often forgotten to put it in place:
(OHLC : Average of Open, High, Low, and Closing prices for each period)
Using this script in a new pane below will radically solve slip problems.
Stop-Loss values do not slip definitely.The values are selected from the alignment.
NOTE :
Some structures (Market Adaptive Stop-Loss) and design in this script are inspired by everget's Chandelier Exit script :
Best regards.
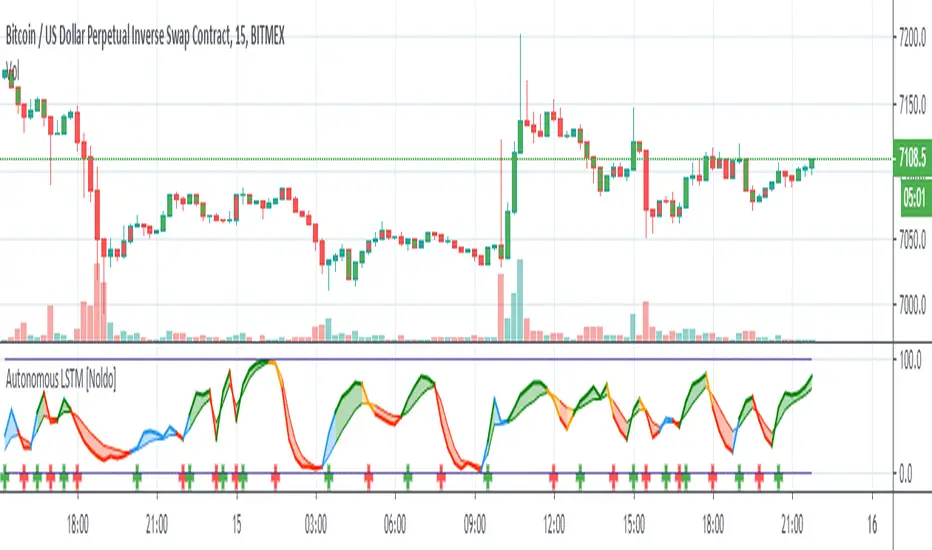
Autonomous LSTM [Noldo] Structure
Feature Layer 1 : Formulation :
The Autonomous LSTM adaptive period equation is a multivariate equation created by averaging a table based on market weights and optimizing it for each time period, by specially Artificial Neural Networks (ANN) training and taking note of the instruments chosen from Foreign exchange instruments, Stock markets , Futures and Commodities , Interest Rates and Yields all over the Global Markets.
Market weights and liquidities were taken into consideration and included in the calculations.
Feature Layer 2: Forecast Algorithm :
When we apply only the first item, we only get the buy and sell signals in reverse.
In other words, since we measure the expectation, the positive signal informs the bear market and the negative scenario informs the bull market.
If we only act according to the expectations market, our system will be very sensitive.
When we associate this with real prices, both our accuracy increases and the reverse market returns to the normal market.
In other words, as in the indicators with standard average, the upward crosses are buy and the downward crosses are sell signal.
Examples:
a -) The normal deep learning script (ANN), which is only created according to expectations:
Unlike standard market, it gives reverse signals.
Original script :
b-) Script with Forecast Algorithm but it only uses valid and standard periods for certain instruments :
Original script :
Feature Layer 3 : Composite of Two Layers : Adaptive Period (Length) Algorithm
This layer is the most important layer.
Outputs the period.
It adjusts itself to market conditions and provides a more agile trading environment under all circumstances.
Display of smart period function and standard period :
Where the market is stagnant, the period increases automatically and reduces unnecessary trade, while in trendy markets the period decreases automatically and allows to see positions first.
The degree of stagnation of the instrument concerned is not calculated solely by volatility.
We may perceive this in relation to several factors, but yes volatility is one of these factors.
When we put the script system under the MACD (Moving Average Convergence Divergence) roof, I did the tests.
Where both averages were positive, they could report accurate harsh trend news, or vice versa.
But I decided to give it up and put it on the Stochastic Money Flow Index .
First of all , Stochastic Money Flow Index function takes the volume into account.
The reason for this is a very important factor, which is naturally contained in the structure of High - Low conditions related codes.
And by using this factor, it could be superfast adaptive in both stagnant and trendy markets.
Feature Layer 4 : High - Low Selection Algorithm
The High-Low Selection Algorithm does not depend on a specific period but scans all periods backwards.(Lookback Function - Lkb )
Outputs the lowest or highest values in the specified new period.
This algorithm was written by me with the concern that if everyone trades according to the same threshold values, it will cause problems and choosing between values of the whole period length will slow down the signals.
This algorithm consists of two functions.
a - Lkb (Lookback Function) :
The lookback function scans back all periods from 0 to Smart Period bars at the same time.
In order to show the effect of the function, it was done between 0 and 84 bars.
However, the scan period of the function is normally at the same time: 0 to adaptive period time.
If the adaptive period includes a fractional day, it can also scan it.
There is no need to be an integer.
All functions are written to make mutable variables appropriate.
And what this function will scan depends on the second feature.
The special selection algorithm is in this function.And the output is given in this function.
b-) High - Low Selection Algorithm
Outputs the lowest or highest values in the specified new period.
This function allows you to select the most advantageous low or high values, even though the adaptive period remains the same.
And the signals are even more accurate.
This is a comparison of the High-Low selection algorithm and the Function: Stochastic Money Flow Index in the standard period.
For the codes of the Stochastic Money Flow Index function:
Speed may not be clear here.
So let's take a look at on chart.
So I would like to show a comparison values of the standard and special selection algorithms on Standard Highest - Lowest Function (All effort goes to RicardoSantos)
Note: This function is the standard function and freed from integer loads.
Blue = Function Highest - Lowest (length = 10 )
Yellow = Smart High-Low Selection Algorithm (length = 10 )
You can better observe the different results in the same period on the chart.
***
4 layers are interdependent.
And when the inter-layer operations are completed, output is given.
*** - Usage of Autonomous LSTM
Plot Rules
Blue Zones = Crossover condition where the average of long and short lines is less than 50.
Orange Zones = Crossunder condition where long and short lines averages more than 50.
Green Zones = Crossover condition where the average of long and short lines is greater than 50.
Red Zones = Crossunder condition where long and short lines averages less than 50.
*** Autonomous LSTM Settings :
It is just the barcolor to be colored according to the crossover and crossunder conditions or not (I / 0) option.
*** Autonomous LSTM Alerts :
As an alert, it only reports crossover and crossunder status as "Long Signal" and "Short Signal" as a warning after the first bar closure.
*** CONCLUSION :
Autonomous LSTM Designed to be used in any time frame.
Does not repaint in any time frame.
Script is independent of constant coefficients.No period adjustment is necessary.
Each layer transfers the information in its own layer to the next layer and the results are reflected in the Stochastic Money Flow Index function built on the resultant.
Regards.
[BA] Multi Time Frame Moving Averages for BTCThis is a multi time frame moving average script. It includes 7 moving averages. Most of them are SMAs and WMAs but EMA were also used. Time frame was set to 1 day. It means that you can change the time frame of your chart freely without losing your lines. Levels will not change.
I wrote this script just to trade BTC. I prefer daily and weekly charts with this script but lower time frames are also preferable.
Since some of the lengths are too high; older exchanges are recommended due to their relatively deep historical data.
While MA1 is for taking actions like 'take profit' or 'stop loss' or just to follow 'price action' easily, other MAs are for seeing supports and resistances.
MA6 and MA7 are disabled by default in order to minimize the confusion but you can enable them from settings if you need to.
Since some newer exchanges have less historical data, you may not see MA4 and MA5 on the daily chart. In such circumstances MA6 and MA7 might be helpful to use as substitution. Some may like to use all of them.
I am using this script just for BTC but it can be useful for other coins as well.

Multi Timeframe Moving AveragesThis indicator allows you to view a moving average (EMA or SMA) of your choosing on other time frames than what you are currently on.
The reason I wanted to develop this was for use as a filter. Let's say you wanted to make sure the daily time frame was trading above a certain moving average so you could be sure you were playing with the trend. But you wanted to make your entries and exits on a smaller time frame. This Multi-Timeframe Moving Average indicator can then be used to keep an eye on that daily moving average while looking at the shorter term time frames on the same chart.

Adedeji_Oracle_v1.0This indicator was designed to give an easy overview of trends based on Multiple Time-frame Analysis.
It gives a holistic overview of several time-frames all at the same time regardless of the TF being viewed. It works for majority of the most commonly used time-frames (15m, 30m, 45m, 1H, 2H, 3H, 4H, 6H, 12H, 18H, 1D, 2D, 3D and 1W).
Tool is best used in conjunction with my other scripts:
1. Cynotronic Divergence tool () or any other reliable momentum indicator
2. Adedeji_Edge_v1.1
How to use:
Simply add the indicator to your chart, keep an eye on the color flips of the various layers from top to bottom sequence (from red to blue, or blue to red).
1. Fully engulfed layers colored in blue indicate bullish trend is underway at the chosen time-frame.
2. If the prevailing color is red this is indicative that the overall trend is a bearish one.
3. When there is a mix of red and blue, the dominant trend is determined by the color that dominates the lowest levels of the indicator.
It's advised to keep a keen eye on demand and supply zones (draw relevant Support, Resistance as well as dynamic trendl-lines on the charts) as targets and take profit zones. The suggested complimentary divergence tool gives reliable indication of areas where there is strength or weakness.
This tool works pretty well with all trading pairs, all exchanges and in all markets.
Development/improvement is a continuous thing!
Disclaimer:
Past performance does not guarantee future results. This tool/indicator is for educational purposes. As always you should fully understand there are high risks involved when trading cryptocurrencies and other digital instruments.

Adedeji_Edge_v1.0This tool was developed to capture good entries for long and short positions. It utilizes moving averages to find best times to executive trades (long or short) and it overlays same on the chart thus minimizing chart noise i.e. no need for indicators. New traders can use this without any hassle or confusion.
In addition to the long (buy or strong buy) and short (sell or strong sell) overlays, the tool also indicates, with the background colour, areas and periods of potential upside or downside movements.
1. Blue background shows areas most conducive for potentially sustained upside price action;
2. Red background shows areas most conducive for potentially sustained downside price action.
Back-testing:
Results show that the indicator is more profitable than “Buy and Hold” (aka hodl). The back-test period was from the beginning of BTC bear market (17th December 2017) to date (10th Nov. 2019). 10% equity on $1,000 was applied to all back-test trades. Using 100% equity gives even better results.
Control conditions:
- Start date: 17th Dec 2016 (BTC ATH)
- Buy and Hold ROE: about 51% loss
Strategy script condition 1:
- Start date: Same as control date
- TF 4H
- Initial Capital $1,000
- Order size: 10% of equity
- ROE: approx. 131%
Strategy script condition 2:
- Start date: Same as control date
- TF 4H
- Initial Capital $1,000
- Order size 100% of equity
- ROE: approx. 67,000%
How to use:
Simply add the indicator to your chart, WAIT FOR CANDLE with the signal (buy or sell) to CLOSE before you go long or short .
Please note that this version 1.0 is suitable for ONLY 4H and 6H timeframes. Subsequent version(s) will include more TFs.
This tool can be used in isolation, however using it in conjunction with
1. A Moving Average (preferably the 32 EMA) gives users more information about ongoing price-action.
2. Applying trendlines (horizontal and/or dynamic support and resistance) give users better overview of the space and where sudden price bursts or reversals may occur.
Possible scenarios:
a. Buy signals (buy or strong buy) above the EMA is very bullish;
b. Sell signals (sell or strong sell) below the EMA is extremely bearish.
Variant conditions that do not confirm to the above two conditions may occur.
This tool was developed SPECIFICALLY for XBTUSD pair on Bitmex. It may be used for other trading pairs and exchanges although primary back-testing was not extended to other pairs or exchanges.
Development/improvement is a continuous thing!
Disclaimer:
Past performance does not guarantee future results. This tool/indicator is for educational purposes. As always you should fully understand there are high risks involved when trading cryptocurrencies and other digital instruments.
