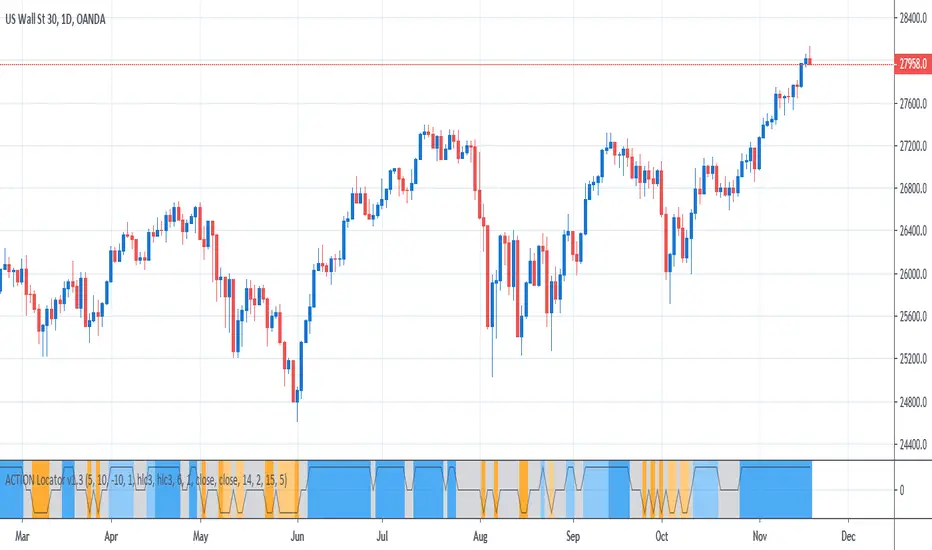
Trend Trading With Moving Averages (by ChartArt)This indicator is measuring if three different moving average calculations (EMA,WMA,SMA) with the same period length are aligned in an uptrend. If this is the case then the bar is colored in green. If only one or two of the three moving averages signals an uptrend then the bar is colored in blue. This can mean that the trend is changing.
Save another $999 bucks with this free indicator.
This is the ChartArt optimized version. Original idea: Steve Primo's Robbery Indicator (PET-D).
coded by UCSgears:
Trend
Market Trend Strength (MTS) (by ChartArt)See the current trend strength of the market. An additional filter makes trend consolidation areas visible. The color changes there each bar back and forth between green and red.
This area was interesting. Would have been a better example:
If the filter is deactivated the indicator shows the last measured price trend (green for up and down for red).
Hi-Lo WorldThis script plots the highs/lows from multiple timeframes onto the same chart to help you spot the prevailing long-term, medium-term and short-term trends .
List of timeframes included:
Year
Month
Week
Day
4 Hour
Hour
You can select which timeframes to plot by editing the inputs on the Format Object dialog.
CapnsSurferThis is a simple RMA Trend that may help you decide for SL or TP. Similar to CapnsBands this uses Donchian Channels.. but remember. Your Trade Your Money
Howto Read Capns Surfer - I will write more later
First of all this is NOT a BUY or SELL indicator. However with this you can define sweet spots for ENTRIES, or TRAILING STOPS and recognize the trend.
Sweetspots
Trend, Stoch, Price Action or in short: TSPCombining the three most important factors that a trader usually needs in a single indicator.
Red = Trend
Blue = Stoch
Orange = Price Action
UCS_TTM_Wave A & B & CThis is a replica of TTM Wave A B C.
The ABC Waves are comprised of various moving averages and oscillators (MACD) used to visualize the overall strength and direction of a given market across multiple time frames.
The “A Wave” measures short term relative strength and direction of a market, the “C Wave” measures longer term strength and the “B Wave” plots the same for a medium time period.
Here is the link to the ACTUAL Indicator - members.simpleroptions.com
Instruction -
Load the Indicator three times, Turn Off the Other two Waves. For eg., Wave A - Check / Wave B - Uncheck / Wave C - Uncheck. = This will plot Wave A.
RSI 100 150 200 MA Ribbon
Following Trends and Finding Divergences
Here is a script example that uses a long length (100, 150, 200) RSI MA Ribbon to detect trend reversals using lower time frames. You can also use traditional RSI to find divergences.
Built Best for 1H to 10 Min Charting
BTCUSD
GRaB Candles w/NotificationsJust added "notifications" to the previous script I found from mattlacoco.
[RS]Temporal Extreme Spliter V0EXPERIMENTAL: this script can be used as a trend follower if bgcolor is active, it can be used to catch extremes and target levels for a pull back to the mean, can be used as support and resistance with the time period open price and extreme. other uses, improvements let me know :p.
Mirrored MACD [LazyBear]This is a famous indicator I have seen used by many Forex traders in MT4 platform. This indicator uses the difference between EMA of "close" and EMA of "open" to form the oscillator lines (not just a convergence/divergence calculation between EMA of "close")
Current market state is determined by which histogram is above zero line. For more confirmation, wait for it to cross above Signal line too. Crossing down the signal or zeroline should be the exit condition. Also, look for divergences.
Use plot labels BullHisto/BearHisto/BearLine/BullLine/ZeroLine/Signal for setting up alerts.
Complete list of my indicators:
-----------------------------
docs.google.com
[RS]Dolchian/Bollinger Hybrid V0EXPERIMENTAL: trend and range analysis using dolchian and bollinger channels methodology merged into one, possibly it can be used to extract 3d depth of market :p
TrendProphetPredicts trend. When the centerline is blue confidence in future trend prediction is high. when red or green matching current prediction trend is medium to low confidence.
[RS]Moving Average Trend Expansion Analysis V0experimental: analyzing the differences between price closure and multiple moving averages to discern movement and direction of market.
upper signal is the long trend, while the lower signal symbolizes faster movements within the trend.
RSI-Stochastic HybridThis is a very simple idea - an average of RSI and the Stochastic Oscillator. However it offers plenty of flexibility for tuning to your requirements. You can change the lengths of either indicator and the weighting of each. By default it's set to 50/50 (just change the percent RSI to adjust). There is also an optional EMA which can be used as a signal line.
This idea comes from Greg Morris who likes to use it for trend following. I would buy when the indicator hits the overbought line and sell when it goes below 50.
Coral Trend Indicator [LazyBear]This is a famous trend indicator in MT4 platform. Is this better than other MA based trend systems? I will let you decide that :)
Supported modes:
- Trend mode: This is the default. Draws a trend line (like MA) and colors them based on the trend.
- Ribbon Mode: Shown at the bottom pane. No trend lines are drawn.
- OverlayMode: Bars are colored based on the current trend. Trend line is also displayed (default color=gray).
Complete list of all my indicators:
docs.google.com
Trend continuation factor, by M.H. PeeTrend continuation factor, by M.H. Pee
The related article is copyrighted material from Stocks & Commodities.
CM EMA Trend BarsThis Code Simply Changes the Bar Colors based on if the Bar is Above or Below the EMA.
Inputs via the Inputs Tab:
Ability to change the EMA Period.
Ability to Turn On/Off the EMA Plotted on the Screen
***Note - I used the HLC/3 To determine if the bar/candle is above or below the EMA. This Filters out the Chop and gets rid of many of the False Breaks above or below the EMA.
Steve Primo's "Robbery" Indicator (PET-D)Here is the Link to youtube video. Its free. www.youtube.com
I did not buy this indicator, I do not have the code. But Most likely this is what's is being calculated.
More Video here - www.protraderstrategies.com
Compare this indicator with his charts shown in the video
Save another $495 bucks.
NOTE:
This is not the actual code for this indicator. This is my perception of the code. Here in these free video There are few examples, you can compare the robbery pet-d with the actual PET-D
www.youtube.com
www.youtube.com
I have to agree, this is not perfect, Out of all the examples, There was one bar that did not match.
TimWest Long Short FiltersTimWest Long Short Filters
Indicator Has 3 Separate Filters that Create Green(Bullish) or Red(Bearish) BackGround Highlights
If Price is Above or Below a certain LookBack Period - Tim Defaults to 63 on Daily Chart to Quickly View if Price is Above or Below it’s Price 1 Quarter Ago.
A Simple Moving Average Filter - Tim Defaults to 50 SMA and 200 SMA also known as the “Golden Cross”.
A Exponential Moving Average Filter - For Those Who Want To View Shorter Term Market Swings. Defaults to 50 EMA and 100 EMA used By Chuck Hughes, 7 Time World Trading Champion. Chuck Claims the 50/100 EMA's Show the Earliest Change in Market Direction the Equal - Sustainable Moves
Inputs Tab has Checkboxes to Turn On/Off any of the 3 Filters Above.
Reference Chart Post www.tradingview.com
Extracting The Trend Strategy The related article is copyrighted material from Stocks & Commodities Mar 2010
You can use in the xPrice any series: Open, High, Low, Close, HL2, HLC3, OHLC4 and ect...
Extracting The Trend The related article is copyrighted material from Stocks & Commodities Mar 2010
You can use in the xPrice any series: Open, High, Low, Close, HL2, HLC3, OHLC4 and ect...