Cycle-Synced Channel Breakout📌 Cycle-Synced Channel Breakout – Detect Breakouts Confirmed by Candles and Momentum Cycles
📖 Overview
The Cycle-Synced Channel Breakout indicator is a precision breakout detection tool that combines the power of:
• Adaptive Keltner Channels
• Dominant Cycle Period Analysis (Ehlers-inspired)
• Candlestick Pattern Recognition (Engulfing)
This multi-layered approach helps identify true breakout opportunities by filtering out noise and false signals, making it ideal for swing traders and intraday traders seeking high-probability directional moves.
⚙️ How It Works
1. Keltner Channel Envelope
A dynamic volatility channel based on the EMA and ATR defines the upper and lower bounds of price movement.
2. Engulfing Candle Detection
The script detects strong bullish and bearish engulfing patterns, which often signal trend reversals or momentum continuations.
3. Dominant Cycle Momentum (Ehlers-inspired)
Using a smoothed power oscillator derived from a detrended price series, the indicator assesses whether momentum is accelerating during the breakout — filtering out weak moves.
4. Signal Confirmation Logic
A signal is only shown when:
• An engulfing pattern is detected, and
• Price breaks out of the Keltner Channel, and
• Momentum (cycle power) is rising
5. Visual Feedback
• Breakout signals are plotted with “BUY” or “SELL” labels
• Faded green/red background highlights confirmed breakouts
• Optional display of engulfing candles with triangle markers
⸻
🛠️ Key Features
• ✅ Adaptive Keltner Channels
• ✅ Bullish/Bearish Engulfing Candle Recognition
• ✅ Ehlers-style Cycle Momentum Confirmation
• ✅ Background highlights for confirmed breakouts
• ✅ Optional candle pattern visualization
• ✅ Lightweight and Pine v6 compatible
⸻
🧪 Inputs
• Keltner Length – EMA period for channel basis
• Multiplier – Multiplied with ATR to determine band width
• Cycle Lookback – Used to calculate smoothed cycle power
• Show Engulfing Candles? – Toggles candlestick signals
• Show Breakout Signals? – Toggles breakout labels and backgrounds
⸻
🧠 How to Use
• Look for “BUY” or “SELL” labels when:
• An engulfing candle breaks through the Keltner Channel
• Cycle momentum confirms strength behind the move
• The background color will faintly highlight the breakout direction.
• Use in combination with other trend or volume indicators for added confluence.
🔒 Notes
• This indicator is not repainting.
• It is designed for educational and research purposes only.
• Works across all timeframes and asset classes (stocks, crypto, forex, etc.)
波动率

10MAs + BB10 MAs riboon + Bollinger Bands
I used two basic Multiple MA ribbons. so I just merge them to one indicaotor

EMA Separation (LFZ Scalps) v6 — Early TriggerPlots the percentage distance between a fast and a slow EMA (default 9 & 21) to gauge trend strength and filter out choppy London Flow Zone breakouts.
• Gray – EMAs nearly flat (low momentum, avoid trades)
• Orange – early trend building
• Green/Red – strong directional momentum
Useful for day-traders: wait for the gap to widen beyond your chosen threshold (e.g., 0.25 %) before entering a breakout. Adjustable EMA lengths and alert when the separation exceeds your “strong trend” level.

MYM Edge Booster MYM Long Trading Assistant - ATR-Based Edge Booster
Clean, simple indicator that tells you when MYM long setups meet high-probability criteria. No complicated charts - just clear numbers and signals.
• ATR Targets & Stops (whole numbers)
• Quality Score (0-3 stars)
• Green Circle when conditions perfect
• Warnings for choppy/high volatility
• ES/NQ sector confirmation
Eliminates guesswork. Trade when the green circle appears.

Average True Range TrackerThis indicator calculates the daily ATR of the past 14 days. The ATR% indicates the range completed for the day. The ATR indicates the average daily range. The 20% ATR indicates the value of 20% of the daily ATR for retracement purposes.
Daily ATR TrackerThis indicator calculates the daily ATR of the past 14 days. The ATR% indicates the range completed for the day. The ATR indicates the average daily range. The 20% ATR indicates the value of 20% of the daily ATR for retracement purposes.
MACD (The Moving Average Convergence Divergence)The Moving Average Convergence Divergence (MACD) is a momentum indicator used in technical analysis to identify trends, measure their strength, and signal potential reversals. It is calculated by subtracting the 26-period Exponential Moving Average (EMA) from the 12-period EMA, creating the MACD line. A 9-period EMA of the MACD line, known as the signal line, is then plotted to generate buy or sell signals. Positive MACD values suggest upward momentum, while negative values indicate downward momentum. Traders often watch for crossovers, divergences, and movements relative to the zero line to make informed decisions.

BOCS AdaptiveBOCS Adaptive Strategy - Automated Volatility Breakout System
WHAT THIS STRATEGY DOES:
This is an automated trading strategy that detects consolidation patterns through volatility analysis and executes trades when price breaks out of these channels. Take-profit and stop-loss levels are calculated dynamically using Average True Range (ATR) to adapt to current market volatility. The strategy closes positions partially at the first profit target and exits the remainder at the second target or stop loss.
TECHNICAL METHODOLOGY:
Price Normalization Process:
The strategy begins by normalizing price to create a consistent measurement scale. It calculates the highest high and lowest low over a user-defined lookback period (default 100 bars). The current close price is then normalized using the formula: (close - lowest_low) / (highest_high - lowest_low). This produces values between 0 and 1, allowing volatility analysis to work consistently across different instruments and price levels.
Volatility Detection:
A 14-period standard deviation is applied to the normalized price series. Standard deviation measures how much prices deviate from their average - higher values indicate volatility expansion, lower values indicate consolidation. The strategy uses ta.highestbars() and ta.lowestbars() functions to track when volatility reaches peaks and troughs over the detection length period (default 14 bars).
Channel Formation Logic:
When volatility crosses from a high level to a low level, this signals the beginning of a consolidation phase. The strategy records this moment using ta.crossover(upper, lower) and begins tracking the highest and lowest prices during the consolidation. These become the channel boundaries. The duration between the crossover and current bar must exceed 10 bars minimum to avoid false channels from brief volatility spikes. Channels are drawn using box objects with the recorded high/low boundaries.
Breakout Signal Generation:
Two detection modes are available:
Strong Closes Mode (default): Breakout occurs when the candle body midpoint math.avg(close, open) exceeds the channel boundary. This filters out wick-only breaks.
Any Touch Mode: Breakout occurs when the close price exceeds the boundary.
When price closes above the upper channel boundary, a bullish breakout signal generates. When price closes below the lower boundary, a bearish breakout signal generates. The channel is then removed from the chart.
ATR-Based Risk Management:
The strategy uses request.security() to fetch ATR values from a specified timeframe, which can differ from the chart timeframe. For example, on a 5-minute chart, you can use 1-minute ATR for more responsive calculations. The ATR is calculated using ta.atr(length) with a user-defined period (default 14).
Exit levels are calculated at the moment of breakout:
Long Entry Price = Upper channel boundary
Long TP1 = Entry + (ATR × TP1 Multiplier)
Long TP2 = Entry + (ATR × TP2 Multiplier)
Long SL = Entry - (ATR × SL Multiplier)
For short trades, the calculation inverts:
Short Entry Price = Lower channel boundary
Short TP1 = Entry - (ATR × TP1 Multiplier)
Short TP2 = Entry - (ATR × TP2 Multiplier)
Short SL = Entry + (ATR × SL Multiplier)
Trade Execution Logic:
When a breakout occurs, the strategy checks if trading hours filter is satisfied (if enabled) and if position size equals zero (no existing position). If volume confirmation is enabled, it also verifies that current volume exceeds 1.2 times the 20-period simple moving average.
If all conditions are met:
strategy.entry() opens a position using the user-defined number of contracts
strategy.exit() immediately places a stop loss order
The code monitors price against TP1 and TP2 levels on each bar
When price reaches TP1, strategy.close() closes the specified number of contracts (e.g., if you enter with 3 contracts and set TP1 close to 1, it closes 1 contract). When price reaches TP2, it closes all remaining contracts. If stop loss is hit first, the entire position exits via the strategy.exit() order.
Volume Analysis System:
The strategy uses ta.requestUpAndDownVolume(timeframe) to fetch up volume, down volume, and volume delta from a specified timeframe. Three display modes are available:
Volume Mode: Shows total volume as bars scaled relative to the 20-period average
Comparison Mode: Shows up volume and down volume as separate bars above/below the channel midline
Delta Mode: Shows net volume delta (up volume - down volume) as bars, positive values above midline, negative below
The volume confirmation logic compares breakout bar volume to the 20-period SMA. If volume ÷ average > 1.2, the breakout is classified as "confirmed." When volume confirmation is enabled in settings, only confirmed breakouts generate trades.
INPUT PARAMETERS:
Strategy Settings:
Number of Contracts: Fixed quantity to trade per signal (1-1000)
Require Volume Confirmation: Toggle to only trade signals with volume >120% of average
TP1 Close Contracts: Exact number of contracts to close at first target (1-1000)
Use Trading Hours Filter: Toggle to restrict trading to specified session
Trading Hours: Session input in HHMM-HHMM format (e.g., "0930-1600")
Main Settings:
Normalization Length: Lookback bars for high/low calculation (1-500, default 100)
Box Detection Length: Period for volatility peak/trough detection (1-100, default 14)
Strong Closes Only: Toggle between body midpoint vs close price for breakout detection
Nested Channels: Allow multiple overlapping channels vs single channel at a time
ATR TP/SL Settings:
ATR Timeframe: Source timeframe for ATR calculation (1, 5, 15, 60, etc.)
ATR Length: Smoothing period for ATR (1-100, default 14)
Take Profit 1 Multiplier: Distance from entry as multiple of ATR (0.1-10.0, default 2.0)
Take Profit 2 Multiplier: Distance from entry as multiple of ATR (0.1-10.0, default 3.0)
Stop Loss Multiplier: Distance from entry as multiple of ATR (0.1-10.0, default 1.0)
Enable Take Profit 2: Toggle second profit target on/off
VISUAL INDICATORS:
Channel boxes with semi-transparent fill showing consolidation zones
Green/red colored zones at channel boundaries indicating breakout areas
Volume bars displayed within channels using selected mode
TP/SL lines with labels showing both price level and distance in points
Entry signals marked with up/down triangles at breakout price
Strategy status table showing position, contracts, P&L, ATR values, and volume confirmation status
HOW TO USE:
For 2-Minute Scalping:
Set ATR Timeframe to "1" (1-minute), ATR Length to 12, TP1 Multiplier to 2.0, TP2 Multiplier to 3.0, SL Multiplier to 1.5. Enable volume confirmation and strong closes only. Use trading hours filter to avoid low-volume periods.
For 5-15 Minute Day Trading:
Set ATR Timeframe to match chart or use 5-minute, ATR Length to 14, TP1 Multiplier to 2.0, TP2 Multiplier to 3.5, SL Multiplier to 1.2. Volume confirmation recommended but optional.
For Hourly+ Swing Trading:
Set ATR Timeframe to 15-30 minute, ATR Length to 14-21, TP1 Multiplier to 2.5, TP2 Multiplier to 4.0, SL Multiplier to 1.5. Volume confirmation optional, nested channels can be enabled for multiple setups.
BACKTEST CONSIDERATIONS:
Strategy performs best during trending or volatility expansion phases
Consolidation-heavy or choppy markets produce more false signals
Shorter timeframes require wider stop loss multipliers due to noise
Commission and slippage significantly impact performance on sub-5-minute charts
Volume confirmation generally improves win rate but reduces trade frequency
ATR multipliers should be optimized for specific instrument characteristics
COMPATIBLE MARKETS:
Works on any instrument with price and volume data including forex pairs, stock indices, individual stocks, cryptocurrency, commodities, and futures contracts. Requires TradingView data feed that includes volume for volume confirmation features to function.
KNOWN LIMITATIONS:
Stop losses execute via strategy.exit() and may not fill at exact levels during gaps or extreme volatility
request.security() on lower timeframes requires higher-tier TradingView subscription
False breakouts inherent to breakout strategies cannot be completely eliminated
Performance varies significantly based on market regime (trending vs ranging)
Partial closing logic requires sufficient position size relative to TP1 close contracts setting
RISK DISCLOSURE:
Trading involves substantial risk of loss. Past performance of this or any strategy does not guarantee future results. This strategy is provided for educational purposes and automated backtesting. Thoroughly test on historical data and paper trade before risking real capital. Market conditions change and strategies that worked historically may fail in the future. Use appropriate position sizing and never risk more than you can afford to lose. Consider consulting a licensed financial advisor before making trading decisions.
ACKNOWLEDGMENT & CREDITS:
This strategy is built upon the channel detection methodology created by AlgoAlpha in the "Smart Money Breakout Channels" indicator. Full credit and appreciation to AlgoAlpha for pioneering the normalized volatility approach to identifying consolidation patterns and sharing this innovative technique with the TradingView community. The enhancements added to the original concept include automated trade execution, multi-timeframe ATR-based risk management, partial position closing by contract count, volume confirmation filtering, and real-time position monitoring.

RSI(7) + MACD ZoneTitle: RSI(7) + MACD Zone Combo
Description:
This indicator combines RSI (7) and MACD (12,26,9) into a single panel with a unified scale for easier analysis.
RSI (7) is plotted in white and automatically turns red when the market reaches overbought (>70) or oversold (<30) conditions.
MACD is normalized to align with the RSI scale (0–100).
A value of 50 represents MACD = 0.
Above 50 (teal) indicates positive momentum.
Below 50 (red) indicates negative momentum.
This combination allows traders to quickly identify when short-term RSI conditions align with overall momentum shifts from MACD.
How to use:
Look for potential buy opportunities when RSI is oversold (<30) and MACD is above 50 (positive momentum).
Look for potential sell opportunities when RSI is overbought (>70) and MACD is below 50 (negative momentum).
Use in conjunction with price action and risk management — not as a standalone signal.

ATR Enhanced [DCAUT]█ ATR Enhanced
📊 OVERVIEW
Standard ATR uses only RMA smoothing, while ATR Enhanced provides 20+ professional smoothing algorithms , offering precise volatility measurement solutions for different trading scenarios and market environments.
💡 CORE VALUE
- 20+ algorithm choices : SMA, EMA, RMA, WMA, HMA, T3, KAMA, FRAMA, Kalman Filter, etc.
📋 PARAMETER SETUP
ATR Length : Calculation period (default: 14)
Moving Average Type : Choose the most suitable smoothing method from 20+ algorithms
🎨 COLOR CODING
Green : Rising volatility
Red : Falling volatility

Morning Peak FadeMorning Peak Fade is an intraday analysis tool that identifies and measures the probability of early session rallies turning into sharp pullbacks.
📊 Core Idea
• Many stocks surge after the open, reaching an intraday peak before fading lower.
• This script anchors at the first significant morning high and tracks the drawdowns that follow within a customizable time window.
• It provides:
• Probability of a fade after the peak
• Average and maximum drawdown statistics
• Event-day hit rate (how often such setups occur)
🎯 Use Cases
• Spot potential “fade setups” where early enthusiasm exhausts quickly.
• Quantify how often chasing the morning high turns into a losing trade.
• Backtest opening range failure or fade strategies with hard data.
⚙️ Features
• Customizable thresholds for the initial surge (relative to prior close).
• Marks the peak (max) and subsequent low (min) used in calculations.
• Draws a reference line at the surge threshold to visualize when the fade triggers.
• Outputs summary stats directly on the chart.

Premarket Power MovePremarket Power Move is an intraday research tool that tracks what happens after strong premarket or opening gaps.
📊 Core Idea
• When a stock opens +X% above the prior close, it often attracts momentum traders.
• This script measures whether the stock continues to follow through higher or instead fades back down within the first trading hour.
• It calculates:
• The probability of a post-gap rally vs. a drawdown
• Average and maximum retracements after the surge
• Event-day hit rate (how many days actually triggered the condition)
🎯 Use Cases
• Identify “gap-and-go” opportunities where strong premarket strength leads to further gains.
• Spot potential fade setups where early enthusiasm quickly reverses.
• Backtest your intraday strategies with objective statistics instead of gut feeling.
⚙️ Features
• Customizable thresholds for premarket/open surge (%) and follow-through window (minutes).
• Marks the chart with reference lines:
• Prior close
• Surge threshold (e.g. +6%)
• Intraday high/low used for probability calculations.
• Outputs summary statistics (probabilities, averages, counts) directly on the chart.
🔔 Note
This is not a buy/sell signal generator. It is a probability and behavior analysis tool that helps traders understand how often strong premarket gaps continue vs. fade.

BB Crosses Optimized - [JTCAPITAL]BB Crosses Optimized - is a modified way to use Bollinger Bands combined with volatility filtering (ATR) and flexible smoothing methods for Trend-Following.
The indicator works by calculating in the following steps:
Source Selection & Smoothing
The script begins by letting the user select a preferred price source (default is Close, but options include Open, High, Low, HL2, etc.). This raw input is then passed through a smoothing process.
Multiple smoothing techniques can be chosen: SMA, EMA, HMA, DEMA, TEMA, RMA, and FRAMA. Each method reduces short-term noise differently, ensuring flexibility for traders who prefer faster or slower reaction speeds in trend detection.
Bollinger Band Construction
Once the smoothed source is prepared, Bollinger Bands are calculated. The middle band is a moving average of the smoothed data over the defined BB Period . The upper and lower bands are then generated by adding and subtracting the Standard Deviation × Deviation multiplier . These dynamic bands capture volatility and help define breakout zones.
ATR Volatility Measurement
Parallel to the band calculation, the Average True Range (ATR) is computed over the chosen ATR Period . This measures market volatility. The ATR can optionally act as a filter, refining buy and sell levels so signals adapt to current market conditions rather than being fixed to price alone.
Bollinger Band Signals
-If the smoothed price closes above the upper band, a potential bullish event is marked.
-If the smoothed price closes below the lower band, a potential bearish event is marked.
Trend Line Construction
When a bullish event occurs, the script anchors a trend-following line beneath price. If ATR filtering is enabled, the line is set at Low – ATR , otherwise at the simple Low. Conversely, when a bearish event occurs, the line is anchored above price at High + ATR (or just High without the filter). The line is designed to only move in the direction of the trend—if price action does not exceed the prior value, the previous level is held. This prevents unnecessary whipsaws and keeps the indicator aligned with dominant momentum.
Final Trend Detection
The slope of the trend line defines the trend itself:
-Rising line → bullish trend.
-Falling line → bearish trend.
Visual Output
The indicator plots the trend line with dynamic coloring: Blue for bullish phases, Purple for bearish phases. A subtle filled background area emphasizes the active trend zone for clearer chart interpretation.
Buy and Sell Conditions:
- Buy Signal : Triggered when smoothed price closes above the upper Bollinger Band. Trend line then anchors below price (with or without ATR offset depending on settings).
- Sell Signal : Triggered when smoothed price closes below the lower Bollinger Band. Trend line then anchors above price (with or without ATR offset).
Additional filtering is possible via:
- ATR Toggle : Switch ATR on or off to adapt the strategy to either volatile or steady markets.
- Smoothing Method : Adjust smoothing to speed up or slow down responsiveness.
- Deviation Multiplier : Tight or wide bands adjust the sensitivity of signals.
Features and Parameters:
- Source : Choose between Close, Open, High, Low, HL2, etc.
- Average Type : Options include SMA, EMA, HMA, DEMA, TEMA, RMA, FRAMA.
- ATR Period : Defines how ATR volatility is measured.
- BB Period : Lookback length for Bollinger Band construction.
- Deviation : Multiplier for the standard deviation in Bollinger Bands.
- Smoothing Period : Controls how much the source data is smoothed.
- ATR Filter On/Off : Enables or disables ATR integration in signal calculation.
Specifications:
Smoothing (MA Types)
Smoothing is essential to reduce chart noise. By offering multiple MA choices, traders can balance between lag (SMA, RMA) and responsiveness (EMA, HMA, FRAMA). This flexibility allows the indicator to adapt across asset classes and trading styles.
Bollinger Bands
Bollinger Bands measure price deviation around a moving average. They help identify volatility expansion and contraction. In this script, the bands serve as breakout triggers—price crossing outside suggests momentum strong enough to sustain a trend.
Standard Deviation
Standard Deviation is a statistical measure that quantifies the dispersion of price data around the mean. With a multiplier applied, it creates bands that contain a probabilistic portion of price action. Crossing beyond these suggests a higher likelihood of trend continuation.
ATR (Average True Range)
ATR measures the degree of volatility. Instead of simply reacting to price crossing the bands, ATR ensures the trend line placement adapts to current conditions. In volatile markets, wider buffers prevent premature signals; in calmer markets, tighter placement keeps signals responsive.
Trend Line Logic
The trend line only adjusts in the direction of the trend. If new values do not exceed the prior, the line remains unchanged. This prevents false reversals and makes the line a reliable visual confirmation of trend direction.
Signal Detection
The indicator does not repaint: signals are based on confirmed closes relative to the Bollinger Bands. This makes it more reliable for both live trading and backtesting scenarios.
Visual Enhancements
The use of dual plots and fill shading creates a clearer separation of bullish vs. bearish phases. This helps traders visually align entries and exits without second-guessing.
Enjoy!

⚪ Liquidity Spike Marker
Description:
The Liquidity Spike Marker indicator helps to identify abnormal bursts of liquidity in the market. The logic is based on comparing the product of the volume by the minimum candle price (Volume × Low) with the threshold value set by the user.
When the value exceeds the threshold, a white triangle appears under the candle, indicating a possible influx of liquidity. This can help traders pay attention to the key points where large participants may enter the market.
Features:
Displays a placemark (⚪ white triangle) when the threshold is exceeded.
Configurable parameter Volume × Low Threshold.
The ability to set an alert for automatic notification.
A lightweight and minimalistic tool without unnecessary elements.
Note: The indicator is not a trading recommendation. Use it in combination with your own trading system and other analysis methods.

Market Pressure Oscillator█ OVERVIEW
The Market Pressure Oscillator is an advanced technical indicator for TradingView, enabling traders to identify potential trend reversals and momentum shifts through candle-based pressure analysis and divergence detection. It combines a smoothed oscillator with moving average signals, overbought/oversold levels, and divergence visualization, enhanced by customizable gradients, dynamic band colors, and alerts for quick decision-making.
█ CONCEPT
The indicator measures buying or selling pressure based on candle body size (open-to-close difference) and direction, with optional smoothing for clarity and divergence detection between price action and the oscillator. It relies solely on candle data, offering insights into trend strength, overbought/oversold conditions, and potential reversals with a customizable visual presentation.
█ WHY USE IT?
- Divergence Detection: Identifies bullish and bearish divergences to reinforce signals, especially near overbought/oversold zones.
- Candle Pressure Analysis: Measures pressure based on candle body size, normalized to a ±100 scale.
- Signal Generation: Provides buy/sell signals via overbought/oversold crossovers, zero-line crossovers, moving average zero-line crossovers, and dynamic band color changes.
- Visual Clarity: Uses dynamic colors, gradients, and fill layers for intuitive chart analysis.
Flexibility: Extensive settings allow customization to individual trading preferences.
█ HOW IT WORKS?
- Candle Pressure Calculation: Computes candle body size as math.abs(close - open), normalized against the average body size over a lookback period (avgBody = ta.sma(body, len)). - Candle direction (bullish: +1, bearish: -1, neutral: 0) is multiplied by body weight to derive pressure.
- Cumulative Pressure: Sums pressure values over the lookback period (Lookback Length) and normalizes to ±100 relative to the maximum possible value.
- Smoothing: Optionally applies EMA (Smoothing Length) to normalized pressure.
- Moving Average: Calculates SMA (Moving Average Length) for trend confirmation (Moving Average (SMA)).
- Divergence Detection: Identifies bullish/bearish divergences by comparing price and oscillator pivot highs/lows within a specified range (Pivot Length). Divergence signals appear with a delay equal to the Pivot Length.
- Signals: Generates signals for:
Crossing oversold upward (buy) or overbought downward (sell).
Crossing the zero line by the oscillator or moving average (buy/sell).
Bullish/bearish divergences, marked with labels, enhancing signals, especially near overbought/oversold zones.
Dynamic band color changes when the moving average crosses MA overbought/oversold thresholds (green for oversold, red for overbought).
- Visualization: Plots the oscillator and moving average with dynamic colors, gradient fills, transparent bands, and labels, with customizable overbought/oversold levels.
Alerts: Built-in alerts for divergences, overbought/oversold crossovers, and zero-line crossovers (oscillator and moving average).
█ SETTINGS AND CUSTOMIZATION
- Lookback Length: Period for aggregating candle pressure (default: 14).
- Smoothing Length (EMA): EMA length for smoothing the oscillator (default: 1). Higher values smooth the signal but may reduce signal frequency; adjust overbought/oversold levels accordingly.
- Moving Average Length (SMA): SMA length for the moving average (default: 14, minval=1). Higher values make SMA a trend indicator, requiring adjusted MA overbought/oversold levels.
- Pivot Length (Left/Right): Candles for detecting pivot highs/lows in divergence calculations (default: 2, minval=1). Higher values reduce noise but add delay equal to the set value.
- Enable Divergence Detection: Enables divergence detection (default: true).
- Overbought/Oversold Levels: Thresholds for the oscillator (default: 30/-30) and moving average (default: 10/-10). For the moving average, no arrows appear; bands change color from gray to green (oversold) or red (overbought), reinforcing entry signals.
- Signal Type: Select signals to display: "None", "Overbought/Oversold", "Zero Line", "MA Zero Line", "All" (default: "Overbought/Oversold").
- Colors and Gradients: Customize colors for bullish/bearish oscillator, moving average, zero line, overbought/oversold levels, and divergence labels.
- Transparency: Adjust gradient fill transparency (default: 70, minval=0, maxval=100) and band/label transparency (default: 40, minval=0, maxval=100) for consistent visuals.
- Visualizations: Enable/disable moving average, gradients for zero/overbought/oversold levels, and gradient fills.
█ USAGE EXAMPLES
- Momentum Analysis: Observe the MPO Oscillator above 0 for bullish momentum or below 0 for bearish momentum. The SMA, being smoother, reacts slower and can confirm trend direction as a noise filter.
- Reversal Signals: Look for buy triangles when the oscillator crosses oversold upward, especially when the SMA is below the MA oversold threshold and the band turns green. Similarly, seek sell triangles when crossing overbought downward, with the SMA above the MA overbought threshold and the band turning red.
- Using Divergences: Treat bullish (green labels) and bearish (red labels) divergences as reinforcement for other signals, especially near overbought/oversold zones, indicating stronger potential trend reversals.
- Customization: Adjust lookback length, smoothing, and moving average length to specific instruments and timeframes to minimize false signals.
█ USER NOTES
Combine the indicator with tools like Fibonacci levels or pivot points to enhance accuracy.
Test different settings for lookback length, smoothing, and moving average length on your chosen instrument and timeframe to find optimal values.

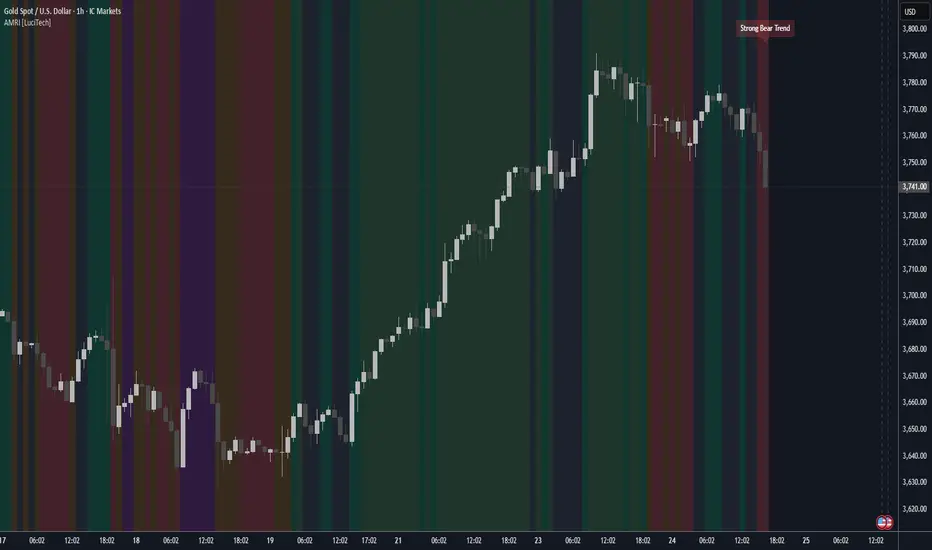
Adaptive Market Regime Identifier [LuciTech]What it Does:
AMRI visually identifies and categorizes the market into six primary regimes directly on your chart using a color-coded background. These regimes are:
-Strong Bull Trend: Characterized by robust upward momentum and low volatility.
-Weak Bull Trend: Indicates upward momentum with less conviction or higher volatility.
-Strong Bear Trend: Defined by powerful downward momentum and low volatility.
-Weak Bear Trend: Suggests downward momentum with less force or increased volatility.
-Consolidation: Periods of low volatility and sideways price action.
-Volatile Chop: High volatility without clear directional bias, often seen during transitions or indecision.
By clearly delineating these states, AMRI helps traders quickly grasp the overarching market context, enabling them to apply strategies best suited for the current conditions (e.g., trend-following in strong trends, range-bound strategies in consolidation, or caution in volatile chop).
How it Works (The Adaptive Edge)
AMRI achieves its adaptive classification by continuously analyzing three core market dimensions, with each component dynamically adjusting to current market conditions:
1.Adaptive Moving Average (KAMA): The indicator utilizes the Kaufman Adaptive Moving Average (KAMA) to gauge trend direction and strength. KAMA is unique because it adjusts its smoothing period based on market efficiency (noise vs. direction). In trending markets, it becomes more responsive, while in choppy markets, it smooths out noise, providing a more reliable trend signal than static moving averages.
2.Adaptive Average True Range (ATR): Volatility is measured using an adaptive version of the Average True Range. Similar to KAMA, this ATR dynamically adjusts its sensitivity to reflect real-time changes in market volatility. This helps AMRI differentiate between calm, ranging markets and highly volatile, directional moves or chaotic periods.
3.Normalized Slope Analysis: The slope of the KAMA is normalized against the Adaptive ATR. This normalization provides a robust measure of trend strength that is relative to the current market volatility, making the thresholds for strong and weak trends more meaningful across different instruments and timeframes.
These adaptive components work in concert to provide a nuanced and responsive classification of the market regime, minimizing lag and reducing false signals often associated with fixed-parameter indicators.
Key Features & Originality:
-Dynamic Regime Classification: AMRI stands out by not just indicating trend or range, but by classifying the type of market regime, offering a higher-level analytical framework. This is a meta-indicator that provides context for all other trading tools.
-Adaptive Core Metrics: The use of KAMA and an Adaptive ATR ensures that the indicator remains relevant and responsive across diverse market conditions, automatically adjusting to changes in volatility and trend efficiency. This self-adjusting nature is a significant advantage over indicators with static lookback periods.
-Visual Clarity: The color-coded background provides an immediate, at-a-glance understanding of the current market regime, reducing cognitive load and allowing for quicker decision-making.
-Contextual Trading: By identifying the prevailing regime, AMRI empowers traders to select and apply strategies that are most effective for that specific environment, helping to avoid costly mistakes of using a trend-following strategy in a ranging market, or vice-versa.
-Originality: While components like KAMA and ATR are known, their adaptive integration into a comprehensive, multi-regime classification system, combined with normalized slope analysis for trend strength, offers a novel approach to market analysis not commonly found in publicly available indicators.