BE_VolumeAnalysis_ProTraders rely on volume as a key metric because it lets them know the liquidity level of an asset. If enough volumes are supplied (Buy | Sell) definitely prices respect the supplied volume.
However, the word “Supplied” is here indicated as “Pressure”. If there is enough Buying pressure then sellers will be kicked out easy and vis-versa.
Index traders normally refers to future contract volumes and hence we have provided an option to refer the volumes from the near expiry contracts.
Mathematical calculation is involved in this study to arrive at the Appx volume for the options such as Volume Splitter. If pressure is seen from buyer side, then volumes will be shown for buyers more and similarly for sellers. Each candle will have both buyers’ volume vs Seller Volume.
Similar study have be made along with some averages to arrive at the buying | Selling pressure for the Options “Volume Pressure & Vol Pres 2”. If price has to move up buying volumes should get pumped in and for prices to fall down selling volumes should be pumped in to the market. Quantum of pressure is being calculated accordingly and shown as the areas for option “Volume Pressure” and Candles for option “Vol Pres 2”.
Also we have shown some additional built in indicators like OBV and Price Volume Trend along with faith plots to show the traders extra information about the volumes to take some wise trades.
Note: Study involves more of price action calculations (mathematical calculations only).
Volumeanalysis
Realtime Volume Stats Panel w Delta, Buy/Sell%, Cumulative DeltaWhat is it?
Displays several realtime volume stats for each bar/candle.
Although it was originally created to be an assist tool for the Market Footprint (available as a separate indicator) to consolidate the numbers into a neat panel below, it can be used independently as an Orderflow Analysis tool as well.
It currently displays the following:
(1) Net Delta Volume for the bar; (2) Total Volume for the bar; (3) Cumulative Delta Volume for bars plotted up till this point (i.e., from the time the tool started collecting realtime data);
(4) Buy Volume for the bar as a percentage of the total volume for the bar; and, (5) Sell Volume for the bar as a percentage of the total volume for the bar.
All labels/colors etc. are configurable to suit your aesthetics.
All data are ONLY AVAILABLE FOR REAL-TIME BARS. The longer you keep a chart open with the study enabled, the more data it collects and displays, and the better your analysis can potentially be.
Note that the data gets reset every time (a) any of the options is changed, (b) the market is switched, (c) the browser is refreshed, or (d) the script is reloaded
DATA ISN'T STORED. I.e., every time a new symbol is loaded, the previous symbol's data is lost. So if you intend to monitor a symbol closely, you would need to keep it loaded all the time (and without tinkering with any of the Settings).
Who is it for?
For ultra short term traders who are used to looking at short term auction orderflow (and price action) to catch buy/sell anomalies and accurate trade entries
For traders who are already using Market Footprint but want the volume stats to be displayed on the bottom pane making for a cleaner interface.
For traders (, irrespective of their method of trading,) who wish to understand what is happening under the hood when a certain price action unfolds. (Who is in control, who got trapped, what does liquidity or the lack thereof look like, etc.)

Realtime Volume Bars w Market Buy/Sell/Neutral split & Mkt Delta
What is it?
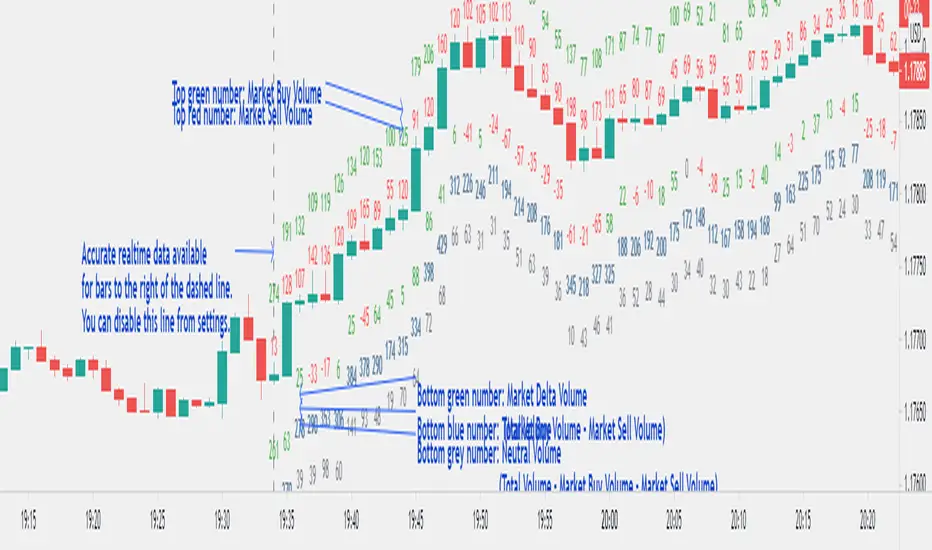
A tool that shows Real-time Volume bars split into 3 components: (1) Market Buy Volume - i.e., the volume that got transacted on upticks; (2) Market Sell Volume - i.e., the volume that got transacted on downticks;
and, (3) Neutral Volume - i.e., the volume that got transacted without a change in price. (This feature can be turned off if you want normal volume bars).
Market delta (i.e., Market Buy Volume - Market Sell Volume) is also displayed above each volume bar. (On by default; can be switched off from Settings)
The split and Market Delta data are ONLY AVAILABLE FOR REAL-TIME BARS. Historical bars are shown just like regular ones. The dotted line marks the start of real-time data (i.e., the bar from which the indicator started collecting and displaying data). You will see accurate data for bars to the right of this line. The longer you keep a chart open with the study enabled, the more data it collects and displays, and the better your analysis can potentially be.
Note that the data gets reset every time any of the options is changed, the market is switched, the browser is refreshed, or the script is reloaded
DATA ISN'T STORED. I.e., every time a new symbol is loaded, the previous symbol's data is lost. So if you intend to monitor a symbol, you would need to keep it loaded all the time.
Who is it for?
For traders who are used to analyzing buy/sell activity using market buy/sell volume and market delta information
Although you can use this independently as well, use it in conjunction with "Market Delta Volume for Realtime Bars" indicator to get a better visual representation of the numbers.

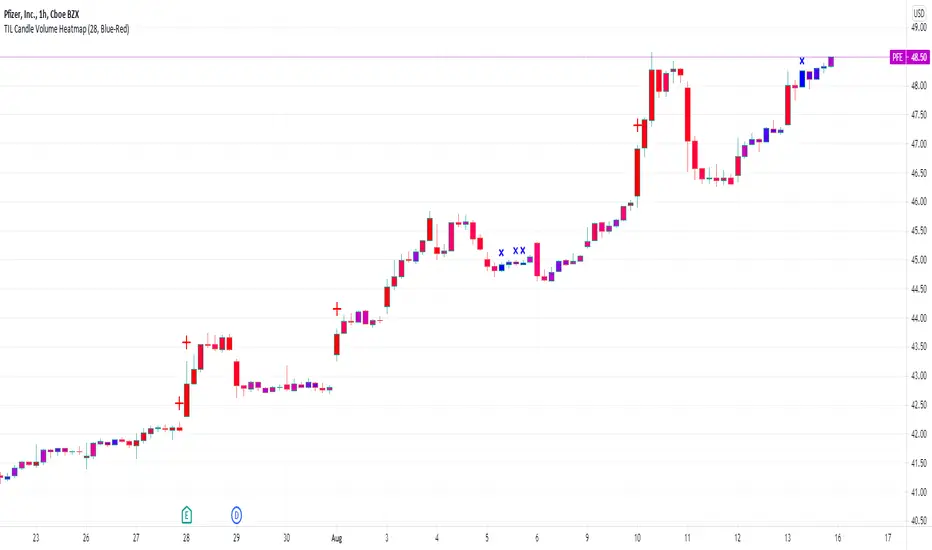
TIL Candle Volume HeatmapTrading Indicator Lab’s Candle Volume Heatmap for TradingView merges volume with price by applying gradient colors in the bars. It can also detect bars that have the most volume and the least volume.
Gradient Coloring
When applied to a chart, the Candle Volume Heatmap indicator applies colors to each bar which may vary according to its number of volume. The chart becomes a heatmap where you can easily spot which parts of the chart that are “hottest” or the bars that had the greatest number of volume and the “coldest” or ones that had the least volume. The indicator uses colors that transitions from BLUE to RED where shades closer to blue are “cold” (low volume) and those that are more in the shade of red are considered “hot” (high volume).
- Blue candlesticks – has low volume
- Red candlesticks – has high volume
High and Low Volume Bars
In addition to bar color changes, the Candle Volume Heatmap indicator also marks bars that have the lowest and highest volume within a certain length. Low and high-volume bars are marked as follows.
- – Low volume bars are marked with a small cross above them signifying a very low volume. Please note that this symbol always appears in new bars which are only starting to accumulate volume.
- – High volume bars are marked with a large plus sign above them signifying a very high volume. These bars along with other red-colored bars are the ones that should be monitored most.
Uses
Identifying low and high-volume bars can be useful in determining whether there is weight or “force” behind the price action that occurs in each bar. High volume bars can be used to validate candlestick reversal patterns and confirm breakouts in support and resistance levels.
Available Alert Conditions
- High Volume – triggers when a high-volume bar (marked with a plus sign) is detected
- Low Volume – triggers when a low-volume bar (marked with a cross sign) is detected
Inputs
- Length – sets the number of bars the indicator analyzes at each execution.
- Color Gradient – sets the color set for applying the heatmap on the chart candlesticks. Choices available are Blue-Red (good for light mode) and Yellow-Red (good for dark mode). Red color always signifies the highest concentration of volume.
- Apply Heatmap Colors – applies the color gradient on the chart candlesticks to indicate the amount of volume in each one
- Display Markers Below – moves the position of the high volume (plus) and low volume (cross) markers below the candlestick
Market Delta Volume for Realtime BarsWhat is it?
Market Delta Volume Tool for real-time bars
A market delta tool that shows, (1) the volume that got transacted on upticks - or the market buy volume; (2) the volume that got transacted on downticks - or the market sell volume (3) the market delta volume (i.e., market buy volume - market sell volume); (4) the total volume (market buy volume + market sell volume + neutral volume); and (4) the volume that got transacted without a change in price - or the neutral volume (total volume = market buy volume + market sell volume + neutral volume)
NOTE: THIS WORKS ONLY ON REAL-TIME BARS, NOT ON HISTORICAL BARS! The dotted line marks the start of real-time data (i.e., the bar from which the indicator started collecting and displaying data). You will see accurate data only for bars to the right of this line.
The longer you keep a chart open with the study enabled, the more data it collects and displays and the better your analysis can potentially be.
Note that the data gets reset every time any of the options is changed, the market is switched, the browser is refreshed, or the script is reloaded.
DATA ISN'T STORED. I.e., every time a new symbol is loaded/or the same symbol is reloaded, data gets refreshed.
Who is it for?
For traders who are used to analyzing buy/sell activity using market delta information. Especially, short-term trader/scalpers who are used to keeping the same chart open through the trading session.
Also for traders to see and study how anomalies in volume can give clues to buyer/seller absorption, initiative buying/selling etc.
Can be used to better understand VSA as well, although not necessary.
Essentially, this gives real-time delta volume information; use it however you see fit.
The Manager The Manger is a simple and repeatable trade management indicator suite for all instruments and for all timeframes.
The strategy that makes up this trade management tool includes:
1. Average volume calculations with auto lookbacks - Each candle then is identified as being above or below average volume with Dots above or below each candle.
2. Volume Distribution or Accumulation candles - Identifies if the candle has higher or lower volume compared to previous candle
a. If Higher volume and is a Down candle it is a distribution candle and is coloured Red.
b. If Higher volume and is an Up candles it is an accumulation candle and is coloured Green.
3. Adjustable BIAS cloud with four settings for Day Trading and Swing Trading. Red is Bearish BIAS with Price action and Green is a Bullish BIAS with Price Action.
Some of the simple rules to follow when using "The Manager" to help manage your trades Long or Short. (More is covered in our tutorial video)
1. When Short Trading and you get a Green Accumulation Candle with a Cyan Dot Above candle (Higher than Average Volume) printed. This is a sign of a potential reversal against your short trade and an aggressive profit taking exit is necessary.
2. When Long Trading and you get a Red Distribution Candle with a Cyan Dot Above candle (Higher than Average Volume) printed. This is a sign of a potential reversal against your long trade and an aggressive profit taking exit is necessary.
3. Pullbacks against the direction of your trade with Blue Dots Below Candles (Lower than average volume) show low momentum pullbacks and a sign to stay in your trade or revert to BIAS Cloud rules.
4. BIAS Cloud - When Green Changes to Red, this is your conservative exit for Long Trades. - When Red changes to Green, this is your conservative exit for short trade.
5. BIAS Cloud - When day trading and your position has a parabolic move - change settings to day trading aggressive
6. BIAS Cloud - When Swing trading and your position has a parabolic move - change settings to day trading conservative or moderate depending on how much room you want to give for a pullback against the direction of your swing trade.
Remember when day trading or swing trading, there is usually a data or news catalyst that reverses the direction of an instrument and potentially a trade that you are in. "The Manager" soon spots those with either accumulation or distribution candles combining with higher than average volume. And usually with a distinct candle stick formation rejecting highs or lows. The ability for you to visually see this on your chart with our indicator gives you chance to maximise your profits by understanding the behaviour represented by the coloured candles and the dots above or below the candles. The BIAS cloud allows for a more conservative approach to this as discussed above

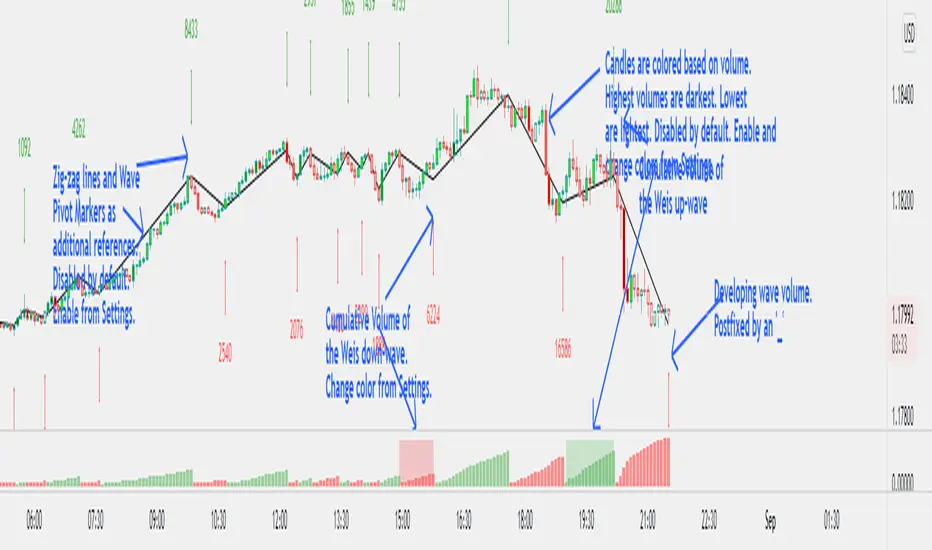
Weis Wave Volume NumbersWhat is it?
This is an indicator to complement @modhelius' Weis Wave Volume Indicator.
Original code has been modified to display wave volume (cumulative) numbers above or below the latest candle of the corresponding wave on the main pane. Since we are concerned only with relative volume, VOLUME NUMBERS HAVE BEEN SCALED DOWN. (If you need actual volume numbers, uncheck "Scale Down Volume" option in Settings). Rising wave volume is denoted in green. Falling wave volume is denoted in red. Developing wave volume is postfixed with a '_'. Confirmed wave volumes won't have this.
Who is it for?
This indicator is useful if you already use Weis Waves in your analysis and could do with an additional numerical representation of the wave volume on the main pane. Can be used in conjunciton with @modhelius' Weis Wave Volume (WWV) indicator (need to be added separately) to complement the visual representation of the waves. Can be used independently as well.
Pelase note that if you use any other Weis Wave indicator (other than @modhelius'), the numbers and the waveforms might not match.
Volume Records + AlertContents
Overall Introduction
Settings menu parameters
Usage
How to use alerts
Limits
Overall Introduction
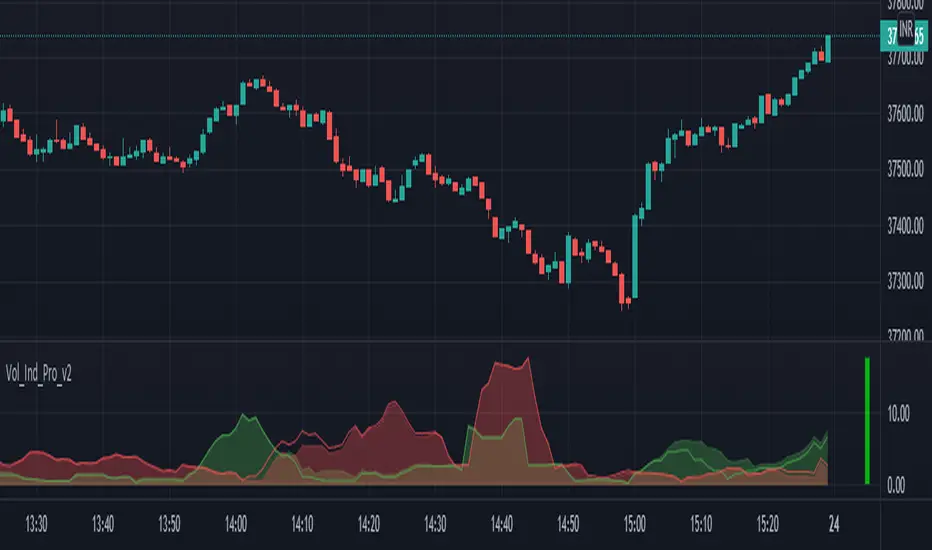
This indicator is a "volume analysis" tool for confirming the direction and strength of price trend and spotting trend reversals. This tool consists of two parts:
1- The colored graph is a custom volume oscillator which shows the relative changes in volume.
The darkening of the color of the bars is a sign of increasing volume.
2- Triangular labels that show trading volume records over different time periods based on the absolute values of the volume.
By creating an alert, you can be notified of new trading volume records. These records are:
Highest / lowest volume in one year,
Highest / lowest volume in six month
Highest / lowest volume in three month
Highest / lowest volume in one month
Highest / lowest volume in one week
Settings menu parameters
{Short Length} =>
The fast volume MA of the Volume Oscillator.
{Long Length} =>
The slow volume MA of the Volume Oscillator.
{Visual Parameters} =>
Parameters to personalize the appearance of the indicator.
{Alert Conditions Part 01: Highest Records ⏰ } =>
Parameters to customize the alert.
{Alert Conditions Part 02: Lowest Records ⏰ } =>
Parameters to customize the alert.
Usage
This indicator is a "volume analysis" tool for confirming the direction and strength of price trend and spotting trend reversals.
What Is Volume Analysis?
Volume analysis involves examining relative or absolute changes in an asset's trading volume in order to make inferences about future price movements.
A significant price increase along with a significant volume increase, for example, could be a credible sign of a continued bullish trend or a bullish reversal.
The gradual darkening of the bars is a sign of the strength of the trend.
Volume can be an indicator of market strength, as rising markets on increasing volume are typically viewed as strong and healthy.
How to use alerts
Note that by creating an alert, an instance of the indicator, with all your settings, will be activated on the site's server and alerts will be triggered by it.
After that, changing the indicator settings on the chart will no longer affect the alert.
Open the settings window and select the alert conditions as you wish
Click the Create Alert button (or press the A key while holding down the ALT key)
In the Condition section, select the name of the indicator.
Make the rest of the settings as you wish.
Finally, click on the Create button.
It's finished. After a few moments, your alert will be added to the Alerts menu.
Limits
The labels are displayed after the bars close.
Labels are displayed for the last 10,000 bars.

Volume Ranges (VSA)The script is intended for volume analysis
It shows if the volume is low, average, high or ultra-high.
Can be applied to any timeframe and any asset.
There're two calculation methods user can choose from:
1. Ranges - it allows to set a lookback period and moving average type to calculate averages
2. Deviations. In this case only one setting is applied - lookback period. Average type is not involved in this calculation method
Play around to figure out which one is better for you
Colors are:
Red - low volume
Green - avg volume
Yellow - high volume
Blue - ultra high volume

SVA - Simple Volume Analyzer, by BlueJayBird [bjb] ENGLISH & SPANISH
------------------------------------- ENSLIGH
The idea was initially inspired in the concepts shared by @LazyBear on his indicator "Better Volume Indicator" (). But I found it somewhat complicated and dull. So I came up with this.
Concept:
It changes the color of volume bars based on surrounding volume changes.
Volume changes are plotted as volume MAs lines in the volume pane.
Whenever the volume is higher than these MAs, the bar changes color.
For this reason, the bar color change is RELATIVE TO the surroundings, because the color change depends on how far the MA has been extended due to sudden (or not) changes in the volume.
BAR COLORS:
Weak Green and Red: Low volume. The calm before or after the storm.
Normal Green and Red: Mid volume. Still low volume, you may get bored.
Yellow: High volume. Players are playing hard and harder.
White: Ultra-High Volume. The elephants stepped in.
NOTES:
SVA works better at lower timeframes. Though as far as I can tell, it works pretty well as far as 1D timeframe.
------------------------------------- SPANISH
La idea estuvo inicialmente inspirada en los conceptos expuestos por @LazyBear en su indicador "Better Volume Indicator" (). Pero lo encontré un poco complicado y falto de claridad. Así que me inventé este.
Conceptp:
Cambia el color de las barras basándose en los últimos cambios de volumen.
Los cambios de volumen son ploteados como lineas de medias móviles (MAs, es decir "Moving Averages") en la sección del volumen (chart pane).
En cualquier momento que el volumen es mayor que estos MAs, el color de las barras cambia.
Por esta razon, el cambio de color de las barras es RELATIVO a lo que está sucediendo alrededor, ya que el cambio de color depende de qué tan lejos el MA se haya extendido por causa de los últimos cambios (o no) de volumen.
BAR COLORS:
Verde y rojo apagados: Volumen bajo (Low Volume). La calma antes de la tormenta.
Verde y rojo normales: Volumen medio (Mid volume). Volumen todavía bajo. Es posible que te aburras.
Amarillo: Volumen alto (High Volume). Los jugadores están jugando duro.
Blanco: Volumen ultra-alto (Ultra-High Volume). Los elefantes entran a la cancha.
NOTAS:
SVA funciona mejor en temporalidades menores. Pero por lo que he visto, funciona bien hasta la temporalidad de 1D.

KINSKI Flexible Volume OscillatorThe Volume Oscillator is a trend-oriented indicator that shows the strength or weakness of price trends. This indicator calculates the volume from two moving averages (MA). The value of the slow volume MA is then subtracted from the value of the fast moving average. The Volume Oscillator measures volume by analyzing the relationship between these two moving averages.
The special feature of this indicator is that the type of moving average can be selected as the basis for calculation. Currently, it is possible to choose between the following MA variants:
"COVWMA", "DEMA", "EMA", "EHMA", "FRAMA", "HMA", "KAMA", "RMA", "SMA", "SMMA", "VIDYA", "VWMA", "WMA".
Upward and downward movements are represented in different colors. The following color variants are available:
Color green: Strong upward trend
Color green/dark: weakening upward trend
Color red: strong downward trend
Color red/dark: weakening downward trend
The colors, as well as the style can be adjusted in the settings according to your own needs.

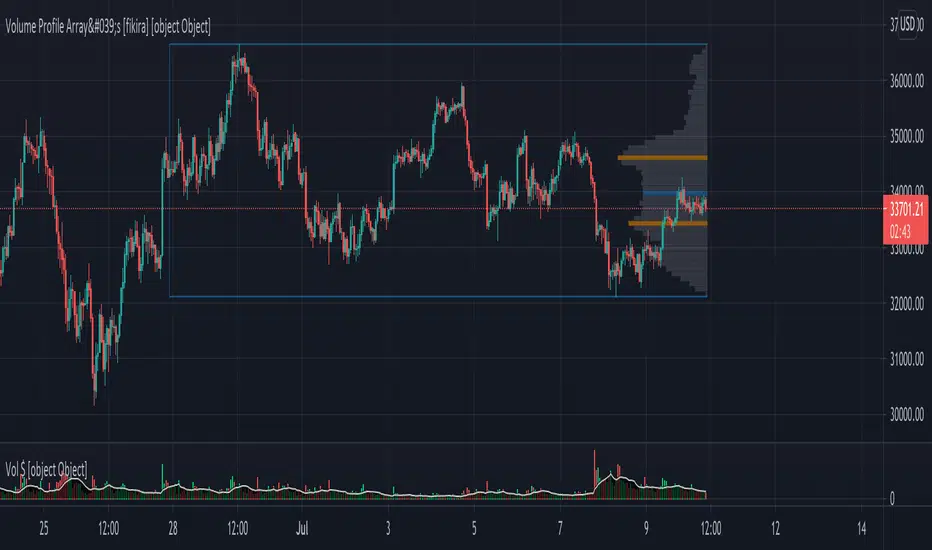
Volume Profile Array's [fikira]Inspired by © IldarAkhmetgaleev (AkhIL) - "Poor man's volume profile" - "PMVolProf"
He did a fantastic job on "Volume Profile"!
My script is about making this with array's
Settings:
- period (last x bars) for calculation
- max width (visible horizontal range)
- amount of sections (vertical sections; to many sections can give an error -> lower the sections in that case)
Setting "high/low", "close":
- "high/low"
-> the volume of every bar (in the period) which low is lower than a particular section and which high is higher than that section is added to that section
- "close"
-> here the volume of every bar (in the period) which close closes in the range of a particular section is added to that section
The orange/blue coloured "Volume lines" are the highest/lowest values above and below present close
(can be used as Support/resistance )
"Only show max/min" shows only the orange/blue Volume lines
The period and highest/lowest is show by 2 thin blue lines
Color, line width is adjustable
Cheers!
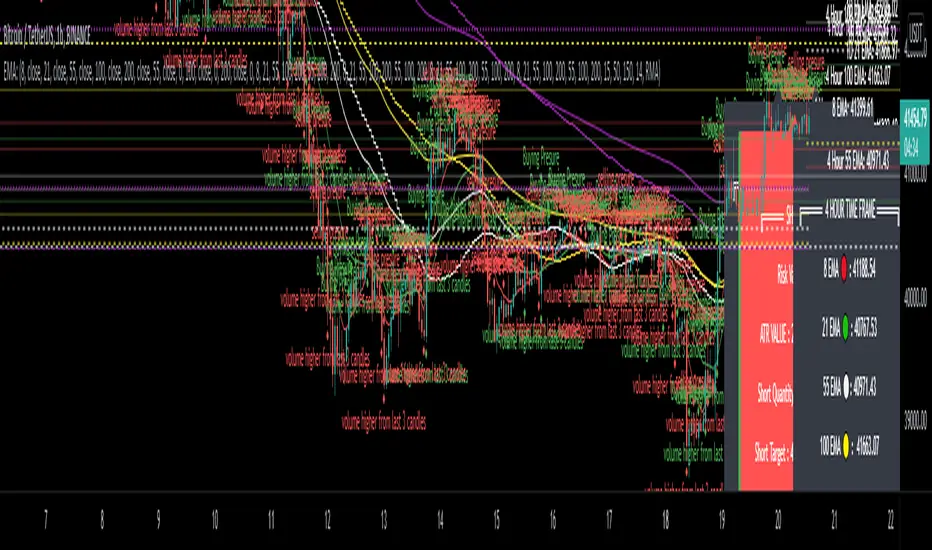
EMA - MA 21/55/100/200 with Horizontal Lines and LabelsThis indicator will help you to get dynamic support lines of EMA 21,55,100,200 and MA 55,100,200. You can get the Price of EMA And MA in Labels also.
SOLID LINES - 4 HOUR
DOTTED LINES - 1 DAY
DASHED LINE - 1 HOUR
Hope It will help you.
Trade with your own risk. I am not liable for any loss and profit based on this indicator.
Thank you.
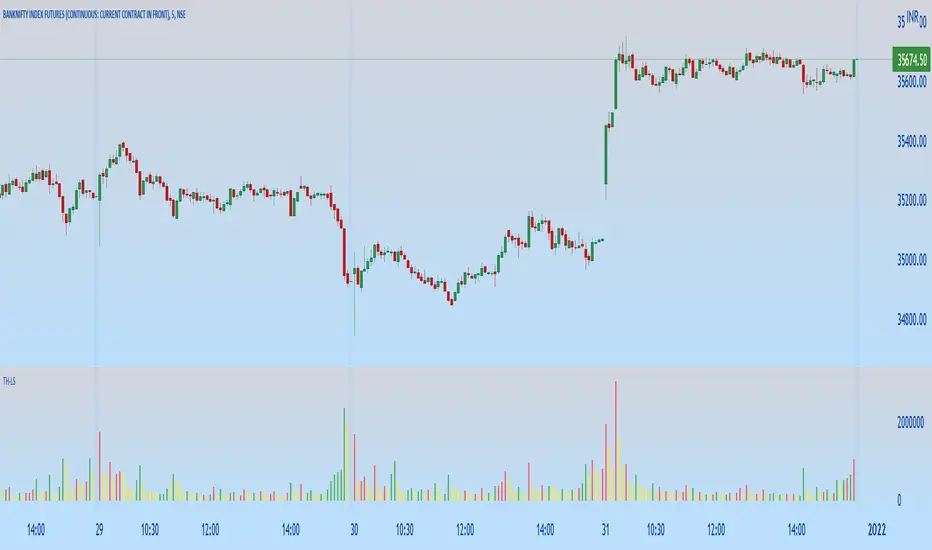
TH-Long & ShortThis indicator will help in identifying the reference candles for taking entry into the trade.
These reference candles are been named as LONG & SHORT Candles for easy understanding.
LONG Volume Candles - are reference candle for taking long positions.
SHORT Volume Candles - are reference candle for taking short positions.
Color Coding of Volume Candles:
LONG CANDLES - GREEN
SHORT CANDLES - RED
NEUTRAL CANDLES - YELLOW
LOGIC behind this implementation:
LONG candle:
In order to take long position we need to identify the price level, wherein we can anticipate the price is likely to get reversed along with increase in volume w.r.t previous candle.
Once this identified candle high price is taken out by any consecutive candles on closing basis, we get more confirmation of possible bullish price reversal. Hence the indicator tries to mark those volume candles as LONG candles (Green) where in the volume has increased from the previous candle along with the price increase on upper side.
SHORT candle:
In order to take short position we need to identify the price level, wherein we can anticipate the price is likely to get reversed along with increase in volume w.r.t previous candle.
Once this identified candle low price is taken out by any consecutive candles on closing basis, we get more confirmation of possible bearish price reversal. Hence the indicator tries to mark those volume candles as SHORT candles (Red) where in the volume has increased from the previous candle along with the price decrease on lower side.
NEUTRAL candle:
The price are trading in a range with no significant change in volumes too, these candles can be ignored as possible triggers for position entry. The indicator marks these volume candle as NEUTRAL candles (Yellow) which can be ignored.
HOW TO USE THIS INDICATOR:
First & more most this is not a buy/sell kind of indicator. As explained earlier, they help in identifying the possible price reversals.
We need to first identify your supply and demand zones and then use these signals as an extra confirmation for taking positions.
LONG Positions:
Wait for possible green volume candle formation, once formed mark the high of the corresponding price candle. On breach of that price on closing basis by any consecutive candle, we can look for possible long position.
SHORT Positions:
Wait for possible red volume candle formation, once formed mark the low of the corresponding price candle. On breach of that price on closing basis by any consecutive candle, we can look for possible Short position.
Friends,do use the indicator and give your valuable feedback.
QF VZO QF VZO is a leading volume oscillator
Its advantage is in giving leading buy/sell signals based on volume conditions and identifying overbought/oversold volume conditions, along with extreme overbought/oversold situations which lead to a change in sentiment, and most probably, leads to change of the current trend. QF VZO also has leading divergences to potentially spot trend reversals and trend continuation with almost zero lag.

Volume Changes with Bollinger Bands & Signal/AlertJapanese below / 日本語説明は下記
---------------------------------------------
Hello traders,
This indicator shows volume changes in percentage over the past periods as well as Bollinger Bands of volume changes with +2σ band.
The formula to calculate volume changes is;
(Today’s volume / average volume of past n periods ) *100
** n is user input
Bar color changes to green if close >= open, else if red.(You can change colors.)
Bollinger band
The reason I included Bollinger band here is if volume changes crosses over +2σ bands, that would suggest strong buying or selling pressure behind which might contribute price surging or dropping.
The following chart is BTCUSD daily chart.
Some correlation between volume changes and price movement can be observed.
For example, when volume changes surpasses BB+2σ with green bar, bullish trend occurs while in case of red bar, bearish trend happened.
Signal/Alert
Signal can be shown when volume changes cross over BB +2σ or upper band.(% changes, user input) Alert condition is same.
——————————————
出来高変化率のインジケーターです。過去n期間の出来高平均と当日出来高を比較してオシレータとして表示するとともに、出来高変化率のボリンジャーバンド+2シグマバンドを表示します。
出来高変化率の計算式は以下の通りです。
(当日出来高 / 過去n期間の平均出来高) * 100
* nはユーザ指定
終値>=始値の場合は緑色のバーで、終値<始値の場合は赤色のバーで表示します。(色は変更可能)
ボリンジャーバンド
出来高変化率が、出来高変化率のボリンジャーバンド+2シグマを超えるということはそれだけ強い買い・売りの存在を示唆していることになるのではと考え表示可能なようにしています。
以下のチャートはビットコイン/米ドルの日足チャートです。
例えば出来高変化率がBB+2シグマを超えて陽線で引けた場合、以降上昇トレンドが発生していることが確認できます。同様に出来高変化率がBB+2シグマを超えて陰線で引けた場合は下降トレンドが発生していることが確認できます。
これらは裏に強い買い、売り圧力が存在していることを示唆していると読み取ることができます。
ボリンジャーバンドが不要な場合は、出来高変化率のアッパーバンド(%, ユーザ指定)を表示して、変化率の度合いを測ることが可能です。
シグナル/アラート
出来高変化率がボリンジャーバンド+2σを超えた場合、もしくはアッパーバンドを超えた場合にシグナル表示します。
同じ条件でアラート設定も可能です。

Vol Buy/Sell %s, CMF, and Stocahstic Osc & UOPlots % Buy / Sell Volume , Chaikin Money Flow , Stochastic Oscillator, and Ultimate Oscillator on same axis, bound -1 to 1.
Show Volume Percentage, displaying buying as green and positive, selling as red and negative.
Showing the CMF, with green / red fill for positive / negative values.
Modified Stochastic Oscillator, converting bounds to -1 and 1, moving overbought/sold to -0.6 and 0.6, accordingly. Green fill (buy signal) with %D below -0.6 and %K lower than %D. Red fill (sell signal) with %D above 0.6 and %K higher than %D. Fill is between %D and bound, to be more visible.
Modified Ultimate Oscillator, converting bounds to -1 and 1, moving overbought/sold to -0.6 and 0.6, accordingly.

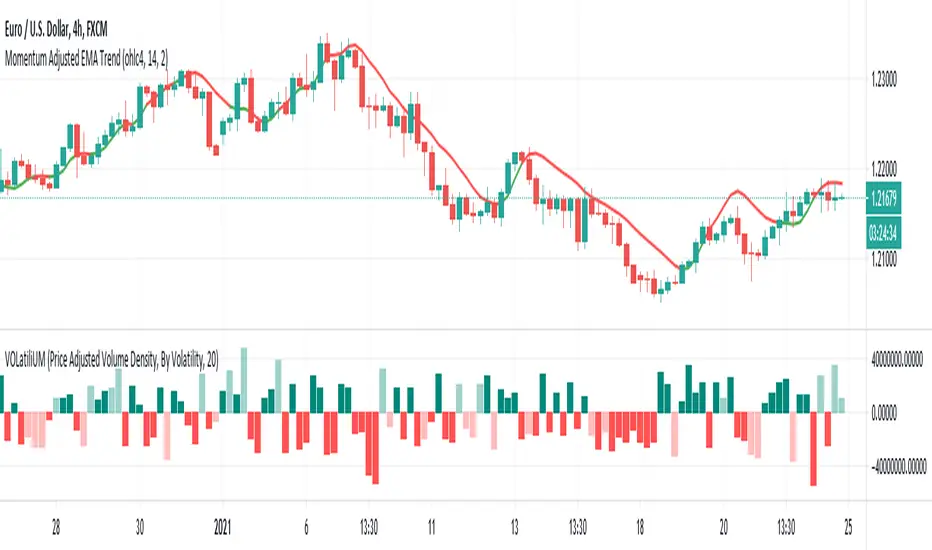
VOLatiliUMThis is a useful conjunction of volume and volatility together in one script, so I named it a blended name!
It can show the diagram of:
- Volume
- Volume Variation (Volume - Past Volume)
- Volume Density (Volume / (High - Low))
- Volatility in combination with the aforesaid ones
It also offers two concepts of bar colorizing, by using the size of the bars or by applying volatility from a higher time frame (HTF).
The option "Absolute Bar Values" is included for the ones who like to see all bars positive above the zero line!
Feel free to use the script and send me your opinions. Thanks.
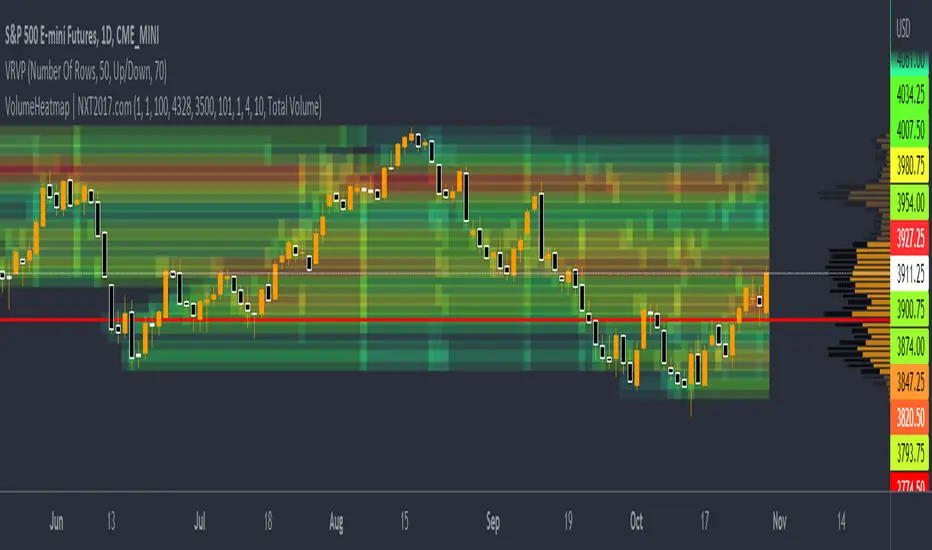
VolumeHeatmap | Experimental Version of Marketorders MatrixDear all,
I wish a Happy New Year!
The last time I tried to developing a Volume Heatmap, that the Marketorders made.
With the currently version I achieve my skills for that and I present it for everyone - some bugs I cannot solve today.
It also possible to see the POC - also the dynamic of volume developing:
The background for that is to find the pricelevel with the most volume - this is for valuetrading always the target.
If someone find it useful or have question - let me know!
Kind regards
NXT2017
Trend Volume RSI AnalysisHOW'S THIS INDICATOR DIFFERENT ?
If you are familiar with my work, then you would know that I am into creating indicators with tons of parameters, almost all of which are left for you to configure. While this gives you an incredible level of customization, the feedback I received was that some of you felt a bit overwhelmed by them.
As such, I decided to create an incredibly simple, yet effective indicator that can give you a better overview of what's going on with the security you are trading/investing in without you needing to tweak a dozen parameters. So, the first and most obvious difference you will notice with Trend Volume RSI Analysis is that you have only 1 parameter to configure (length), one checkbox to tick (highlight buy/sell zones), and one dropdown menu to choose from (the type of analysis). All unnecessary features are stripped away and all calculations are done on the backend. Now let's see if this simplicity affects the efficiency of the indicator.
HOW DOES THE INDICATOR WORK?
1. Trend Analysis
The first type of analysis, selected by default, is the Trend. It shows the balance between bulls and bears and their respective strength. In order to filter out the noise and smooth out the graph, a moving average is applied twice - once from left to right, and once from right to left. Although this causes a minor delay, it is justified since the common moving averages lag is significantly reduced. The screenshot below shows an example of a small bull run on the 1h chart.
The indicator also performs very well in spotting divergences. Two divergences (bearish and bullish respectively) are illustrated in the screenshot below.
2. Volume Analysis
Volume Analysis doesn't just sum the standard volume of the trend. Rather, it calculates the effective volume - the one responsible for moving the price up or down and seeks the relationship between total volume and price movement. Thus, you get a smooth volume trendline that should prevent you from opening a position against the trend. As logic dictates, if the buying volume is growing, then the trendline will go up and it will be in green. If, however, the selling volume is growing, the trendline will decline and it will be in red. This analysis is better used on a bigger time frame, such as on a 4h chart.
Note: For those of you who have used my other indicator Multi Time Frame Effective Volume Profile, the formula used here is slightly different. The one used there is optimized for volume bars, while the modifications here deliver a slightly better trendline with less noise.
3. RSI Analysis
Contrary to the standard RSI which derives its results from price movement, this RSI is calculated based on the modified volume. So it's fair to say that it's a Volume RSI. This makes it a bit jerkier, almost something in between an RSI and Stochastics. However, it is much better in identifying divergences and will quickly indicate potential trends as it will start climbing up sooner. The screenshot below is on a 4h chart, but that's only because I want to show more examples. It works equally well on the 1h or even on a minute chart.
In the first example, the divergence is pretty obvious on all three indicators. However, in example 2 you would be able to spot it only on Trend Volume RSI Analysis and somewhat in Stochastics. RSI makes a double bottom there. Similar is the case with example 3, where this indicator is long gone on the way up in comparison to the other two. The difference in reaction comes from the supply and demand relationship, not just from the price movement. When bears are losing steam, the indicator detects this as a low supply level, thus printing the divergence or even climbing up to indicate the start of a new mini-trend.
I must note, however, that this part of the indicator must be used in accordance with the main trend (this is where the other two analyses come into play). You go long on a pullback when there's an established bull trend and you go short on a pullback when there's an established bear trend.
4. Additional Settings
I know, for an indicator with just one parameter this description is getting pretty long. There's only one thing left to cover - highlighting the buy/sell zones. It is fairly simple - when it's ON, the zones where bulls are stronger than bears will be highlighted in green. When the opposite is true, the background will be red. You can switch it OFF if it intervenes with your analysis, but I prefer having it as it shows a confluence of bull/bear force and the indicator itself. Here's an example below:
HOW MUCH DOES THIS INDICATOR COST ?
Although Trend Volume RSI Analysis may look like an incredibly simple indicator, I can assure you that a great deal of time, testing, and optimizing have gone into creating an indicator that does almost everything for you. The initial version was much more complex and a few dozen iterations were required to reach that level of simplicity and practicality. Furthermore, I will continue to update this indicator as well as introduce user-requested features if they will improve its overall performance. To find out more about how to gain access to this indicator, please use the provided information below or just message me . Thank you for your time.
Disclaimer: The purpose of all indicators is to indicate potential setups, which may lead to profitable results. No indicator is perfect and certainly, no indicator has a 100% success rate. They are subject to flaws, wrongful interpretation, bugs, etc. This indicator makes no exception. It must be used with a sound money management plan that puts the main emphasis on protecting your capital. Please, do not rely solely on any single indicator to make trading decisions instead of you. Indicators are storytellers, not fortune tellers. They help you see the bigger picture, not the future.

Multi Time Frame Effective Volume ProfileWHAT DOES THIS INDICATOR DO?
It is a well-known fact that volume often precedes price. As such, if you can spot an increased volume early on, you can take a position before the majority joins the trend. The purpose of this indicator is to show the tactical moves of the insiders and the big players before they become obvious to everyone. Similarly, you should more easily be able to identify trend exhaustion and look to close your position.
This volume indicator is largely inspired by Pascal Willain's concept of Effective Volume described in his book "Value in Time" , which is an improvement over Larry Williams' accumulation/distribution formula. The more robust formula takes into account two very important factors:
1) the gaps that are an inevitable part of almost all securities;
2) the closing price in relation to the spread, which indicates the bull/bear strength;
I have slightly modified Pascal Willain's formula for Effective Volume and introduced a few additional features, which I believe make the indicator easier to use and understand.
HOW DOES THE INDICATOR WORK?
1. Volume Bar Deconstruction
The first significant part of this indicator is that it deconstructs the volume bar of your current trading session into one-minute volume bars, separates the significant volume, and then reconstructs the bar again. As a result, you get a new bar, in which only the significant volume is counted. Not only this, but you also get a more comprehensive view of the relationship between buying and selling that occurred on the smaller time frame.
In the screenshot below you can see that although the bears were stronger, the bulls met them with almost identical force, which resulted in absorbing the supply in 1 and then in 2 the demand drove the price up. In a traditional volume bar chart (which is also plotted), you only see the total traded volume in either red or green depending on the closing of the bar. As you would probably agree, this does not reveal the whole story.
Accumulation/distribution by large players and funds is done with great precision, which is hard to catch intraday and nearly impossible on a daily time frame. However, large orders are hard to conceal on the 1-min chart since any unusual volume sticks out like a sore thumb. The whole idea here is for you to get a comprehensive view of what's going on in the small time frame, reveal any hard to spot transactions, and then make an informed decision on your trading time frame.
To ease your analysis even further, the indicator shows you minor volume as a percent of the major volume . Since your current time frame volume bar is a sum of all buying and selling volume from a smaller time frame, you get to see a more complete picture of the buying and selling that occurred. For example, you have a total volume of 150 BTC in a single 1h volume bar, out of which 100 BTC is in selling volume and 50 BTC is in buying volume. What you will see as parameters are this: 50 (buying volume), 100 (selling volume), 50 (minor volume as a percent of the big volume, since 50/100 = 0.5 = 50%). The higher the percentage, the more even the powers between buying and selling are.
2. Volume Trend
Building upon the first feature of the indicator, you can also choose a cumulative volume trend line. It is constructed by evaluating the type of the significant volume - adding it up if the bar closes positive (green) and subtracting it if the bar closes negative (red). The evaluation is once again done on a 1-min time frame by default, but you can change that along with the count lookback period in settings.
3. Bull / Bear Equilibrium
Based upon the volume bars, Bull/Bear Equilibrium shows you the difference between buying and selling pressure under the form of a smoothed histogram. It is particularly useful not only for spotting trends early in the beginning, but also when those trends start reaching a point of exhaustion. You can then move your Stop Loss accordingly, close part of your position to preserve profits, or even look for a good entry position in the opposite direction.
HOW MUCH DOES THE INDICATOR COST ?
As much as I would like to offer it for free (as some of my other ones), a great deal of work, trading logic, and testing have gone into creating this indicator. More than a few hundred iterations and a few dozen branches were required to reach the end result which is a precise combination of usefulness, simplicity, and practicality. Furthermore, this indicator will continue to be updated and user-requested features that improve its performance will be added.
Disclaimer: The purpose of all indicators is to indicate potential setups, which may lead to profitable results. No indicator is perfect and certainly, no indicator has a 100% success rate. They are subject to flaws, wrongful interpretation, bugs, etc. This indicator makes no exception. It must be used with a sound money management plan that puts the main emphasis on protecting your capital. Please, do not rely solely on any single indicator to take trading decisions instead of you. Indicators are storytellers, not fortune tellers . They help you see the bigger picture, not the future.
To find out more about how to gain access to this indicator, please use the provided information below or just message me. Thank you for your time.

OPINICUS VOLUME DATA - Time Of Day Relative Volume (RVOL)This tool calculates the relative volume (RVOL) based on the normal average volume at that particular time of day.
Relative volume is a powerful piece of information because it offers a gauge as to whether a stock is in play or not. If RVOL is less than 1 it is not in play on this trading day or during this timeframe. If RVOL is above 2, it IS in play and can potentially be traded.
This script allows you to determine if relative volume is average, above average, 2x, or 3x via different color volume bars, at that particular time of day.
There are 2 different settings on this volume indicator.
The first setting is "Gradient." This is the preferred setting, and the one I personally use. Gradient is going to show you different color volume bars based on the RVOL multiple.
The color scheme is as follows:
Gray for average volume
Red if RVOL is between 1.0 and 1.5
Orange if RVOL is between 1.5 and 2
Green if RVOL is between 2.0 and 3.0
Lime green (bright green) if RVOL is greater than 3.
The second setting is "Price." This setting simply shows you the color of the candlestick. This is useful if you find the gradient setting to be too distracting, but still want to see if there is increased relative volume.
There is an alerts setting, which I find to be useful but can also be very distracting. If you leave the "Alert At RVOL %" setting at 0, then alerts will only be triggered if the current candle exceeds the 1.0 (100%) RVOL level. This happens far too frequently, so I prefer to put the alert at 2 or 3. If you change the "Alert At RVOL %" setting then alerts will be triggered if the RVOL percentage (blue number) exceeds your given value. The blue number is a percentage of the average, so if it’s at 1, then it’s 100% of the average.
Note: This tool does not work if you have after-hours or pre-market data displayed. The preferred setting for this tool is the 15' chart, with a 21 day look back period. It is also very useful on the daily chart when doing higher timeframe research.

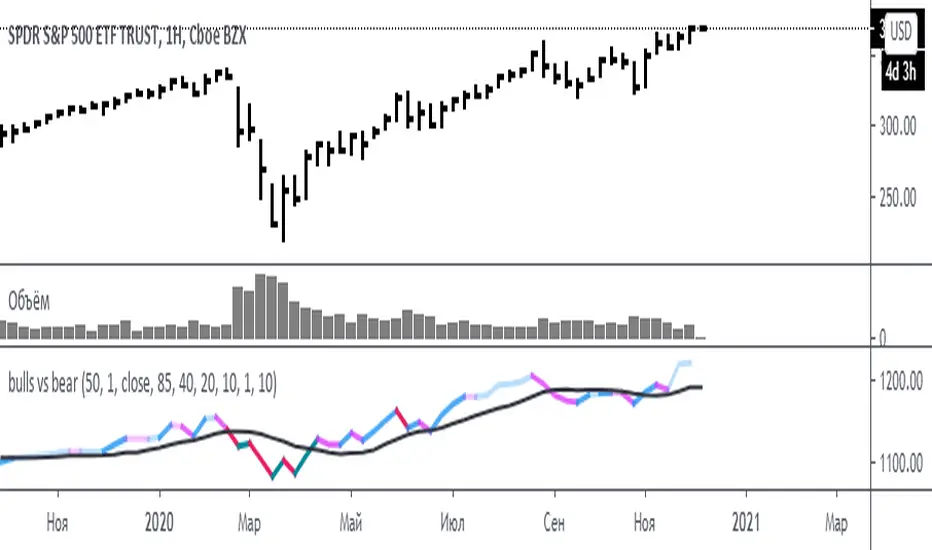
bulls vs bear for VSA(Google translation from Russian.)
This indicator is based on the efficiency of bulls and bears for VSA and has the same parameters.
Its only difference is that all the values of the efficiency of bulls and bears for VSA indicator are sequentially added here.
I want to note that the Period spread - Bars from close to close argument was made for experimental purposes, and shows interesting results for values 3-4-5, in theory this is not very logical. Because then the estimate of the spread for this interval (3-4-5) will be divided by the estimate of the volume of the current bar.
Also added here is a moving average with a default period of 10 - theoretically, if the indicator is above the moving average - the initiative is behind the bulls - if below - the initiative is behind the bears.
It is recommended to use this indicator with the indicator:
efficiency of bulls and bears for VSA
Volume on bar VSA - indicator V2
Russian language.
Этот индикатор сделан на основе efficiency of bulls and bears for VSA и имеет такие же параметры.
Единственное отличие его в том, что тут последовательно складываются все значения индикатора efficiency of bulls and bears for VSA .
Хочу отметить, что аргумент Period spread - Bars from close to close (Период спреда - Баров от закрытия до закрытия) сделан в экспериментальных целях, и показывает интересные результаты на значения 3-4-5, в теории это не очень логично. Потому-что тогда будет делиться оценка спреда за этот интервал (3-4-5), на оценку величины объема текущего бара.
Также тут добавлена скользящая средняя с периодом по умолчанию 10 – теоретически, если индикатор над скользящей средней – инициатива за быками – если ниже – инициатива за медведями.
Это индикатор рекомендуется использовать с индикатором:
efficiency of bulls and bears for VSA
Volume on bar VSA - indicator V2