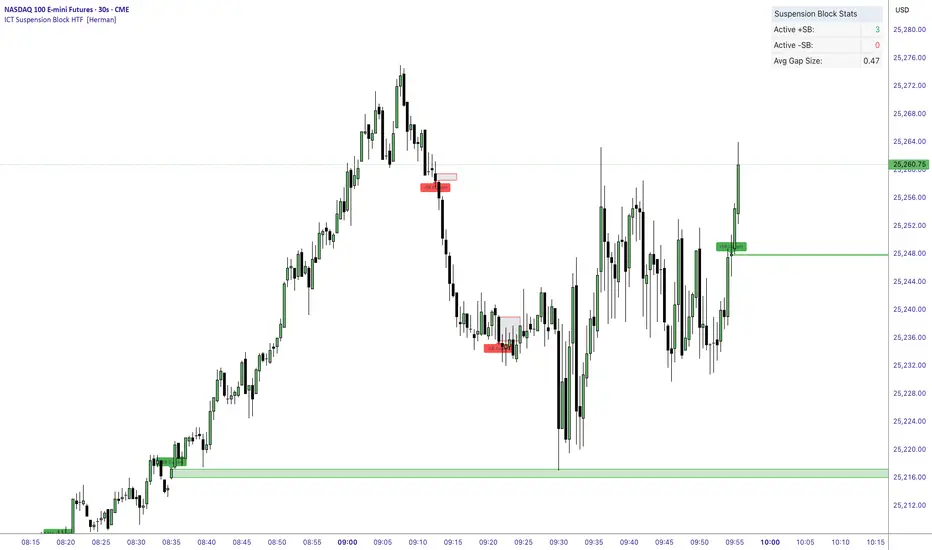
ICT Suspension Block HTF [Herman]ICT Suspension Block HTF — auto-marking +SB / –SB with MTF
ICT Suspension Block HTF automatically detects and plots Suspension Blocks (SB ) on your chart and optionally pulls them from higher timeframes. It’s built for traders who want precise, visual SB zones with mitigation/entry alerts and a compact stats panel.
What’s a Suspension Block (SB) ?
-A Suspension Block is a body-to-body price imbalance formed by three consecutive candles in the same direction where the bodies create sequential “gaps” (a brief pause in price efficiency).
-Bullish +SB: three bullish candles with body-to-body gaps stepping up.
-Bearish –SB: three bearish candles with body-to-body gaps stepping down.
This script highlights the actionable block zone (between the body levels of the middle candle) and lets you extend it forward for reaction tests.
Note: This tool implements a widely discussed definition of Suspension Blocks for educational/analytical use.
Key features
-Auto detection: Plots +SB/–SB the moment a valid 3-candle structure forms.
-Multi-Timeframe (MTF):
-Current timeframe detection (toggle).
-MTF1 & MTF2 pulls (e.g., 5m and 15m by default) to show HTF SBs directly on your LTF chart.
-Smart de-duplication: Avoids drawing near-identical blocks (tick-aware tolerance).
-Midpoint line (optional): Draws the 50% of the block for refined confluence.
-Forward extension: Choose how far to extend the zone in bars.
Alerts:
-New +SB/–SB formed
-Price enters a block
-Block mitigated
-Stats table: Lightweight panel showing active +SB / –SB counts and average detected gap size.
Theme aware : Light/Dark table themes matched to Herman Trading visuals.
Inputs (quick guide)
-Multi-Timeframe
-Enable Current Timeframe
-Enable MTF1 (timeframe input)
-Enable MTF2 (timeframe input)
Core
-Show Bullish / Bearish
-Show Labels
-Show 50% Midpoint
-Min Gap Size (% of candle body) — filters out weak structures
-Extension Length (bars) — how far to project the zone
-Max Number of Blocks — auto-prunes oldest drawings
-Label Size & Colors
-Alerts
-New Block Formation
-Price Entered Block
-Block Mitigation
-Table
-Show / Position
-Theme (Light / Dark)
How mitigation & entry work
-Entry alert: Fires when price crosses into a block (from outside).
-Mitigation: When price tags the block boundaries (top/bottom), the zone is marked mitigated (faded, no further extension).
-The stats panel updates counts in real time.
Practical tips
-Use HTF SBs (e.g., 15m/1h) on your execution timeframe for higher-quality reaction zones.
-Combine with your existing framework (session timing, liquidity sweeps, iFVG/MSS, etc.).
-Tighten/loosen Min Gap Size to match instrument volatility.
-Keep Max Blocks reasonable for performance on very low timeframes.
Disclaimer
This indicator is for education and analysis. It does not constitute financial advice. Trading involves risk; always do your own research and manage risk appropriately.
Volumeimbalance
52SIGNAL RECIPE Hidden Volume52SIGNAL RECIPE Hidden Volume
◆ Overview
52SIGNAL RECIPE Hidden Volume is an innovative indicator that visualizes the hidden buying and selling strength behind the conventional volume candles. By analyzing the relative proportion of buying and selling within each candle’s price range, it splits the total volume into buy volume and sell volume. Displayed as color-coded bars (blue for buying, pink for selling) in a separate panel below the chart, it provides clear insight into the market’s buying and selling pressure.
Unlike standard volume indicators that only show total volume, this indicator reveals the underlying balance and shifts in buying and selling power, offering traders a deeper understanding of market dynamics.
Furthermore, when viewed alongside the traditional volume candles that everyone commonly uses, it helps traders interpret price movements and volume flows more comprehensively, enabling a more insightful analysis of overall market trends.
─────────────────────────────────────
◆ Key Features
- Buy/Sell Volume Ratio Analysis: Calculates the relative buy and sell ratios based on the candle’s price movement range
- Hidden Buying and Selling Strength Visualization: Separately displays buy volume (blue) and sell volume (pink) as stacked bars in a dedicated bottom panel
- Real-time Data Reflection: Captures immediate changes in market buying and selling pressure based on live volume data
- Clear Visual Distinction: Uses background shading to easily highlight periods of buying dominance (blue) or selling dominance (pink)
- Quantified Buy/Sell Balance: Displays the current buying vs selling ratio numerically on chart labels for quick reference
- Recommended Use with Traditional Volume Candles: Designed to be used together with commonly used volume candles for more comprehensive market flow interpretation
─────────────────────────────────────
◆ Trading Application Points
- Provides deeper insight into market sentiment compared to conventional volume bars
- Helps identify shifts in buying and selling power indicative of trend continuations or reversals
- Useful as a complementary tool alongside price action to better time entries and exits
─────────────────────────────────────
◆ Synergy With Other Indicators
- Combine with trend indicators (RSI, MACD, Moving Averages) to validate trend strength and momentum
- Use together with volume and order flow tools to enhance understanding of market participant behavior
─────────────────────────────────────
◆ Conclusion
52SIGNAL RECIPE Hidden Volume is a powerful and intuitive tool that unveils the balance of buying and selling forces concealed within the total volume. By visualizing buy and sell volumes separately and updating in real-time, it allows traders to grasp the subtle shifts in market pressure and make more informed trading decisions.
Especially when used together with the traditional volume candles commonly referenced by most traders, it enhances traders’ ability to interpret price movement combined with volume flow in a more multi-dimensional and precise way, ultimately supporting more effective trading strategies.
─────────────────────────────────────
※ Disclaimer: This indicator is provided as a supplementary analysis tool and should not be used as the sole basis for trading decisions. Past data does not guarantee future results. Always apply proper risk management.
52SIGNAL RECIPE Hidden Volume
◆ 개요
52SIGNAL RECIPE Hidden Volume은 일반적인 볼륨 캔들 뒤에 숨겨진 매수와 매도의 힘의 크기를 가시화하는 지표입니다. 각 캔들의 가격 움직임 범위 내에서 매수와 매도의 상대적인 비율을 계산해, 총 거래량을 매수 볼륨과 매도 볼륨으로 나누어 보여줍니다. 별도의 차트 하단 패널에 파란색 매수 볼륨과 분홍색 매도 볼륨을 컬러 막대 그래프로 시각적으로 구분하여 시장 내 거래 심리와 매수·매도 압력을 명확하게 파악할 수 있도록 지원합니다.
일반 거래량 지표가 단순한 거래량 수치만 제공하는 반면, 이 지표는 매수세와 매도세의 숨겨진 균형과 변화를 직관적으로 보여줘, 시장 내부의 매매 강도와 방향성을 깊이 있게 이해하는 데 유용합니다.
또한, 일반적으로 모두가 사용하는 볼륨 캔들과 함께 병행해 보면, 가격 변동과 거래량의 흐름을 더 입체적으로 분석할 수 있어서 시장 전체의 흐름을 해석하는 데 훨씬 용이합니다.
─────────────────────────────────────
◆ 주요 특징
- 매수·매도 거래 비율 분석: 캔들의 가격 변동 범위를 기준으로 매수와 매도 비율 산출
- 숨겨진 매수·매도 힘 시각화: 별도 차트 하단 패널에서 매수 볼륨(파란색)과 매도 볼륨(분홍색)으로 구분하여 가시화
- 실시간 반영: 실시간으로 변하는 거래량 데이터에 기반해 시장 내부 매수·매도 압력 변화 즉시 포착
- 심플한 시각적 구분: 색상과 배경으로 매수 우세 또는 매도 우세 구간을 직관적으로 표시
- 매수·매도 힘의 균형 이해 지원: 차트 상단 텍스트 라벨로 현재 매수/매도 비율을 숫자로 제공
- 볼륨 캔들과 병행 사용 권장: 모두가 사용하는 기본 볼륨 캔들과 함께 보면서 시장 흐름 해석에 활용 가능
─────────────────────────────────────
◆ 트레이딩 활용 포인트
- 기존 거래량 지표 대비 더 깊은 시장 심리 분석 가능
- 매수세와 매도세 간 힘의 균형 변화를 주목하여 추세 전환이나 지속 신호로 활용
- 가격 흐름과 결합해 진입 및 청산 타이밍 설정에 도움
─────────────────────────────────────
◆ 다른 지표와 조합 가능성
- 가격 추세 지표(RSI, MACD, 이동평균선 등)와 함께 사용해 추세 강도와 매수·매도 압력 동시 분석
- 거래량 및 주문장 지표와 결합하여 시장 참여자 심리 및 매매 동향 파악 강화
─────────────────────────────────────
◆ 결론
52SIGNAL RECIPE Hidden Volume은 일반 볼륨 캔들만으로는 알기 어려운 매수와 매도 간의 힘의 균형을 명확히 보여주는 강력하고 직관적인 지표입니다. 실시간 거래량 내 매수·매도 비율을 분리해 시각화함으로써, 트레이더들이 시장 내부의 숨겨진 힘의 흐름을 이해하고 이를 바탕으로 한 전략적 의사결정을 내릴 수 있도록 돕습니다.
특히 일반적으로 많이 사용하는 볼륨 캔들과 함께 병행하여 볼 때, 가격 변동과 함께 시장의 거래 심리를 더욱 입체적이고 정확하게 해석할 수 있어 훨씬 효과적인 매매 전략 수립이 가능합니다.
─────────────────────────────────────
※ 면책 조항: 본 지표는 투자 판단을 위한 보조 도구로 제공되며, 단독 의존해서는 안 됩니다. 과거 데이터에 기반한 분석이므로 미래 결과를 보장하지 않으며, 적절한 리스크 관리와 함께 사용하시기 바랍니다.

[TehThomas] - ICT Volume ImbalanceThis script is a Volume Imbalance (VI) detector and visualizer for use on the TradingView platform. The goal of the script is to automatically identify areas where there are significant imbalances in the volume of trades between consecutive candlesticks and visually highlight these areas. These imbalances can provide traders with valuable insights about the market’s current condition, often signaling potential reversal or continuation points based on price and volume action.
ICT (Inner Circle Trader) Concept of Volume Imbalances
Volume imbalances are a critical concept in the ICT trading methodology. They refer to situations where there is an unusual or significant difference in volume between two consecutive candlesticks, which might indicate institutional or large player activity. According to ICT principles, these imbalances can show us areas of market inefficiency or potential price manipulation. By identifying these imbalances, traders can gain an edge in understanding where the market is likely to move next.
Bullish and Bearish Volume Imbalances:
Bullish Volume Imbalance: This occurs when there is a strong increase in buying pressure, typically indicated by a higher volume on a candle that closes significantly above the previous one, often leaving a gap or larger price movement. The market could be preparing to push higher, and the volume shows a clear shift in buying demand.
Bearish Volume Imbalance:
Conversely, a bearish imbalance occurs when there is a strong increase in selling pressure, typically signaled by a candle that closes significantly lower than the previous one, again with higher volume. This could indicate that large players are offloading positions, and the price is likely to drop further.
Key Features and Functions of the Script
The script automates the process of detecting these volume imbalances and visually marking them on a price chart. Let’s explore its functionality in detail.
1. Inputs Section
The script allows for significant customization through its input options, which help traders adjust the detection and visualization of volume imbalances based on their individual preferences and trading style. Below are the details:
lookback (250 bars): This input specifies the number of bars (or candles) the script should look back when analyzing the volume imbalance. By setting this to 250, the user is looking at the last 250 bars on the chart to detect any significant volume imbalances. This period is adjustable between 50 to 500 bars.
volumeThreshold (1.0 multiplier): This input helps set the sensitivity for identifying volume imbalances. The script compares the volume of the current candle with the previous one, and if the current volume exceeds the previous volume by this threshold multiplier (in this case, 1.0 means at least equal to the previous volume), then it triggers an imbalance. Users can adjust the multiplier to suit different market conditions.
showBoxes (true/false): This toggle determines whether the boxes representing volume imbalances are drawn on the chart. When enabled, the script visually highlights the imbalances with colored boxes.
fillBaseColor (orange with 80% opacity): This is the color setting for the background of the imbalance boxes. A softer color (like orange with opacity) ensures the imbalance is highlighted without obscuring the price action.
borderColor (gray): The color of the border around the imbalance boxes. This adds a visual distinction to make the imbalance areas more visible.
borderWidth (1 pixel): This controls the width of the box's border to adjust how prominent it appears.
rightOffset (30 bars): This input controls how far the imbalance box extends to the right on the chart. It helps users anticipate the potential continuation of the imbalance beyond the current candle.
allowWickOverlap (true/false): This setting allows imbalances to be identified even if the wicks of the two consecutive candlesticks overlap. If set to false, only imbalances where the bodies of the candlesticks don’t overlap are considered.
showBrokenBoxes (true/false): If enabled, once a volume imbalance no longer holds true (i.e., the price breaks through the box), the box is marked as "broken." If disabled, the box is deleted when the imbalance condition no longer applies.
brokenBoxColor (red): This controls the color of the box when it is broken, which can be used as a visual cue that the imbalance was invalidated or no longer valid for analysis.
2. Volume Imbalance Function
This is the core function of the script, where the logic to detect bullish and bearish volume imbalances is implemented.
Bullish Imbalance Condition:
The first condition checks if the low of the current candle is greater than the high of the previous candle. This suggests that the market is moving upward with buying pressure.
The second condition checks whether the volume of the current candle is higher than the previous candle by the volumeThreshold multiplier. If both conditions are satisfied, a bullish imbalance is detected.
Bearish Imbalance Condition:
The first condition checks if the high of the current candle is lower than the low of the previous candle. This suggests downward price action with selling pressure.
The second condition checks whether the current volume exceeds the previous volume by the threshold
Allow Wick Overlap: If allowWickOverlap is set to true, the script will still detect imbalances if the wicks of the two candles overlap (common in volatile markets). If false, imbalances are only considered if the wicks do not overlap.
3. Box Creation and Management
When a volume imbalance is detected, the script creates a box on the chart:
The bullish imbalance box is drawn using the minimum of the open and close of the current bar as the top boundary and the maximum of the open and close of the previous bar as the bottom boundary.
Conversely, the bearish imbalance box is drawn in reverse, using the maximum of the current bar’s open and close as the top boundary and the minimum of the previous bar’s open and close as the bottom boundary.
Once the box is created, it is displayed on the chart with the specified background color, border color, and width.
4. Processing Existing Boxes
After detecting a new imbalance and drawing a box, the script checks whether the box should still remain on the chart:
If the price moves beyond the boundaries of the imbalance box, the box is marked as broken (if showBrokenBoxes is enabled), and its color is changed to red, signifying that the imbalance is no longer valid.
If the box remains intact (i.e., the price has not broken the defined boundaries), the script keeps the box extended to the right as the market continues to evolve.
5. Removing Outdated Boxes
Lastly, the script removes boxes that are older than the specified lookback period. For example, if a box was created 250 bars ago, it will be deleted after that period. This ensures the chart stays clean and only focuses on relevant imbalances.
Why This Script is Useful for Traders
This script is extremely valuable for traders, especially those following the ICT methodology, because it automates the process of detecting market inefficiencies or imbalances that might signal future price action. Here’s why it’s particularly useful:
Identifying Key Areas of Interest: Volume imbalances often point to areas where institutional or large-scale traders have entered the market. These areas could provide clues about the next significant move in the market.
Visualizing Market Structure: By automatically drawing boxes around volume imbalances, the script helps traders visually identify potential areas of support, resistance, or turning points, enabling them to make informed trading decisions.
Time Efficiency: Instead of manually analyzing each candlestick and volume spike, this script does the heavy lifting, saving traders valuable time and allowing them to focus on other aspects of their strategy.
Enhanced Trade Entries and Exits: By understanding where volume imbalances are occurring, traders can time their entries (buying during bullish imbalances and selling during bearish ones) and exits (as imbalances break) more effectively, thus improving their chances of success.
Conclusion
In summary, this script is a powerful tool for traders looking to implement volume imbalance strategies based on the ICT methodology. It automates the identification and visualization of significant imbalances in price and volume, offering traders a clear visual representation of potential market turning points. By customizing the settings, traders can tailor the script to their preferred timeframes and sensitivity, making it a flexible and effective tool for any trading strategy.
__________________________________________
Thanks for your support!
If you found this idea helpful or learned something new, drop a like 👍 and leave a comment, I’d love to hear your thoughts! 🚀
Make sure to follow me for more price action insights, free indicators, and trading guides. Let’s grow and trade smarter together! 📈

ICTProTools | ICT Insight - Momentum Structures🚀 INTRODUCTION
The Momentum Structures Indicator builds upon the principles of ICT (Inner Circle Trader) and Smart Money Concepts (SMC) to give traders a clearer view of market dynamics. These methods reveal how institutional trading activity shapes price movements, particularly through different types of market liquidity.
The indicator is designed to provide traders with advanced insights into market dynamics by focusing on key price imbalances and higher-timeframe structures . By combining these elements, the indicator allows users to analyze price behavior across multiple timeframes, helping them anticipate potential liquidity pools and price reversals. The emphasis on price imbalances and liquidity zones makes it a versatile tool for both intraday and longer-term strategies, providing critical insights for understanding market cycles and potential turning points.
💎 FEATURES
Imbalance Bar Colors / Zones
Imbalances are fundamental components of the ICT methodology, highlighting areas where price accelerates, creating gaps that may indicate a lack of liquidity . These voids often point to potential reversal or continuation zones in the price action.
An imbalance typically arises when supply and demand are out of balance, resulting in a gap between price levels. Traders keep a close eye on these gaps, as they could present opportunities to enter trades when the price revisits them , as they suggest a strong institutional interest.
We can notice two types of imbalances… A Fair Value Gap (FVG) usually forms from three consecutive candles, defining the space between the wicks of the first and last candle. Conversely, a Volume Imbalance (VI) occurs when a gap appears between the opening and closing prices of two consecutive candles. When these imbalances align with FVGs, they offer a well-rounded framework for assessing market strength.
By analyzing both FVGs and VIs together, traders can gain valuable insight into potential price movements and better evaluate the likelihood of continuation or reversal.
This chart illustrates the Fair Value Gaps (FVG) and Volume Imbalances (VI) within the GBPUSD price action. The FVG Bar Color and FVG Zone represent the same Fair Value Gaps, and similarly, the VI Bar Color and VI Zone display the same Volume Imbalances. They highlight areas where rapid price movements have created gaps in the market. These gaps indicate potential zones for trade entries or exits as the price may return to fill them. As we can see on the chart, the major part of imbalances created has already been filled. They constitute really interesting Point of Interest (POI).
The 50% FVG line marks the midpoint of the gap, which is often considered an important level for price action. A clear example appears in the Bearish FVG on the top left, where price first filled it below the midline, creating a small reaction. The price then liquidated this "fake mitigation" by moving just above the midline before beginning its significant downward movement. This demonstrates the crucial role of imbalances and how precisely price interacts with them.
Traders can use this information to identify potential buying or selling opportunities based on the interaction of price with these gaps and volume imbalances, aiding in the development of their trading strategies.
PO3 Candles (Power of Three)
The Power of Three is a critical concept in the ICT methodology that analyzes Higher Timeframe (HTF) candles focusing on the opening price, high wick, low wick, and closing price. This framework helps traders understand the current market cycle, in three phases , and its trading implications.
Accumulation Phase: In this initial phase, the price consolidates around the opening price as the market gathers liquidity. This often signals that larger players are positioning for the next move.
Manipulation Phase: Represented by the candle wicks, this phase indicates the extreme points where liquidity grabs often occur. Observing these wicks helps traders identify the end of the accumulation phase and potential turning points.
Distribution Phase: The candle body reflects a decisive price movement in one direction , following accumulation and manipulation. Traders align with the direction of this phase to capture the “real candle move”.
Our indicator provides you with the valuable capability to integrate the True Day Range, as defined by ICT. This concept, rooted in institutional logic, defines a trading day as starting at 00:00 New York time. You can customize it to match your trading style and analysis needs.
You can also overlay imbalances (FVG and VI) directly onto PO3 Candles, seamlessly combining imbalance detection with high-timeframe price action. This approach gives you a sharper market perspective, uncovering potential turning points with greater clarity.
In summary, PO3 Candles help traders assess the market structure and identify cycle positions on HTF candles, enabling them to make more strategic trading decisions, which allows for better entry and exit timing, avoiding traps, and seizing the best opportunities to capture significant market moves.
This chart illustrates the application of the Power of Three concept to EURUSD price action, highlighting key phases of market behavior.
In this example, we observe the Daily candles, where a significant Bullish imbalance appears from previous days, forming a Fair Value Gap (FVG). Additionally, there’s a small Volume Imbalance (VI) at the candle's opening, signaling liquidity that the price needs to fill.
Now, focusing on the Weekly candle, we can clearly identify its phases. First, there's an accumulation phase around the opening price, which, as shown by the Daily candles, took some time to develop. Then, the manipulation phase occurs, signaled by the upper wick of the Weekly candle, which liquidates the previously created accumulation. It’s time to look for a potential selling position... Finally, the price falls, beginning to form its bearish body and completing the real move of the week.
This framework allows traders to better understand the market structure and make informed decisions based on the current cycle.
Standard Deviation (STD)
The Standard Deviation (STD) is a concept within the ICT methodology that focuses on identifying periods of consolidation within the market. Specifically, it examines the Central Bank Dealers Range (CBDR) , which occurs between 13:00 and 23:00 New York time. During this period, the market often exhibits consolidation , creating an environment where price action stabilizes before making significant moves.
This consolidation forms the basis of the Standard Deviation (STD) concept. This is based on the idea that the volatility observed during this consolidation phase can be used to anticipate future market volatility. Once this consolidation is identified, the STD framework duplicates the established range both above and below the consolidation area.
As price approaches these duplicated levels, it offers traders critical information on where to anticipate potential reactions. If the price nears the upper boundary of the consolidation, it suggests a potential reversal point, indicating an opportunity to consider selling. Conversely, if the price approaches the lower boundary, it may signal an opportunity to look for buying positions . This duplication could enable traders to determine potential high and low points for the trading day or week for example.
Finally, the Standard Deviation (STD) concept provides a valuable framework for identifying potential key reaction points in the market by leveraging consolidation within the CBDR. By duplicating these ranges, traders can anticipate significant price movements and refine their strategies.
This chart illustrates the Standard Deviation (STD) concept applied to EURUSD price action. The highlighted areas in blue indicate high duplications and low duplications derived from the consolidation identified during the Central Bank Dealing Range (CBDR), marked by the dark gray rectangle.
The high duplications represent potential resistance levels, suggesting areas where the price may encounter selling pressure, while the low duplications signify potential support levels, indicating where buying interest could emerge.
The annotations emphasize how price reacts at these duplicated levels, showing the critical role of the STD in determining where price movements may stall or reverse. In this example, the price responded perfectly to both an upward and a downward duplication, confirming that these levels could represent the day's high and low, an observation validated here. This highlights the precision of price movements, with the price stopping exactly at the full duplication levels (but we can not that the price could also have paused at the midline levels, indicated by the dashed gray lines).
This visualization helps traders anticipate potential reactions and align their strategies with market dynamics, ensuring informed decision-making based on established price behavior.
✨ SETTINGS
Imbalance Bar Colors / Zones: Choose to display FVGs, VIs, or both, with customizable color settings. Choose to extend zones or set them to be removed when mitigated.
PO3 Candles: Customize the PO3 Candles for different timeframes (Daily, Weekly, Monthly), including the calculation Mode (Classic or True Day Range) and timezone associated, and set your body, border, and wick preferred colors. The Imbalance Bar Color and FVG Zones can also be displayed on these HTF candles, as they are configured in their settings.
STD: Select the timeframe on which to base it and configure the number of duplications and midline settings. You can also define the time range and timezone related to consolidation detection, giving you control over when and where the STD should apply.
🎯 CONCLUSION
The Momentum Structures Indicator combines the core principles of ICT and Smart Money Concepts to provide traders with advanced tools for understanding market dynamics. By focusing on key elements like imbalances and liquidity zones, it offers a comprehensive framework for analyzing price behavior. This indicator empowers traders to identify key market phases, anticipate potential reversals, and refine their entry and exit points with precision. While its features provide a valuable edge, it’s essential to remember that none should be used on its own and many more factors go into being a profitable trader.
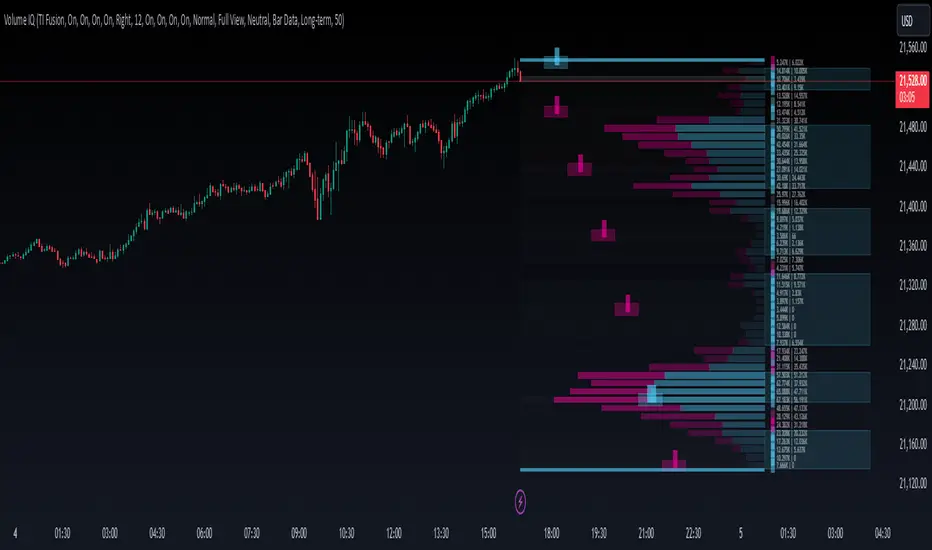
Volume IQOverview
Volume IQ is meant to be the ‘intelligent volume distribution analyzer’ that takes much of the work of interpreting volume profiles off of your shoulders. It attempts to ‘do the technical analysis’ of volume data for you, with its capstone feature being "Trading Action Zones": ranges on the chart whose placement are determined by high and low volume nodes and sentiment analysis, and their adapting range affected by current volatility. These zones are meant to offer practical levels for potential entries, exits, targets, and stops while trading. These zones are the cherry on top of other useful and original features like visuals for grouping areas of similar buy/sell bias.
Originality and Usefulness
Volume IQ stands out for its originality by offering a data-driven approach to interpreting volume profiles and presenting its analysis on the chart. Unlike traditional volume profiles, Volume IQ automates much of the volume analysis process, helping traders identify potential opportunities and key trading areas with minimal effort. Its unique "Trading Action Zones" leverage high and low volume nodes, sentiment analysis, and current volatility to highlight practical levels for entries, exits, targets, and stops. Additionally, the tool provides grouped bias visuals, gradient coloring, and flexible customization options, allowing traders to gain a clearer understanding of market sentiment and structure. By simplifying complex volume data into actionable insights, Volume IQ provides a valuable and efficient resource for charting on TradingView.
The ‘Capstone’ Feature:
Trading ‘Action Zones’: Potential areas to take trading action based on built-in interpretations of high-volume nodes, low-volume nodes, and overarching chart sentiment (whose calculation is described below), and their interplay. Categorized by tiers - with Tier 2 zones intended as potential entry areas, and Tier 1 zones for exits or adds. These zones can also present logical areas to consider targets and stops, for example placing a stop loss in a Tier 1 sell zone below price where there is a series of low-volume nodes and potentially not much support. These zones help you quickly identify potential areas on the chart to ‘take action’.
Key Features:
Level and Block Biases: By estimating buying and selling volume, as well as leveraging intrabar data, the Volume IQ profile provides detailed buy/sell sentiment at individual price levels. It then groups together consecutive price levels with the same bias into what we call ‘Block Biases’ making it easy to determine larger price areas with distinct buying or selling pressure.
Chart Sentiment Analysis: A ‘continuously optimizing algorithm’ configured to find high average runups after a sentiment switch powers what we call ‘bias guidelines’ which border the Volume IQ profile and influence the determination of Action Zones. This algorithm is based on comparing many combinations of volume-weighted trends, largely based on smoothed volume weighted moving averages, on each bar, to ensure that the approach with the highest average runup amongst the combinations is used.
Zones of Control: A gradient-coloring approach to the profile highlighst areas of influence at a glance, making it easier to focus on key price levels.
Broad Compatibility: Works across all chart timeframes and market types - so long as volume data and OHLC candle data is available.
Highly Customizable: Configure features to align with your trading preferences and workflow. Show them all, or pick and choose the ones you want.
Settings
Use a Color Theme: Toggle between our predefined color themes or customize your own.
Style: Select your preferred color theme (e.g., "TI Fusion").
Colors (When Not Using a Theme): Customize primary, secondary, and background colors for your own non-theme styling.
Gradient Coloring: Enable or disable gradient shading of the profile for visual enhancement of zones with high control and low control.
Action Zones: Turn trading action zones on or off to highlight key trading levels.
Time Staggering: Enabling this option will simply ‘stagger’ the display of action zones horizontally. Zones closer to price will be placed leftwards, and as they become more distant from price, they will be ‘staggered out’ rightwards, to give an intuitive feel for the time it may take for price to reach these zones.
Tier Labels: Enable or disable the ‘tier labels’ (1 square for Tier 1, 2 squares for Tier 2) for action zones.
Bias Blocks: Toggle the display of grouped buy/sell bias blocks.
Extend: Choose how the bias blocks are displayed: “Left” to stretch them from the end to the beginning of the histogram, “Right” to extend from the end outwards, and “Across” to extend from the beginning to outwards past the end, enveloping the bias and volume count labels.
Opacity: Adjust the transparency level of bias blocks (0–100).
Level Bias Labels: Turn on/off labels for individual price level biases.
Bias Guidelines: Enable the visual guidelines for bias levels which border the profile.
Volume Counts: Toggle volume count labels for each of the profile’s price levels.
Split Buy/Sell Volume: Enable separate display of buy and sell volume for each level (buy volume on the left, sell volume on the right).
Font Size: Adjust the font size for these labels.
Histogram Display: Choose the display option for the histogram bars of the profile themselves: "Full View" will display the profile, and “None” will hide it.
BG Shading Logic: Adjust the background shading logic for the display: “Neutral” will use the ‘Neutral Color’ from your color theme to put some emphasis around high and low volume nodes, while “None” will remove any background shading.
Detail: This option allows you to set the granularity of the volume data used: “Bar Data” will simply use the bar data from the chart timeframe, while “Intrabar Data” will attempt to use bar data from a lower timeframe. Please note that using intrabar data may not be available with your TradingView subscription on some timeframes, and also that using intrabar data may increase calculation time.
Data Request: Choose the lookback for the volume distribution: "Long-term" will look back 500 bars, and “Short-Term” will halve this.
# of Levels: Specify the number of levels/rows to display for visualizing the distribution.
Engulfing Pattern & Impulse [UAlgo]The Engulfing Pattern & Impulse is a tool designed for technical traders who utilize price action and volume analysis to assess market trends and potential reversals. This indicator identifies two powerful trading signals: Engulfing Patterns and Volume Impulses, which are essential components for evaluating potential bullish or bearish market momentum.
Engulfing Patterns are classic candlestick formations often associated with reversals or trend continuations, depending on the overall trend context. This indicator highlights both bullish and bearish engulfing patterns based on configurable criteria such as trend detection settings, comparison with average body size, and a customizable body multiplier for validation. The Volume Impulse feature signals moments of significant volume compared to historical levels, which often precede substantial price movements. Together, these features provide traders with a versatile tool for better timing entry and exit points.
The indicator also offers an adaptive trend detection system, allowing traders to choose from multiple methods (e.g., SMA50 or SMA50/SMA200 combinations) to assess the trend context, making it ideal for various market conditions.
🔶Key Features
Engulfing Pattern Detection: Identifies bullish and bearish engulfing patterns with customizable parameters, including body length and average size comparison.
Configurable trend basis: Choose between SMA50 or SMA50 with SMA200 to define trend direction.
Body size multiplier: Adjust the size threshold for valid engulfing patterns, providing flexibility based on market conditions.
Volume Impulse Signal: Highlights volume spikes that meet or exceed a specified multiplier, which can indicate increased buying or selling interest.
Customizable volume period and multiplier: Allows you to tailor the volume impulse detection based on the instrument’s average volume behavior.
Trend Detection Options: Select different trend detection methods to suit various trading styles and instruments.
SMA50-based detection: Classifies the trend based on the position of price relative to the 50-period SMA.
SMA50 and SMA200 combination: Incorporates a dual-moving average approach, classifying trends based on the relationship between price, SMA50, and SMA200.
Enhanced Visualization: Distinguishes bullish and bearish signals with customizable colors, providing clear and immediate visual cues for easy interpretation.
Custom label colors: Allows you to set distinct colors for bullish, bearish, and neutral signals for quick identification.
Pattern filtering: Enable or disable specific patterns (Bullish, Bearish, or Both) based on your trading preferences.
🔶 Interpreting Indicator
Bullish Engulfing Pattern: Indicates a potential bullish reversal in a downtrend. This signal occurs when a white candlestick with a body size exceeding a specified multiplier completely engulfs the previous black candlestick. The pattern will display a “BE” label below the candle if it meets the criteria, signaling potential upward momentum.
Bearish Engulfing Pattern: Indicates a potential bearish reversal in an uptrend. A black candlestick with a body size exceeding the specified multiplier fully engulfs the previous white candlestick, signaling possible downward movement. The “BE” label appears above the candle to denote this pattern.
Volume Impulse Up: Displays a “VI” label below the candle when the volume surpasses the defined multiplier, and the price closes higher than it opened, indicating strong upward buying interest.
Volume Impulse Down: Displays a “VI” label above the candle when the volume meets or exceeds the specified threshold, and the price closes lower than it opened, signaling strong selling pressure.
Indicator uses the SMA50 and SMA200 to determine trend direction due to their popularity in technical analysis as indicators of medium- and long-term trends. The SMA50 reflects the average price over the past 50 periods, providing insight into intermediate trends, while the SMA200 is often used to identify the broader trend direction. These SMAs help traders quickly assess whether the market is in an uptrend, downtrend, or consolidation phase, enhancing decision-making for both short-term and long-term strategies.
🔶 Disclaimer
Use with Caution: This indicator is provided for educational and informational purposes only and should not be considered as financial advice. Users should exercise caution and perform their own analysis before making trading decisions based on the indicator's signals.
Not Financial Advice: The information provided by this indicator does not constitute financial advice, and the creator (UAlgo) shall not be held responsible for any trading losses incurred as a result of using this indicator.
Backtesting Recommended: Traders are encouraged to backtest the indicator thoroughly on historical data before using it in live trading to assess its performance and suitability for their trading strategies.
Risk Management: Trading involves inherent risks, and users should implement proper risk management strategies, including but not limited to stop-loss orders and position sizing, to mitigate potential losses.
No Guarantees: The accuracy and reliability of the indicator's signals cannot be guaranteed, as they are based on historical price data and past performance may not be indicative of future results.

Volume Gaps and ImbalancesThis Pine script indicator is designed to visually depict price inefficiencies, as identified by Volume Imbalances (VI) or Gaps. A Volume Gap is a scenario where the wicks of two successive candles don’t intersect, while an Imbalance occurs when only the wicks overlap, leaving the bodies apart. These zones of inefficiency frequently act as magnets for price, with the market striving rebalance in accordance with ICT principles.
Relevance:
Volume Gaps/Imbalances are zones of highly inefficient price delivery as per ICT concepts and represent a very strong draw to price. Price will often seek to rebalance those zones to ensure efficient price delivery. Consequently, these zones can provide good targets for entries in the opposite direction or take profit targets for previous entries in the direction of the Gap/Imbalance.
How It Works:
The indicator keeps track of all Gaps/Imbalances from the beginning of the available history. It automatically removes all mitigated Gaps/Imbalances, which are situations where the price has at least reached the bottom of a bullish gap or the top of a bearish gap.
On the last bar, the most recent valid gaps are highlighted with a box drawn from the start to the end of the gap. The start of a bullish gap is determined by the highest price of the previous candle’s open or close, while for bearish gaps, it’s the lowest price of the previous candle’s open or close. Conversely, the end of a bullish gap is the lowest price of the current candle’s open or close, and for bearish gaps, it’s the highest price of the current candle’s open or close.
To enhance the indicator’s speed and minimize chart noise, only the most recent gaps will be displayed, up to the limit set in the indicator settings.
Each displayed VI/GAP will indicate the size of the imbalance in ticks. For imbalances greater than 3 ticks, which represent stronger draws of liquidity, the color transparency will be reduced, and the text will be made more prominent. Volume Gaps are also marked with a 🧲 emoji for easy visual identification.
The indicator will automatically extend the boxes representing valid imbalances to the current bar for as long as the imbalance is not mitigated.
If an imbalance has been tapped, but not mitigated, the indicator will append 🚩emoji to denote that the imbalance has been partially mitigated and may no longer have as strong of a draw for price.
Configurability:
A user may configure the number of imbalances to show, the setting applies to bullish/bearish imbalances individually. This setting can be set to any value from 1 – 50.
Appearance wise, color, style and color transparency of each box representing an imbalance can be configured. The imbalance box label can be configured by setting the text size, along with the vertical & horizontal alignment.
What makes this indicator different:
Designed with high performance in mind, to reduce impact on chart render time.
Only keeps valid imbalances on the chart, with a limit on the # drawn
Indicates the size of the gap and provides visual markets to denote stronger, weaker and partially mitigated gaps

Aggressor Volume ImbalanceAggressor volume imbalance represents the ratio between market aggressor buy volume (market buy orders) and market aggressor sell volume (market sell orders). This ratio enables traders to evaluate the interest of market aggressors and whether aggressive market activity favours the price's direction.
Analysing aggressor volume is critical in understanding market sentiment and aids in identifying shifts in momentum and potential exhaustion points in the market. When the aggressor buy volume significantly exceeds the sell volume, it typically indicates strong buying interest, driving prices higher if the offer-side liquidity cannot contain it, and vice versa.
How it Works
The imbalance ratio is calculated as follows, according to the selected session timeframe (see settings):
imbalance := ((buyVolumeAccumulator - sellVolumeAccumulator)
/ (buyVolumeAccumulator + sellVolumeAccumulator)) * 100
Aggressive Volume Imbalance uses lower timeframe historical data to calculate Historical Aggressor Volume Imbalances, while live data is used for live aggressor volume imbalances.
How to Use It
You can set the indicator to use any historical data timeframe you prefer. However, it is highly recommended to use lower timeframes (e.g., 1 second), as the lower the timeframe, the more granular the data.
The indicator resets to 0% whenever a new session timeframe begins (e.g., a new day) and calculates new values for the rest of the session. This can be configured in the settings.

ICT Institutional Order Flow (fadi)ICT Institutional Order Flow indicator is intended to provide wholistic view to better analyze order flow and where price may go to next. The concept follows ICT principles.
ICT Market Structure
ICT breaks down Pivot points into three categories:
Short Term High/Low (STH/STL) is a 3 candle pattern with a low with higher low on each side (STL), or a high with lower high on each side (STH)
Intermediate Term High/Low (ITH/ITL) uses the calculated STH/STL and marks any STH that has lower or STH on each side, and STL that has higher STL on each side
Long Term High/Low (LTH/LTL) uses the calculated ITH/ITL and marks any ITH that has lower or ITH on each side, and ITL that has higher ITL on each side
Note: ICT also states that if a STH wicks into and closes (almost?) a FVG, he marks it as ITH even if it does not have STH on reach side. This scenario is not covered by this indicator
Liquidity
liquidity is usually present under pivot points. The more prominent the pivot point, the more likely higher values liquidity pools reside under/above it. Liquidity under ITL and LTL as an example, will have better indication of which liquidity the price may seek next.
Displacement
Displacement registers above average move in the price resulting in strong visible move. If requiring a FVG is enabled (in settings), then the displacement could possibly (but never guaranteed) be used to visually recognize a move as it develops.
Full Credit: The calculation for Displacement is derived from TFO's Visualizing Displacement
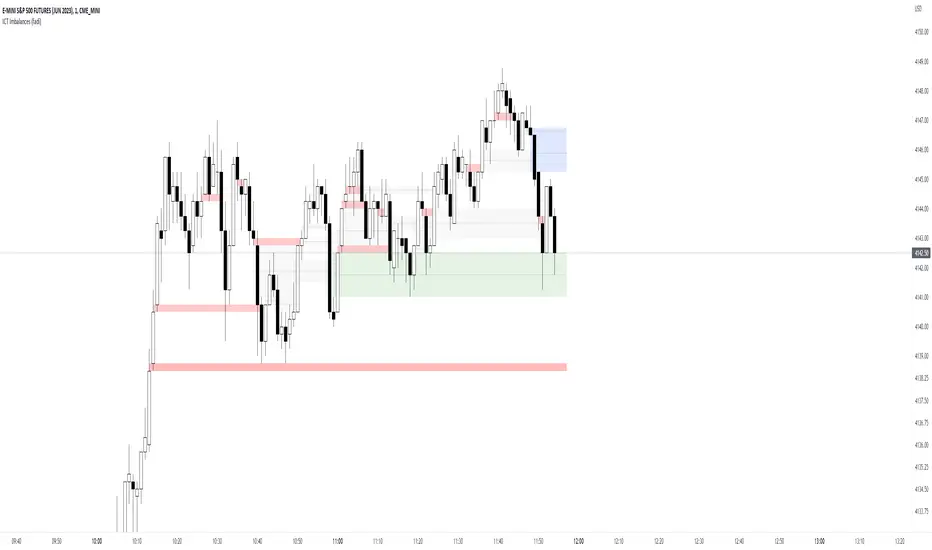
Imbalances
Imbalances can come in different forms. This indicator identifies three type of imbalances:
1. FVG
2. Volume Imbalance
3. Open Gaps
Imbalances completes the picture by help visualize strong moves, where possible pivot points may develop, and how to enter or manage a trade.

ICT HTF Candles (fadi)Plotting a configurable higher timeframe on current chart's timeframe helps visualize price movement without changing timeframes. It also plots FVG and Volume Imbalance on the higher timeframe for easier visualization.
With ICT concepts, we usually wait for HTF break of structure and then find an entry on a lower timeframe. With this indicator, we can set it to the HTF and watch the develop of price action until the break of structure happens. We can then take an entry on the current timeframe.
Settings
HTF Higher timeframe to plot
Number of candles to display The number of higher timeframe candles to display to the right of current price action
Body/Border/Wick The candle colors for the body, border, and wick
Padding from current candles The distance from current timeframe's candles
Space between candles Increase / decrease the candle spacing
Candle width The size of the candles
Imbalance
Fair Value Gap Show / Hide FVG on the higher timeframe
Volume Imbalance Show / Hide Volume Imbalance on the higher timeframe
Trace
Trace lines Extend the OHLC lines of the higher timeframe and the source of each
Label Show/Hide the price levels of the OHLC

ICT Imbalances (fadi)ICT Imbalances focuses on highlighting the imbalances described by ICT Se imbalances usually act as a price magnet where price tend to revisit to mitigate the imbalance and can act as support and resistance.
It is important to understand that, while they do act as price magnet, they are not all places for entries. What they do provide, is a price understanding and possible areas of reversal based on the bigger picture and trading strategy.
There are four types of imbalances covered by this indicator:
Fair Value Gap (FVG)
Fair value is when, at any given price, both buy and sell sides are offered. For every up move, there is a down move. Fair value Gap is an imbalance where price moved too quickly before offering both buy side and sell side at a given price.
Implied Fair Value Gap (IFVG)
Implied Fair Value Gap is when the first and third candle have overlapping large wicks. The IFVG is the area between the half point of first and third candles.
Volume Imbalance (V.I.)
Volume imbalance is when the price creates a gap between the close of one candle and the open of the following candle with overlapping wicks.
Gap
An area where price gaps up or down leaving a void where price did not trade in. This is most common on higher timeframes and when one day ends and the next day begins.
Settings
ICT Imbalances provides the following options
- Show or hide specific imbalance to keep the chart clean
- Background color of the box highlighting the imbalance
- Box width in the form of how many candles the box extends to
- Show or Hide the Half Mark of the box, only applies to FVG and IFVG
- Show or hide a Legend that explains which colors represents which imbalance
Smart Money Add-Ons [TFO]Supplementing my “Smart Money Essentials ” indicator, these add-ons provide some more commonly used “Smart Money Concepts,” including SMT Divergence, and HTF POI, and open price lines for added confluence.
Smart Money Technique (SMT) Divergence is meant to annotate divergence between closely correlated assets. Take $ES_F and $NQ_F for example (S&P 500 and Nasdaq 100 futures). These two names normally track each other very closely, but if $ES_F is steadily rising towards a large institutional level and making higher highs, while $NQ_F is approaching a similarly important level and making lower highs on that same timeframe, this would indicate a divergence between the two assets that could foreshadow a “Smart Money Reversal.”
Open price lines can provide intraday levels of interest from important times of day, where the defaults are set to midnight (12:00 AM), 8:30 AM for news releases, and 9:30 AM New York market open (New York local time). The open prices at these times can often act as support and resistance when other confluence factors are present. Higher timeframe points of interest (HTF POI) are also helpful to remain mindful of imbalances and other inefficiencies in which lower timeframe price action may create some reversal structure.

Weekly Opening Gap (cryptonnnite)In the context of general equities, opening price that is substantially higher or lower than the previous day's closing price, usually because of some extraordinarily positive or negative news. Opening gap using as a potential target which market usually trades to.

Imbalance Detector [LuxAlgo]This indicator detects and highlights market imbalances alongside a dashboard returning information about their frequency of occurrence and their fill percentage. Imbalances included in this script are Fair Value Gaps (FVG), Opening Gaps (OG) and Volume Imbalances (VI).
Alerts are available for the occurrences of all market imbalances.
Settings
Imbalances
Each imbalance has the same settings layout:
Imbalance: Enable/disable the detection of the specific imbalance.
Min Width: If enabled, requires the imbalance area width to be greater than the specified value. This minimum width can be expressed in points, percentages or ATR multiples.
Extend: Extend imbalances by a specified number of bars.
Dashboard
Show Dashboard: Enable/disable the dashboard on the chart.
Dashboard Location: Location of the dashboard on the chart.
Dashboard Size: Size of the dashboard.
Usage
Market imbalances are part of the many concepts available to price action traders and highlight areas where there is a disparity between supply and demand.
It is common to see price come back to these areas and traders often use them as supports and resistances but also as targets.
Details
The script can detect three distinct types of imbalances described below.
Fair Value Gaps
Fair Value Gaps (FVG) are three candle formations characterized by a gap between the wicks of the non-adjacent candles in the formation.
A bullish FVG is characterized by a gap between the current price low and the 2 bars anterior price high, and a bearish FVG is characterized by a gap between the current price high and the 2 bars anterior price low.
Opening Gaps
Opening Gaps (OG) are imbalances characterized by non-existent activity within a specific price range.
A bullish OG occurs when the current price low is greater than the previous high, a bearish OG occurs when price high is lower than the previous price low.
Opening Gaps primarily occur in closing markets, as such they are less common in the cryptocurrency market.
Most of the time an Opening Gap will also be accompanied by a Fair Value Gap, in order to avoid clutter the indicator will not detect Fair Value Gaps if Opening Gaps are enabled and if an Opening Gap has been detected
Volume Imbalances
Volume Imbalances (VI) are characterized by a price discontinuity between the opening price and previous close, but unlike Opening Gaps we do not see nonexistent activity within a certain price range.
A bullish VI occur when both the opening and closing prices are superior to the previous closing price, with the current price low overlapping the previous price high. A bearish VI occur when both the opening and closing prices are inferior to the previous closing price, with the current price high overlapping the previous price low.
Because Volume Imbalances can occur excessively on markets with frequent gaps, we make use of an additional condition for filtering out less significant imbalances. Bullish VI's will require the previous price high to be lower than the opening price, while bullish VI's will require the previous price low to be higher than the opening price.

ICT - GAPs and Volume Imbalance
GAPs
Gaps are areas on chart where the price have moved sharply up or down, with no trading in between. Gaps often fill, but they don't have to.
Volume Imbalance
Volume imbalance - determined using 2 candles
Bullish Volume Imbalance - area between the close of 1st candle and the open of 2nd candle
Bearish Volume Imbalance - area between the close of 1st candle and the open of 2nd candle
How to use the indicator:-
When you find imbalance in volume or a GAP in the chart, you may expect price to rebalance it before continuation.
Importantly, GAPs/Imbalances do not always fill. Traders should never assume that a gap/imbalance will fill without understanding the reasons for the gap and monitoring trading activity around the gap.
Pair it with your current bias for better results.
