Squeeze Go Momentum Pro [KingThies] █ OVERVIEW
The Squeeze Momentum Pro indicator identifies volatility compression phases and breakout opportunities by comparing Bollinger Bands to Keltner Channels. When price consolidates (squeeze), the bands contract inside the channels, signaling an imminent breakout. The momentum histogram shows directional bias, helping traders anticipate which way price will move when the squeeze releases.
This indicator displays in a separate panel below the price chart, providing clear visual signals without cluttering price action.
█ KEY FEATURES
Momentum Histogram
The histogram is the primary visual element, displaying momentum strength and direction with four distinct color states:
• Dark Green (#00C853) — Strong bullish momentum that is increasing. This signals strengthening upward pressure and potential continuation.
• Light Green (#26A69A) — Bullish momentum that is decreasing. Price remains in bullish territory but upward force is weakening.
• Dark Red (#D32F2F) — Strong bearish momentum that is increasing. This signals strengthening downward pressure and potential continuation.
• Light Red (#EF5350) — Bearish momentum that is decreasing. Price remains in bearish territory but downward force is weakening.
The color intensity provides immediate feedback on momentum strength and trend health.
Squeeze State Indicator
Colored dots on the zero line communicate the current volatility state:
• Orange Dots — Squeeze is ON. Bollinger Bands have contracted inside Keltner Channels, indicating consolidation and low volatility.
A breakout is building and traders should prepare for directional movement.
• Green Dots — Squeeze is OFF. Bollinger Bands have expanded outside Keltner Channels, indicating active momentum and higher volatility.
Price is moving with conviction in the current direction.
• Gray Dots — Neutral state. The bands are transitioning between squeeze states.
Release Triangles
Triangle shapes mark the exact bar when a squeeze releases, providing precise entry timing:
• Green Triangle Up — Bullish squeeze release. The squeeze has ended with positive momentum, suggesting a long setup opportunity.
• Red Triangle Down — Bearish squeeze release. The squeeze has ended with negative momentum, suggesting a short setup opportunity.
Information Panel
A compact dashboard in the top-right corner displays real-time trading intelligence:
• Squeeze Status — Current state: ON, OFF, or NEUTRAL with color coding
• Momentum Direction — Current bias: BULL or BEAR
• Momentum Value — Precise numerical reading of momentum strength
• Trading Signal — Actionable status: LONG SETUP, SHORT SETUP, WAIT, or MONITOR
Configurable Parameters
All calculation inputs are adjustable to match your trading style and timeframe:
• BB Length — Bollinger Bands period (default: 20)
• BB StdDev — Bollinger Bands standard deviation multiplier (default: 2.0)
• KC Length — Keltner Channels period (default: 20)
• KC ATR Multiplier — Keltner Channels range multiplier (default: 1.5)
• Momentum Length — Linear regression period for momentum calculation (default: 20)
Alert System
Four alert conditions notify you of critical trading opportunities:
• Bullish Squeeze Release — Squeeze has released with bullish momentum, indicating a potential long entry
• Bearish Squeeze Release — Squeeze has released with bearish momentum, indicating a potential short entry
• Squeeze Started — Volatility compression detected, prepare for upcoming breakout
• Squeeze Ended — Volatility expansion confirmed, breakout is active
█ TRADING METHODOLOGY
The indicator follows a clear four-step process for identifying and trading squeeze breakouts:
1 - Wait for Orange Dots . When orange dots appear on the zero line, a squeeze is building. This indicates price consolidation and declining volatility.
Do not enter trades during this phase. Instead, prepare by identifying key support and resistance levels and potential breakout directions.
2 - Watch for Release Triangle . When a triangle appears, the squeeze has released and a breakout is beginning. This is your entry signal.
The triangle color (green up or red down) combined with the histogram direction indicates the breakout direction.
3 - Confirm with Histogram Direction . Check the momentum histogram for directional confirmation:
• Green histogram + green triangle up = Go long. Bullish momentum supports upward breakout.
• Red histogram + red triangle down = Go short. Bearish momentum supports downward breakout.
4 - Monitor Momentum Intensity . Stay in the trade while histogram bars maintain their dark, intense color.
When colors lighten (dark green to light green, or dark red to light red), momentum is weakening and you should consider taking profits or tightening stops.
█ INTERPRETATION GUIDE
Squeeze Detection Logic
A squeeze occurs when Bollinger Bands contract inside Keltner Channels. This happens when:
• Standard deviation of price decreases (BB narrows)
• Price consolidates within a tight range
• Volatility compresses to unsustainable levels
The orange dots signal this condition, warning traders that explosive movement is imminent.
Squeeze Release Logic
A squeeze releases when Bollinger Bands expand outside Keltner Channels. This happens when:
• Price volatility increases sharply
• Price breaks out of consolidation
• Volume typically expands (check volume separately)
The green dots and release triangles signal this condition, indicating the direction and timing of the breakout.
Momentum Reading
The histogram uses linear regression to calculate momentum relative to the midpoint of the recent range:
• Above Zero : Price is trading above the range midpoint with bullish pressure
• Below Zero : Price is trading below the range midpoint with bearish pressure
• Increasing Bars : Momentum is strengthening in the current direction (darker color)
• Decreasing Bars : Momentum is weakening in the current direction (lighter color)
█ BEST PRACTICES
• Timeframe Selection — The indicator works on all timeframes but performs best on 15-minute to daily charts.
Lower timeframes may produce more false signals due to noise.
• Confluence Trading — Combine squeeze releases with support/resistance levels, trend lines, or other indicators for higher probability setups.
• Volume Confirmation — Check that squeeze releases occur with increasing volume. Low volume breakouts are more likely to fail.
• Multiple Timeframe Analysis — Check higher timeframes for overall trend direction. Trade squeeze releases that align with the larger trend.
• Parameter Adjustment — Increase BB and KC lengths for smoother signals on higher timeframes. Decrease for more sensitive signals on lower timeframes.
█ LIMITATIONS
• The indicator does not predict breakout direction before the squeeze releases. The momentum histogram provides bias but is not definitive until the breakout occurs.
• False breakouts can occur, particularly in choppy or low-volume market conditions. Always use proper risk management and stop losses.
• The indicator works best in trending markets. In deeply ranging markets with no clear direction, squeeze signals may be less reliable.
• Momentum calculations use linear regression which can lag during extremely fast price movements. Confirm signals with price action.
█ NOTES
This implementation uses linear regression for momentum calculation rather than simple moving averages, providing more responsive and accurate directional signals. The four-color histogram system gives traders nuanced feedback on momentum strength that binary color schemes cannot provide.
The indicator automatically adjusts to any symbol and timeframe without modification, making it suitable for stocks, forex, crypto, and futures markets.
█ CREDITS
Squeeze methodology inspired by John Carter's TTM Squeeze indicator. Momentum calculation and visual design optimized for modern trading workflows.
威廉姆斯震荡指标(WO)

RSI Optimized + 200MA FilterRSI Optimized + 200MA Filter with RSI, Williams %R, and QQE
This indicator combines multiple momentum and trend analysis tools to identify high-probability trade setups.
It includes:
• RSI (Relative Strength Index) optimized for short-term and swing trading signals.
• 200-period Moving Average Filter to determine long-term trend bias — trades are filtered based on whether price is above or below the 200MA.
• Williams %R for identifying overbought and oversold zones more responsively than RSI.
• QQE (Quantitative Qualitative Estimation) for smoothing RSI and confirming momentum strength.
Usage:
• Buy signals appear when RSI and QQE indicate upward momentum above the 200MA trend line.
• Sell signals appear when momentum weakens below 200MA or when RSI/Williams %R reach overbought extremes.
• The indicator can be applied to any asset or timeframe but performs best on 1H–4H charts.
Category: Relative Strength Indicators
Recommended for: Momentum traders, swing traders, and algorithmic strategy developers.

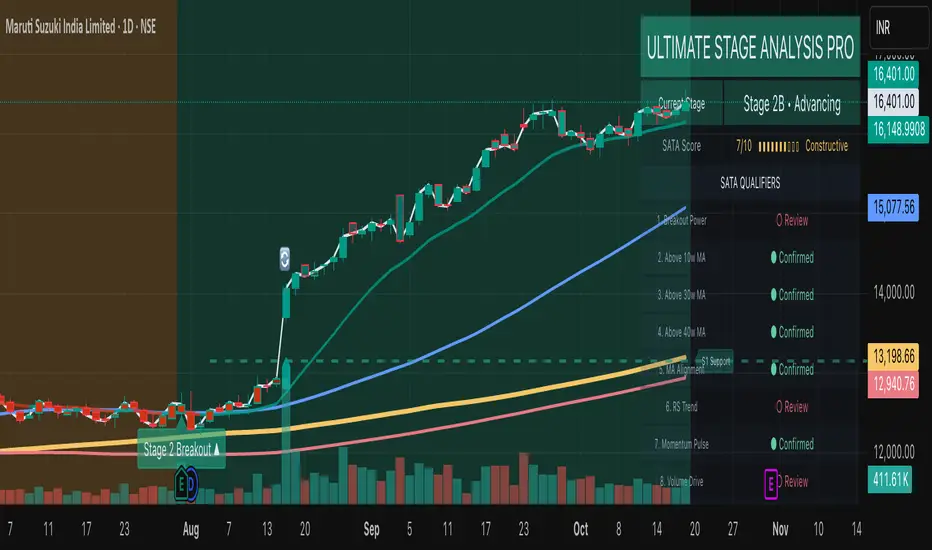
Ultimate Stage Analysis Pro
• Executive Overview
- Fuses Stan Weinstein Stage Analysis with Mark Minervini’s Trend Template inside a single institutional workflow tool.
- Computes dynamic stage/sub-stage logic with volume, slope, and relative-strength confirmations for disciplined regime detection.
- Surfaces a premium two-column dashboard that reads like a terminal panel, summarizing momentum, breadth, and risk inputs in real time.
- Built for multi-theme environments: “Institutional Dark” and “Institutional Light” palettes maintain clarity on any TradingView chart.
Stage & Structure Intelligence
- Classifies securities across Stage 1–4 with optional A/B sub-stages, applying slope, moving-average alignment, and ATR regime filters.
- Captures and extends key support/resistance zones (Stage 1 basing, Stage 3 topping) with contextual labels that adapt to the active stage.
- Tracks stage duration, re-sets on transitions, and retains entry references for risk and reward projections.
- Allows users to tune slope thresholds, lookbacks, and sub-stage durations to align with desk-specific playbooks.
Momentum & Leadership Scoring
- SATA (Stage Analysis Trend Acceleration) engine evaluates 10 institutional checkpoints: breakout quality, MA structure, RS trend, momentum, volume drive, and overhead supply.
- Minervini Trend Template scoring synthesizes 50/150/200-day relationships, 52-week positioning, and relative strength, outputting a 10-point gauge.
- Mansfield Relative Strength module auto-adjusts lookbacks per timeframe, emphasizing leadership versus a configurable benchmark.
- Dashboard renders progress bars and status indicators (“Confirmed” vs “Review”) for rapid institutional diligence.
Professional Visual Experience
- Theme-aware gradients, typography, and alternating row treatments provide maximum legibility without distracting glow.
- Price, moving averages, and background fills adopt cohesive accent tones tied to their respective stages for immediate context.
- Support/resistance labels, annotations, and volume cues inherit theme colors, keeping on-chart annotations minimal yet readable.
- Dashboard headers, separators, and icons guide the eye through workflow blocks: Stage summary, SATA qualifiers, Trend & Risk Metrics.
Alert Architecture
- Built-in alerts cover every structural regime change (Stage 1–Stage 4) so desks can automate watchlists and allocation shifts.
- Predictive Stage 2 setup alert monitors sub-stage evolution, SATA score, RS, and volume spikes to flag imminent breakouts.
- Stage 2 confirmation alert requires synchronized trend template, SATA strength, and volume thrust—ideal for deployment on high-conviction entries.
- Stage 2 weakening alert detects fading momentum (SATA drop, trend template degradation, MA breaches) to support risk reduction policy.
- Each alert is registered via alertcondition() for one-click activation in TradingView’s Alerts panel; optional alert() calls respect the user’s on-chart toggles.
Workflow Guidance
- Choose theme via Visual Theme input to match the underlying chart; adjust transparency if overlays stack with other studies.
- Enable dashboard for at-a-glance institutional readouts; hide it when screen real estate is limited or for export.
- SATA/Trend Template blocks can be toggled to focus on either Weinstein or Minervini methodologies independently.
- Use relative strength inputs (Benchmark Symbol, RS Period) to align the indicator with your investment universe (e.g., SPX, NDX, sector ETFs).
- Risk settings (Account Risk %, position sizing toggle) contextualize stop levels and risk/reward multipliers inside the dashboard.
- Combine with volume profile or market breadth overlays for a holistic Stage Analysis execution stack.
Tristan's Devil Mark (Short / Long, with W%R)The Devil’s Mark indicator is a visual tool designed to help traders identify potential short and long opportunities based on candle structure and market momentum. It combines price action analysis with the Williams %R (W%R) oscillator to highlight candles with high potential for reversal or continuation.
Can be used on any timeline, from scalping day trades to swing trades on daily and higher timelines. Know that the higher the timeline the less likely the indicator will show. (Asia and London sessions tend to show many indicators. I find this more useful for NY session.)
How the script works
Candle Structure Conditions
Short (Sell) Wedge: Plotted above green candles that have no bottom wick, indicating that inside that candle there was strong upward momentum without downside hesitation .
Long (Buy) Wedge: Plotted below red candles that have no top wick, indicating that inside that candle there was strong downward momentum without upside hesitation .
These candles are visually emphasized as wedges to mark potential turning points.
Williams %R Filter
The indicator uses Williams %R to measure overbought and oversold conditions:
Proximity to 0 (nearZeroThresh): Determines how close W%R must be to 0 (overbought) to trigger a Sell Wedge. This acts as a “Sell sensitivity” filter.
Proximity to -100 (nearHundredThresh): Determines how close W%R must be to -100 (oversold) to trigger a Buy Wedge. This acts as a “Buy sensitivity” filter.
When the candle meets both the candle structure and the W%R condition, the wedge is plotted in purple (“Within W%R Range”).
When the "ignore W%R filter" toggle is on, all eligible candles are plotted regardless of W%R. Wedges that normally would not meet W%R criteria are plotted in light purple (“Outside W%R Range”) to distinguish them. #YOLO (🚫 I recommend leaving "Ignore W%R Filter" OFF)
Settings Explained
Williams %R Length: The number of bars used to calculate the W%R oscillator. Shorter lengths make it more sensitive; longer lengths smooth the readings.
Proximity to 0 / 100: Controls how “strict” the indicator is in requiring overbought or oversold W%R conditions to trigger. Lower values mean closer to extreme zones, higher values are more permissive.
Ignore W%R Toggle: Option to show Devil’s Marks on every eligible candle regardless of W%R. Useful for visualizing purely price-action-based signals.
What the trader sees
Purple wedges: Candles meeting both candle structure and W%R conditions.
Light purple wedges: Candles meeting candle structure but ignored W%R (when toggle is on). #YOLO (🚫 I recommend leaving "Ignore W%R Filter" OFF)
Short opportunities are wedges above bars (green candles with no bottom wick).
Long opportunities are wedges below bars (red candles with no top wick).
Trading Insight
The Devil’s Mark is a momentum and reversal alert tool:
Look for purple downward-pointing wedges when W%R is near overbought. This is a potential shorting opportunity. Buying at the close of that candle may improve your short trades.
Look for purple upward-pointing wedges when W%R is near oversold. This is a potential
long opportunity. Buying at the close of that candle may improve your long trades.
Light purple wedges show the same price-action cues without W%R confirmation—useful for aggressive traders who want every potential setup. #YOLO #YMMV #noFullPort
Settings / Security
The “Output values” checkbox appears for each plotted series (like a plot or plotshape) and controls whether the series will also be exposed numerically in the Data Window or used by other indicators/scripts.
Here’s what it means in practice:
1. Checked (true)
The series values (like candle high, low, or any computed value) are exported to the Data Window and can be read by other scripts using request.security() or ta functions.
Example: You can see the exact numerical value of each plotted point in the Data Window when you hover over the chart.
Useful if you want to backtest or reference these plotted values programmatically.
2. Unchecked (false)
The series is plotted visually only.
The numeric values are hidden from the Data Window and cannot be accessed by other scripts.
Makes the chart cleaner if you don’t need the numeric outputs.

Larry Williams Oops StrategyThis strategy is a modern take on Larry Williams’ classic Oops setup. It trades intraday while referencing daily bars to detect opening gaps and align entries with the prior day’s direction. Risk is managed with day-based stops, and—unlike the original—all positions are closed at the end of the session (or at the last bar’s close), not at a fixed profit target or the first profitable open.
Entry Rules
Long setup (bullish reversion): Today opens below yesterday’s low (down gap) and yesterday’s candle was bearish. Place a buy stop at yesterday’s low + Filter (ticks).
Short setup (bearish reversion): Today opens above yesterday’s high (up gap) and yesterday’s candle was bullish. Place a sell stop at yesterday’s high − Filter (ticks).
Longs are only taken on down-gap days; shorts only on up-gap days.
Protective Stop
If long, stop loss trails the current day’s low.
If short, stop loss trails the current day’s high.
Exit Logic
Positions are force-closed at the end of the session (in the last bar), ensuring no overnight exposure. There is no take-profit; only stop loss or end-of-day flat.
Notes
This strategy is designed for intraday charts (minutes/seconds) using daily data for gaps and prior-day direction.
Longs/shorts can be enabled or disabled independently.

Larry Williams Bonus Track PatternThis strategy trades the day immediately following an Inside Day, under specific directional and timing conditions. It is designed for daily-based setups but executed on intraday charts to ensure orders are placed exactly at the open of the following day, rather than at the daily bar close.
Entry Conditions
Only trades on Monday, Thursday, or Friday.
The previous day must be an Inside Day (its high is lower than the prior high and its low is higher than the prior low).
The bar before the Inside Day must be bullish (close > open).
On the following day (t):
The daily open must be below both the Inside Day’s high and the highest high of the two days before that.
A buy stop is placed at the highest high of the three previous days (Inside Day and the two days before it).
If the new day’s open is already above that level (gap up), the strategy enters long immediately at the open.
Exit Rules
Stop Loss: Fixed, defined in points or percentage (user input).
FPO (First Profitable Open): the position is closed at the first daily open after the entry day where the open price is above the average entry price (the first profitable open).
Notes
The script must be applied on an intraday timeframe (e.g., 15-minute or 1-hour) so that the strategy can:
Detect the Inside Day pattern using daily data (request.security).
Execute orders in real time at the next day’s open.
Running it directly on the daily timeframe will delay executions by one bar due to Pine Script’s evaluation model.

Larry Williams - Smash Day (SL/TP in %)This strategy implements Larry Williams’ “Smash Day” reversal concept on any symbol and timeframe (daily is the classic). A Smash Day is a bar that closes beyond a recent extreme and then potentially reverses on the next session.

BanditExperimental %R and Moving Average Bands. This is just for fun :)
Comment below if you spot a good pattern to trade.

VIX BanditThis is a momentum indicator that identifies potential VIX bottoms by using seven configurable Williams %R oscillators simultaneously.
Green dots🟢appear below the bar when all %R series agree the VIX is extremely oversold.
Fuchsia dots🟣appear above the bar when VIX reverts to its long-term average (an EMA).
I hope this helps you spot moments of maximum optimism and trade the subsequent panic, somehow.

CuteWilly Oscillator_SKThis is a potent combination of Williams % R , EMA & SMA on Williams % R alongwith input from RSI as well. Gives very good picture of the trend, trend reversal and strength of the trend as well.

Williams %R smoothed🌍 English Description
Williams %R Smoothed – by Ján Salma
This is the first smoothed version of the Williams %R indicator published on TradingView.
The traditional Williams %R is a momentum oscillator that can be very choppy and noisy. Many traders find it hard to use because of the constant whipsaws.
This indicator solves that problem by applying an EMA smoothing on top of the raw Williams %R values.
Why is this special?
[* ]📉 Reduces noise → much cleaner signal, fewer false spikes.
🔍 Highlights real momentum shifts → easier to spot when the market truly changes direction.
🎯 Customizable smoothing → you decide how sensitive or smooth the curve should be.
⚡ Unique → currently, there is no other smoothed Williams %R available on TradingView.
Settings
Length → default 14 (standard Williams %R period).
Smoothing → default 3 EMA (smooths out the raw values).
Levels: -20 (overbought), -80 (oversold), -50 (mid-level).
This indicator is great for scalpers and swing traders who love Williams %R but hate the noise.
Now you can finally use %R with more confidence and clarity.
--------------------------------------------------------------------
Slovenský popis
Williams %R Smoothed – od Jána Salmu
Toto je prvá vyhladená verzia Williams %R indikátora publikovaná na TradingView.
Klasický Williams %R je oscilátor hybnosti, ktorý je často veľmi „roztrasený“ a plný šumu. Mnoho traderov s ním preto pracuje ťažko, pretože dáva veľa falošných signálov.
Tento indikátor to rieši tak, že na pôvodné hodnoty Williams %R aplikuje EMA vyhladenie .
Čo robí tento indikátor výnimočným?
📉 Redukuje šum → výsledná krivka je čistejšia, s menej falošnými výkyvmi.
🔍 Zvýrazňuje skutočné zmeny hybnosti → jasnejšie vidíš, kedy sa trh naozaj otáča.
🎯 Nastaviteľné vyhladenie → citlivosť indikátora si prispôsobíš podľa seba.
⚡ Unikát → na TradingView zatiaľ neexistuje žiadny iný vyhladený Williams %R.
Nastavenia
Dĺžka → predvolená hodnota 14 (štandardný Williams %R).
Smoothing (EMA) → predvolená hodnota 3 (vyhladenie krivky).
Úrovne: -20 (prekúpený trh), -80 (prepredaný trh), -50 (stredová hodnota).
Tento indikátor je skvelý pre scalperov aj swing traderov, ktorí majú radi Williams %R, ale chcú ho používať s väčšou presnosťou a prehľadnosťou.
ORB FVG Strategy with telegram V6.1Summary
Intraday NY-session strategy with Opening-Range bias (09:30–10:00 NY), FVG entries (incl. optional HTF FVGs), momentum filters (LinReg slope & Williams %R), limit entries inside the zone, SL from FVG anchors, and TP via risk-reward. Includes session/trade caps, pending-order handling, auto-cancel at NY time, and optional Telegram webhook alerts.
Feature Overview
Opening Range & Bias: OR high/low built until 10:00 NY, then frozen. Bias from confirmed 5-minute candles (modes: Body Close, Complete Candle, Wick Only).
FVG Scanner: Bull/bear FVGs (choose wick or body gaps), min size, auto-extend, mitigation cleanup (touch or 50%).
HTF FVG (10 min): Optional – displayed after ≥ 2 consecutive FVGs; cleans up on touch/50%.
Entry/SL/TP: Entry at X% fill (+extra %) within the FVG; SL from FVG candle / FVG-1 / FVG-2 (smart) + buffer; TP via risk-reward.
Momentum Filters: LinReg slope (MLL) + Williams %R with threshold/slope filters (individually switchable).
Intrabar Mode (optional): Immediate Open/intrabar entry on touch (calc_on_every_tick=true) or classic bar-close confirmation (toggle).
Trade Management: Max trades/day, pending cap, auto-cancel at defined NY time, pause after first winner (optional).
Telegram: Programmatic alerts via alert() with Telegram-ready JSON payload.
Parameters (compact)
Group Parameter Purpose
Sessions Trading session, Opening range Trading/OR window (internal NY TZ)
Bias Body Close / Complete Candle / Wick Only Bias confirmation relative to OR
Liquidity LQ session, lookback days, cleanup points, show lines Intraday liquidity marks & cleanup
FVG Min size, wick/body, colors, extend, cleanup Detection/visualization & validity
HTF FVG (10 m) Toggle/Display/Colors Conservative HTF filter/POI
Entry Fill %, extra %, max pending, validity (bars), cancel time, intrabar switch Execution timing, order caps, auto-cancel
Stop Loss Source: Candle / -1 / -2 (smart), buffer (points) SL anchor from FVG history + safety offset
Take Profit Risk-Reward (R:R) Target calculation
Momentum LinReg length/min slope, W%R length/min slope, HUD Trend/momentum filters
Trade Mgmt Max trades/day, pause after win Daily cap / risk cooldown
Telegram Enabled, tester, interval, channel id Webhook output & test signals
Debug & Info Debug panel, rejection reasons On-chart status/diagnostics
Alerts / Telegram Webhook (Quick Setup)
Create an alert with Condition: “Any alert() function call”.
Webhook URL: api.telegram.org
Message: leave empty (the strategy provides JSON via alert() – includes chat_id, parse_mode, text).
Ensure your bot can post to the channel and the chat_id is valid.
Repainting & Backtesting
HTF series via lookahead_off on closed higher-TF candles; FVG detection on confirmed bars (barstate.isconfirmed).
Intrabar/Open entries allow earlier fills but typically cause differences between backtest and live (tick granularity/slippage, limit touch on bar OHLC).
For reproducibility, trade without intrabar (bar-close only).
Limitations
No full tick simulation; limit fills rely on bar OHLC.
Liquidity “cleanup” is rule-based (not an orderbook).
Telegram depends on correct webhook configuration.
Tips
Timeframes: M5 (intrabar)
Start with modest R:R (e.g., 1.5–2.0) and tune filters carefully.
Disclaimer
No financial advice. Past results do not guarantee future performance. Use responsibly and follow Public Library rules.
License / Credits
© 2025 Lean Trading (Lennart Pomreinke). License: MPL-2.0.
Changelog
V06.1: Intrabar switch (Open/intrabar vs bar-close), Telegram sanitizer & tester, HTF-FVG cleanup, refined pending/cancel logic, debug panel (status & rejections).

Reversed Large Bars Strategy with Williams %RThis strategy script is ideal for volatile assets such as Natural Gas (NATGAS) or Crude Oil (WTI/Brent), which often exhibit strong price movements with high volume.
How It Works:
The strategy identifies short-term reversals after two consecutive large candles with significant volume, under specific conditions. It is based on the assumption that after strong directional moves, a temporary price exhaustion or reversal may occur.
Logic Breakdown:
Large Bar Detection:
A bar is considered “large” if its range (high – low) is significantly higher than the average (by a configurable percentage) and is accompanied by a spike in volume.
Two Consecutive Large Bars:
Entry is only considered when two large bars appear back-to-back — this strengthens the momentum signal.
Candle Type Filter:
For short entries: Two consecutive large bullish bars followed by a bullish candle → implies overextension upwards.
For long entries: Two consecutive large bearish bars followed by a bearish candle → implies overextension downwards.
Williams %R Filter:
The Williams %R oscillator adds confirmation based on overbought/oversold conditions:
Longs are allowed when %R is below the oversold level.
Shorts are allowed when %R is above the overbought level.
Ratio Logic:
A running percentage of bullish vs bearish large bars is tracked over a rolling period. This ensures entries are filtered based on broader context and trend dominance.
Stop Loss / Take Profit / Breakeven:
Each trade includes configurable SL/TP, and optional breakeven logic:
If unrealized profit exceeds a set percentage, SL is moved to entry (optionally with a buffer).

MACD Signal with Williams %R ColoringA simple fused indicator of 2, 1) MACD signal lines made colouring when 2) Williams % R is in overbought or oversold. not my own coding, just took two readily available indicators and coded them together.
Williams VIX For Bottoms [DCD]Williams VIX Original - Authentic Volatility Fear Gauge
What This Indicator Does
The Williams VIX Fix measures market fear by calculating how far current lows deviate from recent highs, identifying potential market bottoms during high volatility periods. This implementation provides Larry Williams' original formula in its purest form.
How It Works
Core Formula:
VIX Fix = ((Highest High over 22 periods - Current Low) / Highest High over 22 periods) × 100
The calculation process:
Measures Relative Distance: Compares current low to highest high over lookback period
Converts to Percentage: Normalizes values for cross-market comparison
Applies Statistical Analysis: Uses Bollinger Bands (2 std dev) around VIX Fix values
Filters with Percentiles: 85th percentile threshold removes noise
Signal Generation
Green Flash Signals trigger when either condition is met:
VIX Fix exceeds upper Bollinger Band (2 standard deviations above 20-period MA)
VIX Fix exceeds Range High (85th percentile of recent values)
This dual-condition approach reduces false signals while capturing genuine volatility spikes.
What Makes This Original
Pure Formula Implementation: Uses Williams' exact original calculation without modifications
Dual Confirmation System: Combines Bollinger Bands with percentile analysis
Professional Visualization: Histogram display, background highlighting, and live value table
Comprehensive Alerts: Signal start/end notifications plus Green Flash alerts
How to Use
Primary Purpose: Spot high-probability reversal zones during market fear climaxes
Signal Interpretation:
Green triangle + background highlight = High volatility reversal zone
Higher VIX Fix values = Stronger fear/better reversal potential
Use with price action confirmation for best results
Optimal Settings:
Timeframes: 4H, Daily, Weekly
Markets: All (stocks, crypto, forex, commodities)
Combine with support levels and candlestick patterns
Key Parameters:
VIX Fix Length (22): Lookback period for highest high
Std Dev Multiplier (2.0): Bollinger Band sensitivity
Percentile High (0.85): Only top 15% of readings trigger signals
The VIX Fix excels at identifying market fear climaxes that coincide with significant price bottoms, making it valuable for swing traders seeking high-probability entries during market stress.

Anomalous Holonomy Field Theory🌌 Anomalous Holonomy Field Theory (AHFT) - Revolutionary Quantum Market Analysis
Where Theoretical Physics Meets Trading Reality
A Groundbreaking Synthesis of Differential Geometry, Quantum Field Theory, and Market Dynamics
🔬 THEORETICAL FOUNDATION - THE MATHEMATICS OF MARKET REALITY
The Anomalous Holonomy Field Theory represents an unprecedented fusion of advanced mathematical physics with practical market analysis. This isn't merely another indicator repackaging old concepts - it's a fundamentally new lens through which to view and understand market structure .
1. HOLONOMY GROUPS (Differential Geometry)
In differential geometry, holonomy measures how vectors change when parallel transported around closed loops in curved space. Applied to markets:
Mathematical Formula:
H = P exp(∮_C A_μ dx^μ)
Where:
P = Path ordering operator
A_μ = Market connection (price-volume gauge field)
C = Closed price path
Market Implementation:
The holonomy calculation measures how price "remembers" its journey through market space. When price returns to a previous level, the holonomy captures what has changed in the market's internal geometry. This reveals:
Hidden curvature in the market manifold
Topological obstructions to arbitrage
Geometric phase accumulated during price cycles
2. ANOMALY DETECTION (Quantum Field Theory)
Drawing from the Adler-Bell-Jackiw anomaly in quantum field theory:
Mathematical Formula:
∂_μ j^μ = (e²/16π²)F_μν F̃^μν
Where:
j^μ = Market current (order flow)
F_μν = Field strength tensor (volatility structure)
F̃^μν = Dual field strength
Market Application:
Anomalies represent symmetry breaking in market structure - moments when normal patterns fail and extraordinary opportunities arise. The system detects:
Spontaneous symmetry breaking (trend reversals)
Vacuum fluctuations (volatility clusters)
Non-perturbative effects (market crashes/melt-ups)
3. GAUGE THEORY (Theoretical Physics)
Markets exhibit gauge invariance - the fundamental physics remains unchanged under certain transformations:
Mathematical Formula:
A'_μ = A_μ + ∂_μΛ
This ensures our signals are gauge-invariant observables , immune to arbitrary market "coordinate changes" like gaps or reference point shifts.
4. TOPOLOGICAL DATA ANALYSIS
Using persistent homology and Morse theory:
Mathematical Formula:
β_k = dim(H_k(X))
Where β_k are the Betti numbers describing topological features that persist across scales.
🎯 REVOLUTIONARY SIGNAL CONFIGURATION
Signal Sensitivity (0.5-12.0, default 2.5)
Controls the responsiveness of holonomy field calculations to market conditions. This parameter directly affects the threshold for detecting quantum phase transitions in price action.
Optimization by Timeframe:
Scalping (1-5min): 1.5-3.0 for rapid signal generation
Day Trading (15min-1H): 2.5-5.0 for balanced sensitivity
Swing Trading (4H-1D): 5.0-8.0 for high-quality signals only
Score Amplifier (10-200, default 50)
Scales the raw holonomy field strength to produce meaningful signal values. Higher values amplify weak signals in low-volatility environments.
Signal Confirmation Toggle
When enabled, enforces additional technical filters (EMA and RSI alignment) to reduce false positives. Essential for conservative strategies.
Minimum Bars Between Signals (1-20, default 5)
Prevents overtrading by enforcing quantum decoherence time between signals. Higher values reduce whipsaws in choppy markets.
👑 ELITE EXECUTION SYSTEM
Execution Modes:
Conservative Mode:
Stricter signal criteria
Higher quality thresholds
Ideal for stable market conditions
Adaptive Mode:
Self-adjusting parameters
Balances signal frequency with quality
Recommended for most traders
Aggressive Mode:
Maximum signal sensitivity
Captures rapid market moves
Best for experienced traders in volatile conditions
Dynamic Position Sizing:
When enabled, the system scales position size based on:
Holonomy field strength
Current volatility regime
Recent performance metrics
Advanced Exit Management:
Implements trailing stops based on ATR and signal strength, with mode-specific multipliers for optimal profit capture.
🧠 ADAPTIVE INTELLIGENCE ENGINE
Self-Learning System:
The strategy analyzes recent trade outcomes and adjusts:
Risk multipliers based on win/loss ratios
Signal weights according to performance
Market regime detection for environmental adaptation
Learning Speed (0.05-0.3):
Controls adaptation rate. Higher values = faster learning but potentially unstable. Lower values = stable but slower adaptation.
Performance Window (20-100 trades):
Number of recent trades analyzed for adaptation. Longer windows provide stability, shorter windows increase responsiveness.
🎨 REVOLUTIONARY VISUAL SYSTEM
1. Holonomy Field Visualization
What it shows: Multi-layer quantum field bands representing market resonance zones
How to interpret:
Blue/Purple bands = Primary holonomy field (strongest resonance)
Band width = Field strength and volatility
Price within bands = Normal quantum state
Price breaking bands = Quantum phase transition
Trading application: Trade reversals at band extremes, breakouts on band violations with strong signals.
2. Quantum Portals
What they show: Entry signals with recursive depth patterns indicating momentum strength
How to interpret:
Upward triangles with portals = Long entry signals
Downward triangles with portals = Short entry signals
Portal depth = Signal strength and expected momentum
Color intensity = Probability of success
Trading application: Enter on portal appearance, with size proportional to portal depth.
3. Field Resonance Bands
What they show: Fibonacci-based harmonic price zones where quantum resonance occurs
How to interpret:
Dotted circles = Minor resonance levels
Solid circles = Major resonance levels
Color coding = Resonance strength
Trading application: Use as dynamic support/resistance, expect reactions at resonance zones.
4. Anomaly Detection Grid
What it shows: Fractal-based support/resistance with anomaly strength calculations
How to interpret:
Triple-layer lines = Major fractal levels with high anomaly probability
Labels show: Period (H8-H55), Price, and Anomaly strength (φ)
⚡ symbol = Extreme anomaly detected
● symbol = Strong anomaly
○ symbol = Normal conditions
Trading application: Expect major moves when price approaches high anomaly levels. Use for precise entry/exit timing.
5. Phase Space Flow
What it shows: Background heatmap revealing market topology and energy
How to interpret:
Dark background = Low market energy, range-bound
Purple glow = Building energy, trend developing
Bright intensity = High energy, strong directional move
Trading application: Trade aggressively in bright phases, reduce activity in dark phases.
📊 PROFESSIONAL DASHBOARD METRICS
Holonomy Field Strength (-100 to +100)
What it measures: The Wilson loop integral around price paths
>70: Strong positive curvature (bullish vortex)
<-70: Strong negative curvature (bearish collapse)
Near 0: Flat connection (range-bound)
Anomaly Level (0-100%)
What it measures: Quantum vacuum expectation deviation
>70%: Major anomaly (phase transition imminent)
30-70%: Moderate anomaly (elevated volatility)
<30%: Normal quantum fluctuations
Quantum State (-1, 0, +1)
What it measures: Market wave function collapse
+1: Bullish eigenstate |↑⟩
0: Superposition (uncertain)
-1: Bearish eigenstate |↓⟩
Signal Quality Ratings
LEGENDARY: All quantum fields aligned, maximum probability
EXCEPTIONAL: Strong holonomy with anomaly confirmation
STRONG: Good field strength, moderate anomaly
MODERATE: Decent signals, some uncertainty
WEAK: Minimal edge, high quantum noise
Performance Metrics
Win Rate: Rolling performance with emoji indicators
Daily P&L: Real-time profit tracking
Adaptive Risk: Current risk multiplier status
Market Regime: Bull/Bear classification
🏆 WHY THIS CHANGES EVERYTHING
Traditional technical analysis operates on 100-year-old principles - moving averages, support/resistance, and pattern recognition. These work because many traders use them, creating self-fulfilling prophecies.
AHFT transcends this limitation by analyzing markets through the lens of fundamental physics:
Markets have geometry - The holonomy calculations reveal this hidden structure
Price has memory - The geometric phase captures path-dependent effects
Anomalies are predictable - Quantum field theory identifies symmetry breaking
Everything is connected - Gauge theory unifies disparate market phenomena
This isn't just a new indicator - it's a new way of thinking about markets . Just as Einstein's relativity revolutionized physics beyond Newton's mechanics, AHFT revolutionizes technical analysis beyond traditional methods.
🔧 OPTIMAL SETTINGS FOR MNQ 10-MINUTE
For the Micro E-mini Nasdaq-100 on 10-minute timeframe:
Signal Sensitivity: 2.5-3.5
Score Amplifier: 50-70
Execution Mode: Adaptive
Min Bars Between: 3-5
Theme: Quantum Nebula or Dark Matter
💭 THE JOURNEY - FROM IMPOSSIBLE THEORY TO TRADING REALITY
Creating AHFT was a mathematical odyssey that pushed the boundaries of what's possible in Pine Script. The journey began with a seemingly impossible question: Could the profound mathematical structures of theoretical physics be translated into practical trading tools?
The Theoretical Challenge:
Months were spent diving deep into differential geometry textbooks, studying the works of Chern, Simons, and Witten. The mathematics of holonomy groups and gauge theory had never been applied to financial markets. Translating abstract mathematical concepts like parallel transport and fiber bundles into discrete price calculations required novel approaches and countless failed attempts.
The Computational Nightmare:
Pine Script wasn't designed for quantum field theory calculations. Implementing the Wilson loop integral, managing complex array structures for anomaly detection, and maintaining computational efficiency while calculating geometric phases pushed the language to its limits. There were moments when the entire project seemed impossible - the script would timeout, produce nonsensical results, or simply refuse to compile.
The Breakthrough Moments:
After countless sleepless nights and thousands of lines of code, breakthrough came through elegant simplifications. The realization that market anomalies follow patterns similar to quantum vacuum fluctuations led to the revolutionary anomaly detection system. The discovery that price paths exhibit holonomic memory unlocked the geometric phase calculations.
The Visual Revolution:
Creating visualizations that could represent 4-dimensional quantum fields on a 2D chart required innovative approaches. The multi-layer holonomy field, recursive quantum portals, and phase space flow representations went through dozens of iterations before achieving the perfect balance of beauty and functionality.
The Balancing Act:
Perhaps the greatest challenge was maintaining mathematical rigor while ensuring practical trading utility. Every formula had to be both theoretically sound and computationally efficient. Every visual had to be both aesthetically pleasing and information-rich.
The result is more than a strategy - it's a synthesis of pure mathematics and market reality that reveals the hidden order within apparent chaos.
📚 INTEGRATED DOCUMENTATION
Once applied to your chart, AHFT includes comprehensive tooltips on every input parameter. The source code contains detailed explanations of the mathematical theory, practical applications, and optimization guidelines. This published description provides the overview - the indicator itself is a complete educational resource.
⚠️ RISK DISCLAIMER
While AHFT employs advanced mathematical models derived from theoretical physics, markets remain inherently unpredictable. No mathematical model, regardless of sophistication, can guarantee future results. This strategy uses realistic commission ($0.62 per contract) and slippage (1 tick) in all calculations. Past performance does not guarantee future results. Always use appropriate risk management and never risk more than you can afford to lose.
🌟 CONCLUSION
The Anomalous Holonomy Field Theory represents a quantum leap in technical analysis - literally. By applying the profound insights of differential geometry, quantum field theory, and gauge theory to market analysis, AHFT reveals structure and opportunities invisible to traditional methods.
From the holonomy calculations that capture market memory to the anomaly detection that identifies phase transitions, from the adaptive intelligence that learns and evolves to the stunning visualizations that make the invisible visible, every component works in mathematical harmony.
This is more than a trading strategy. It's a new lens through which to view market reality.
Trade with the precision of physics. Trade with the power of mathematics. Trade with AHFT.
I hope this serves as a good replacement for Quantum Edge Pro - Adaptive AI until I'm able to fix it.
— Dskyz, Trade with insight. Trade with anticipation.

Mandelbrot-Fibonacci Cascade Vortex (MFCV)Mandelbrot-Fibonacci Cascade Vortex (MFCV) - Where Chaos Theory Meets Sacred Geometry
A Revolutionary Synthesis of Fractal Mathematics and Golden Ratio Dynamics
What began as an exploration into Benoit Mandelbrot's fractal market hypothesis and the mysterious appearance of Fibonacci sequences in nature has culminated in a groundbreaking indicator that reveals the hidden mathematical structure underlying market movements. This indicator represents months of research into chaos theory, fractal geometry, and the golden ratio's manifestation in financial markets.
The Theoretical Foundation
Mandelbrot's Fractal Market Hypothesis Traditional efficient market theory assumes normal distributions and random walks. Mandelbrot proved markets are fractal - self-similar patterns repeating across all timeframes with power-law distributions. The MFCV implements this through:
Hurst Exponent Calculation: H = log(R/S) / log(n/2)
Where:
R = Range of cumulative deviations
S = Standard deviation
n = Period length
This measures market memory:
H > 0.5: Trending (persistent) behavior
H = 0.5: Random walk
H < 0.5: Mean-reverting (anti-persistent) behavior
Fractal Dimension: D = 2 - H
This quantifies market complexity, where higher dimensions indicate more chaotic behavior.
Fibonacci Vortex Theory Markets don't move linearly - they spiral. The MFCV reveals these spirals using Fibonacci sequences:
Vortex Calculation: Vortex(n) = Price + sin(bar_index × φ / Fn) × ATR(Fn) × Volume_Factor
Where:
φ = 0.618 (golden ratio)
Fn = Fibonacci number (8, 13, 21, 34, 55)
Volume_Factor = 1 + (Volume/SMA(Volume,50) - 1) × 0.5
This creates oscillating spirals that contract and expand with market energy.
The Volatility Cascade System
Markets exhibit volatility clustering - Mandelbrot's "Noah Effect." The MFCV captures this through cascading volatility bands:
Cascade Level Calculation: Level(i) = ATR(20) × φ^i
Each level represents a different fractal scale, creating a multi-dimensional view of market structure. The golden ratio spacing ensures harmonic resonance between levels.
Implementation Architecture
Core Components:
Fractal Analysis Engine
Calculates Hurst exponent over user-defined periods
Derives fractal dimension for complexity measurement
Identifies market regime (trending/ranging/chaotic)
Fibonacci Vortex Generator
Creates 5 independent spiral oscillators
Each spiral follows a Fibonacci period
Volume amplification creates dynamic response
Cascade Band System
Up to 8 volatility levels
Golden ratio expansion between levels
Dynamic coloring based on fractal state
Confluence Detection
Identifies convergence of vortex and cascade levels
Highlights high-probability reversal zones
Real-time confluence strength calculation
Signal Generation Logic
The MFCV generates two primary signal types:
Fractal Signals: Generated when:
Hurst > 0.65 (strong trend) AND volatility expanding
Hurst < 0.35 (mean reversion) AND RSI < 35
Trend strength > 0.4 AND vortex alignment
Cascade Signals: Triggered by:
RSI > 60 AND price > SMA(50) AND bearish vortex
RSI < 40 AND price < SMA(50) AND bullish vortex
Volatility expansion AND trend strength > 0.3
Both signals implement a 15-bar cooldown to prevent overtrading.
Advanced Input System
Mandelbrot Parameters:
Cascade Levels (3-8):
Controls number of volatility bands
Crypto: 5-7 (high volatility)
Indices: 4-5 (moderate volatility)
Forex: 3-4 (low volatility)
Hurst Period (20-200):
Lookback for fractal calculation
Scalping: 20-50
Day Trading: 50-100
Swing Trading: 100-150
Position Trading: 150-200
Cascade Ratio (1.0-3.0):
Band width multiplier
1.618: Golden ratio (default)
Higher values for trending markets
Lower values for ranging markets
Fractal Memory (21-233):
Fibonacci retracement lookback
Uses Fibonacci numbers for harmonic alignment
Fibonacci Vortex Settings:
Spiral Periods:
Comma-separated Fibonacci sequence
Fast: "5,8,13,21,34" (scalping)
Standard: "8,13,21,34,55" (balanced)
Extended: "13,21,34,55,89" (swing)
Rotation Speed (0.1-2.0):
Controls spiral oscillation frequency
0.618: Golden ratio (balanced)
Higher = more signals, more noise
Lower = smoother, fewer signals
Volume Amplification:
Enables dynamic spiral expansion
Essential for stocks and crypto
Disable for forex (no central volume)
Visual System Architecture
Cascade Bands:
Multi-level volatility envelopes
Gradient coloring from primary to secondary theme
Transparency increases with distance from price
Fill between bands shows fractal structure
Vortex Spirals:
5 Fibonacci-period oscillators
Blue above price (bullish pressure)
Red below price (bearish pressure)
Multiple display styles: Lines, Circles, Dots, Cross
Dynamic Fibonacci Levels:
Auto-updating retracement levels
Smart update logic prevents disruption near levels
Distance-based transparency (closer = more visible)
Updates every 50 bars or on volatility spikes
Confluence Zones:
Highlighted boxes where indicators converge
Stronger confluence = stronger support/resistance
Key areas for reversal trades
Professional Dashboard System
Main Fractal Dashboard: Displays real-time:
Hurst Exponent with market state
Fractal Dimension with complexity level
Volatility Cascade status
Vortex rotation impact
Market regime classification
Signal strength percentage
Active indicator levels
Vortex Metrics Panel: Shows:
Individual spiral deviations
Convergence/divergence metrics
Real-time vortex positioning
Fibonacci period performance
Fractal Metrics Display: Tracks:
Dimension D value
Market complexity rating
Self-similarity strength
Trend quality assessment
Theory Guide Panel: Educational reference showing:
Mandelbrot principles
Fibonacci vortex concepts
Dynamic trading suggestions
Trading Applications
Trend Following:
High Hurst (>0.65) indicates strong trends
Follow cascade band direction
Use vortex spirals for entry timing
Exit when Hurst drops below 0.5
Mean Reversion:
Low Hurst (<0.35) signals reversal potential
Trade toward vortex spiral convergence
Use Fibonacci levels as targets
Tighten stops in chaotic regimes
Breakout Trading:
Monitor cascade band compression
Watch for vortex spiral alignment
Volatility expansion confirms breakouts
Use confluence zones for targets
Risk Management:
Position size based on fractal dimension
Wider stops in high complexity markets
Tighter stops when Hurst is extreme
Scale out at Fibonacci levels
Market-Specific Optimization
Cryptocurrency:
Cascade Levels: 5-7
Hurst Period: 50-100
Rotation Speed: 0.786-1.2
Enable volume amplification
Stock Indices:
Cascade Levels: 4-5
Hurst Period: 80-120
Rotation Speed: 0.5-0.786
Moderate cascade ratio
Forex:
Cascade Levels: 3-4
Hurst Period: 100-150
Rotation Speed: 0.382-0.618
Disable volume amplification
Commodities:
Cascade Levels: 4-6
Hurst Period: 60-100
Rotation Speed: 0.5-1.0
Seasonal adjustment consideration
Innovation and Originality
The MFCV represents several breakthrough innovations:
First Integration of Mandelbrot Fractals with Fibonacci Vortex Theory
Unique synthesis of chaos theory and sacred geometry
Novel application of Hurst exponent to spiral dynamics
Dynamic Volatility Cascade System
Golden ratio-based band expansion
Multi-timeframe fractal analysis
Self-adjusting to market conditions
Volume-Amplified Vortex Spirals
Revolutionary spiral calculation method
Dynamic response to market participation
Multiple Fibonacci period integration
Intelligent Signal Generation
Cooldown system prevents overtrading
Multi-factor confirmation required
Regime-aware signal filtering
Professional Analytics Dashboard
Institutional-grade metrics display
Real-time fractal analysis
Educational integration
Development Journey
Creating the MFCV involved overcoming numerous challenges:
Mathematical Complexity: Implementing Hurst exponent calculations efficiently
Visual Clarity: Displaying multiple indicators without cluttering
Performance Optimization: Managing array operations and calculations
Signal Quality: Balancing sensitivity with reliability
User Experience: Making complex theory accessible
The result is an indicator that brings PhD-level mathematics to practical trading while maintaining visual elegance and usability.
Best Practices and Guidelines
Start Simple: Use default settings initially
Match Timeframe: Adjust parameters to your trading style
Confirm Signals: Never trade MFCV signals in isolation
Respect Regimes: Adapt strategy to market state
Manage Risk: Use fractal dimension for position sizing
Color Themes
Six professional themes included:
Fractal: Balanced blue/purple palette
Golden: Warm Fibonacci-inspired colors
Plasma: Vibrant modern aesthetics
Cosmic: Dark mode optimized
Matrix: Classic green terminal
Fire: Heat map visualization
Disclaimer
This indicator is for educational and research purposes only. It does not constitute financial advice. While the MFCV reveals deep market structure through advanced mathematics, markets remain inherently unpredictable. Past performance does not guarantee future results.
The integration of Mandelbrot's fractal theory with Fibonacci vortex dynamics provides unique market insights, but should be used as part of a comprehensive trading strategy. Always use proper risk management and never risk more than you can afford to lose.
Acknowledgments
Special thanks to Benoit Mandelbrot for revolutionizing our understanding of markets through fractal geometry, and to the ancient mathematicians who discovered the golden ratio's universal significance.
"The geometry of nature is fractal... Markets are fractal too." - Benoit Mandelbrot
Revealing the Hidden Order in Market Chaos Trade with Mathematical Precision. Trade with MFCV.
— Created with passion for the TradingView community
Trade with insight. Trade with anticipation.
— Dskyz , for DAFE Trading Systems

Swing High/Low by %REnglish Description
Swing High/Low by %R
This indicator identifies potential swing high and swing low points by combining William %R overbought/oversold turning points with classic swing price structures.
Swing High: Detected when William %R turns down from overbought territory and the price forms a local high (higher than both neighboring bars).
Swing Low: Detected when William %R turns up from oversold territory and the price forms a local low (lower than both neighboring bars).
This tool is designed to help traders spot possible market reversals and better time their entries and exits.
Customizable parameters:
Williams %R period
Overbought & Oversold thresholds
The indicator plots clear signals above/below price bars for easy visualization.
For educational purposes. Please use with proper risk management!
คำอธิบายภาษาไทย
Swing High/Low by %R
อินดิเคเตอร์นี้ใช้ระบุจุด Swing High และ Swing Low ที่มีโอกาสเป็นจุดกลับตัวของตลาด โดยอาศัยสัญญาณจาก William %R ที่พลิกกลับตัวบริเวณ overbought/oversold ร่วมกับโครงสร้างราคาแบบ swing
Swing High: เกิดเมื่อ William %R พลิกกลับลงจากเขต Overbought และราคาแท่งกลางสูงกว่าทั้งสองแท่งข้างเคียง
Swing Low: เกิดเมื่อ William %R พลิกกลับขึ้นจากเขต Oversold และราคาแท่งกลางต่ำกว่าทั้งสองแท่งข้างเคียง
ช่วยให้เทรดเดอร์สามารถมองเห็นโอกาสในการกลับตัวของราคา และใช้ประกอบการวางแผนจังหวะเข้าหรือออกจากตลาดได้อย่างแม่นยำมากขึ้น
ตั้งค่าได้:
ระยะเวลา Williams %R
ค่าขอบเขต Overbought & Oversold
อินดิเคเตอร์จะแสดงสัญลักษณ์อย่างชัดเจนบนกราฟเพื่อความสะดวกในการใช้งาน
ควรใช้ร่วมกับการบริหารความเสี่ยง

WMB Oscillator | [DeV]The "WMB Oscillator" indicator is a multi-factor momentum and volatility indicator designed to give traders a dynamic edge in identifying trend strength, market pressure, and potential turning points. By combining three powerful tools—Williams %R, Money Flow Index, and Bollinger Band Width—this oscillator presents a single histogram that visually represents the interplay between overbought/oversold levels, volume-weighted pressure, and volatility expansion. Use it to anticipate trend shifts, confirm entries, or avoid traps in ranging markets.
Williams %R:
Williams %R measures the closing price's position relative to the recent high-low range over a defined period. It outputs a value between 0 and -100, where values closer to -100 suggest oversold conditions, and those near 0 indicate overbought. In this oscillator, the raw %R is normalized between your defined overbought and oversold thresholds, allowing it to integrate seamlessly into the combined signal without distortion from price scale differences.
Money Flow Index (MFI):
The MFI gauges buying and selling pressure using both price and volume. It calculates the typical price for each bar, multiplies it by volume, and compares positive versus negative money flows over time. Normalized between your custom thresholds, the MFI component helps highlight when a move is driven by real conviction (volume) rather than weak price fluctuation, enhancing the signal’s reliability.
Bollinger Band Width (BB Width):
BB Width quantifies volatility by measuring the percentage difference between the upper and lower Bollinger Bands relative to their moving average. When volatility contracts, BB Width narrows—often preceding explosive moves. When it expands, volatility is peaking. Here, the raw BB Width is detrended using its moving average and scaled with a user-defined multiplier to reflect its deviation strength.
Why Combine These:
Each of these three metrics captures a unique dimension of market behavior: %R tracks momentum in price extremes, MFI confirms the move’s strength through volume, and BB Width anticipates volatility surges. Combined, they form a balanced oscillator that reacts fluidly to market changes while filtering out noise. The result is a nuanced, multi-angle view of the market's internal dynamics, enabling smarter, more confident trading decisions.

True Seasonal Pattern [tradeviZion]True Seasonal Pattern: Uncover Hidden Market Cycles
Markets have rhythms and patterns that repeat with surprising regularity. The True Seasonal Pattern indicator reveals these hidden cycles across different timeframes, helping you anticipate potential market movements based on historical seasonal tendencies.
What This Indicator Does
The True Seasonal Pattern analyzes years of historical price data to identify recurring seasonal trends. It then plots these patterns on your chart, showing you both the historical pattern and future projection based on past seasonal behavior.
Automatic Timeframe Detection: Works with Monthly, Weekly, and Daily charts
Historical Pattern Analysis: Analyzes up to 100 years of data (customizable)
Future Projection: Projects the seasonal pattern ahead on your chart
Smart Smoothing: Applies appropriate smoothing based on your timeframe
How to Use This Indicator
Add the indicator to a Daily, Weekly, or Monthly chart (not designed for intraday timeframes)
The indicator automatically detects your chart's timeframe
The blue line shows the historical seasonal pattern
Watch for potential turning points in the pattern that align with other technical signals
Seasonal patterns work best as a supporting factor in your analysis, not as standalone trading signals. They are particularly effective in markets with well-established seasonal influences.
Best Applications
Futures Markets: Commodities and futures often show strong seasonal tendencies due to production cycles, weather patterns, and economic factors
Stock Indices: Many stock markets demonstrate regular seasonal patterns (like the "Sell in May" phenomenon)
Individual Stocks: Companies with seasonal business cycles often show predictable price patterns
Practical Applications
Identify potential turning points based on historical seasonal patterns
Plan entries and exits around seasonal tendencies
Add seasonal context to your existing technical analysis
Understand why certain months or periods might show consistent behavior
Pro Tip: For best results, use this tool on instruments with at least 5+ years of historical data. Longer timeframes often reveal more reliable seasonal patterns.
Important Notes
This indicator works best on Daily, Weekly, and Monthly timeframes - not intraday charts
Seasonal patterns are tendencies, not guarantees
Always combine seasonal analysis with other technical tools
Past patterns may not repeat exactly in the future
// Sample of the seasonal calculation approach
float yearHigh = array.max(currentYearHighs)
float yearLow = array.min(currentYearLows)
// Calculate seasonality for each period
for i = 0 to array.size(currentYearCloses) - 1
float periodClose = array.get(currentYearCloses, i)
if not na(periodClose) and yearHigh != yearLow
float seasonality = (periodClose - yearLow) / (yearHigh - yearLow) * 100
I developed this indicator to help traders incorporate seasonal analysis into their trading approach without the complexity of traditional seasonal tools. Whether you're analyzing agricultural commodities, energy futures, or stock indices, understanding the seasonal context can provide valuable insights for your trading decisions.
Remember: Markets don't always follow seasonal patterns, but when they do, being aware of these tendencies can give you a meaningful edge in your analysis.

Williams R Zone Scalper v1.0[BullByte]Originality & Usefulness
Unlike standard Williams R cross-over scripts, this strategy layers five dynamic filters—moving-average trend, Supertrend, Choppiness Index, Bollinger Band Width, and volume validation —and presents a real-time dashboard with equity, PnL, filter status, and key indicator values. No other public Pine script combines these elements with toggleable filters and a custom dashboard. In backtests (BTC/USD (Binance), 5 min, 24 Mar 2025 → 28 Apr 2025), adding these filters turned a –2.09 % standalone Williams R into a +5.05 % net winner while cutting maximum drawdown in half.
---
What This Script Does
- Monitors Williams R (length 14) for overbought/oversold reversals.
- Applies up to five dynamic filters to confirm trend strength and volatility direction:
- Moving average (SMA/EMA/WMA/HMA)
- Supertrend line
- Choppiness Index (CI)
- Bollinger Band Width (BBW)
- Volume vs. its 50-period MA
- Plots blue arrows for Long entries (R crosses above –80 + all filters green) and red arrows for Short entries (R crosses below –20 + all filters green).
- Optionally sets dynamic ATR-based stop-loss (1.5×ATR) and take-profit (2×ATR).
- Shows a dashboard box with current position, equity, PnL, filter status, and real-time Williams R / MA/volume values.
---
Backtest Summary (BTC/USD(Binance), 5 min, 24 Mar 2025 → 28 Apr 2025)
• Total P&L : +50.70 USD (+5.05 %)
• Max Drawdown : 31.93 USD (3.11 %)
• Total Trades : 198
• Win Rate : 55.05 % (109/89)
• Profit Factor : 1.288
• Commission : 0.01 % per trade
• Slippage : 0 ticks
Even in choppy March–April, this multi-filter approach nets +5 % with a robust risk profile, compared to –2.09 % and higher drawdown for Williams R alone.
---
Williams R Alone vs. Multi-Filter Version
• Total P&L :
– Williams R alone → –20.83 USD (–2.09 %)
– Multi-Filter → +50.70 USD (+5.05 %)
• Max Drawdown :
– Williams R alone → 62.13 USD (6.00 %)
– Multi-Filter → 31.93 USD (3.11 %)
• Total Trades : 543 vs. 198
• Win Rate : 60.22 % vs. 55.05 %
• Profit Factor : 0.943 vs. 1.288
---
Inputs & What They Control
- wrLen (14): Williams R look-back
- maType (EMA): Trend filter type (SMA, EMA, WMA, HMA)
- maLen (20): Moving-average period
- useChop (true): Toggle Choppiness Index filter
- ciLen (12): CI look-back length
- chopThr (38.2): CI threshold (below = trending)
- useVol (true): Toggle volume-above-average filter
- volMaLen (50): Volume MA period
- useBBW (false): Toggle Bollinger Band Width filter
- bbwMaLen (50): BBW MA period
- useST (false): Toggle Supertrend filter
- stAtrLen (10): Supertrend ATR length
- stFactor (3.0): Supertrend multiplier
- useSL (false): Toggle ATR-based SL/TP
- atrLen (14): ATR period for SL/TP
- slMult (1.5): SL = slMult × ATR
- tpMult (2.0): TP = tpMult × ATR
---
How to Read the Chart
- Blue arrow (Long): Williams R crosses above –80 + all enabled filters green
- Red arrow (Short) : Williams R crosses below –20 + all filters green
- Dashboard box:
- Top : position and equity
- Next : cumulative PnL in USD & %
- Middle : green/white dots for each filter (green=passing, white=disabled)
- Bottom : Williams R, MA, and volume current values
---
Usage Tips
- Add the script : Indicators → My Scripts → Williams R Zone Scalper v1.0 → Add to BTC/USD chart on 5 min.
- Defaults : Optimized for BTC/USD.
- Forex majors : Raise `chopThr` to ~42.
- Stocks/high-beta : Enable `useBBW`.
- Enable SL/TP : Toggle `useSL`; stop-loss = 1.5×ATR, take-profit = 2×ATR apply automatically.
---
Common Questions
- * Why not trade every Williams R reversal?*
Raw Williams R whipsaws in sideways markets. Choppiness and volume filters reduce false entries.
- *Can I use on 1 min or 15 min?*
Yes—adjust ATR length or thresholds accordingly. Defaults target 5 min scalping.
- *What if all filters are on?*
Fewer arrows, higher-quality signals. Expect ~10 % boost in average win size.
---
Disclaimer & License
Trading carries risk of loss. Use this script “as is” under the Mozilla Public License 2.0 (mozilla.org). Always backtest, paper-trade, and adjust risk settings to your own profile.
---
Credits & References
- Pine Script v6, using TradingView’s built-in `ta.supertrend()`.
- TradingView House Rules: www.tradingview.com
Goodluck!
BullByte

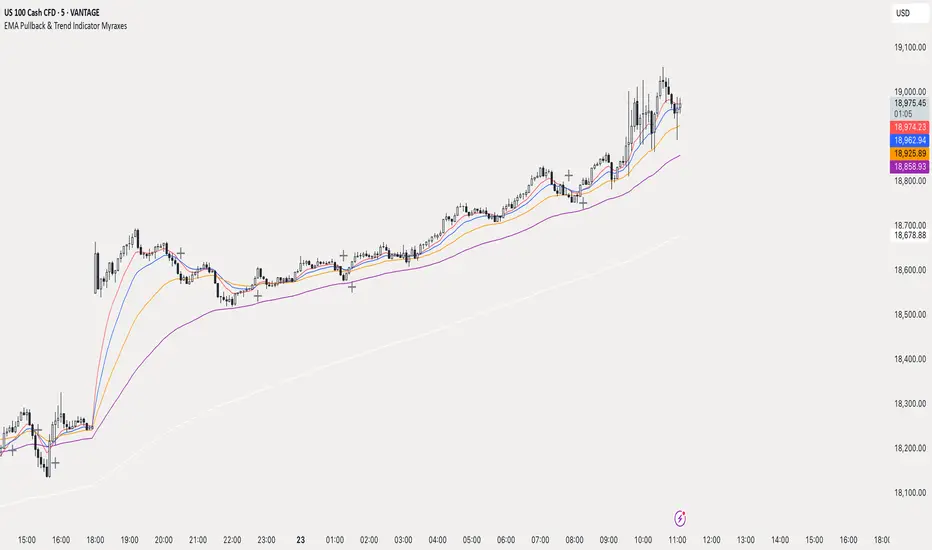
EMA Pullback & Trend Indicator MyraxesEMA Pullback & Trend Indicator by Max Retri
Plots five EMAs—9, 15, 30, 65 and 200—and draws clean, easy-to-interpret signals when the fast EMAs cross in the direction of the longer-term trend. No other indicators or overlays are required; simply add it to your chart and watch for the arrows and crosses.
⸻
What It Does & How It Works
1. EMAs & Colors
• Red (EMA 9) – Fast signal line
• Blue (EMA 15) – Confirmation line
• Orange (EMA 30) – Pullback zone 1
• Purple (EMA 65) – Pullback zone 2 & mid-term trend
• White (EMA 200) – Long-term trend
2. Trend Filter
• Bullish regime when price is above both EMA 65 and EMA 200.
• Bearish regime when price is below both EMA 65 and EMA 200.
3. Pullback Requirement
• Only consider a signal if price has retraced into the EMA 30 or EMA 65 zone.
4. Signal Logic
Long Entry ▲: EMA 9 (red) crosses above EMA 15 (blue) while in a bullish regime and after a pullback into EMA 30/65.
Short Entry ▼: EMA 9 crosses below EMA 15 while in a bearish regime and after a retracement up to EMA 30/65.
Exit ✖: Opposite EMA 9/15 crossover marks the close of the position.
⸻
How to Use
1. Add the indicator to any chart/timeframe.
2. Identify trend: make sure price is aligned above or below the 65 and 200 EMAs.
3. Watch for pullbacks into the orange or purple EMAs.
4. Enter on the black ▲ or ▼ arrow.
5. Exit when you see the gray ✖ cross.
Because it’s a pure‐EMA indicator (no heavy calculations), it runs quickly even on lower-end machines.
TriTrend Nexus[BullByte]TriTrend Nexus is a comprehensive market analysis tool that consolidates three well-established signals into a single, easy-to-read interface. It is designed to help traders quickly assess the market’s current condition and make more informed decisions about potential trend shifts.
Key Features and Functionality
Composite Signal System
Multi-Faceted Approach :
The indicator combines insights from three distinct market signals into one composite score. This approach provides a more holistic view of market conditions compared to relying on a single indicator.
Clear Classification :
Based on the composite score, TriTrend Nexus categorizes the market into:
Strong Signals : When all three underlying conditions are met, indicating a robust and established trend.
Early Signals : When two out of the three conditions are met, offering an early hint of a potential trend.
Neutral/Choppy : When conditions are ambiguous or conflicting, suggesting a lack of clear market direction.
Trend Qualifiers :
In addition to the composite score, the indicator subtly refines its signal by noting whether a trend is “Rising” or “Fading.” This further aids traders in understanding the momentum behind the signal.
Dynamic Signal Identification
Timely Alerts :
By analyzing the composite data in real time, the indicator quickly identifies when market conditions shift, offering early warning signals that help traders stay ahead of the market.
Adaptive Analysis :
The built-in signal assessment continuously monitors market changes. Whether the market is in the early stages of a move or firmly committed to a trend, TriTrend Nexus adapts its messaging to reflect the evolving conditions.
User-Friendly Dashboard
Integrated Display :
A customizable dashboard provides an at-a-glance summary of key metrics. Users can choose between a detailed view for comprehensive insights or a compact version for a streamlined experience.
Key Metrics Displayed :
Primary Signal : The overall market status, such as “Bullish Strong” or “Bearish Early.”
Composite Nexus Score : A numerical value representing the strength of the current market conditions.
Supporting Data : Essential values that help explain the current signal without overwhelming the trader.
Easy Interpretation :
The dashboard is designed with clarity in mind. Clear labeling and a consistent layout ensure that even traders new to composite indicators can quickly interpret the displayed information.
Visual Clarity and Aesthetic
Color-Coded Signals :
The indicator uses a vibrant color scheme to highlight market conditions:
Bright Green : Signifies a strong bullish trend.
Light Green : Indicates an emerging bullish trend.
Red : Represents a strong bearish trend.
Light Red/Pink : Denotes an early bearish signal.
Gray : Used when market conditions are neutral or choppy.
Graphical Enhancements :
The plotted oscillator visually reinforces the signal classifications with dynamic color transitions. Horizontal markers provide reference points to help traders easily compare the current readings against standard levels.
Customization Options
Adjustable Settings :
Traders can personalize the indicator by modifying input settings such as sensitivity thresholds and period lengths. This flexibility allows the tool to adapt to different market environments and trading styles.
Dashboard Flexibility :
The option to toggle between a full dashboard and a shorter version means that both novice and experienced traders can configure the display to best suit their needs. A more detailed dashboard offers extensive insights, while the compact mode provides a minimalist view for those who prefer simplicity.
Tailored User Experience :
With multiple adjustable parameters, users can fine-tune the indicator to respond precisely to their preferred timeframes and market conditions. This adaptability makes TriTrend Nexus a versatile tool for various trading strategies.
Benefits for Traders
Quick and Informed Decision-Making :
With a single glance at the dashboard and visual cues from the oscillator, traders can quickly gauge whether the market is poised for a strong move, is in the early stages of a trend, or is too volatile for clear signals. This helps in planning timely entries and exits.
Enhanced Market Insight :
By integrating multiple perspectives into one coherent score, the indicator filters out market noise and highlights the prevailing trend more reliably. This can be particularly useful during periods of market uncertainty.
Reduced Analysis Time:
The combination of clear, color-coded signals and an intuitive dashboard reduces the time spent analyzing various individual indicators, allowing traders to focus more on strategy execution.
Customization for Diverse Strategies :
The ability to adjust various input parameters and the dashboard layout ensures that traders can tailor the tool to fit their unique analysis style and market conditions, making it a versatile addition to any trading toolkit.
User-Friendly Interface :
Even for those who are not technically inclined, the clear visual design and straightforward signal descriptions make it easy to understand the current market situation without needing to interpret complex data.
