VIX Term Structure Pro [v7.0 Enhanced]# VIX Term Structure Pro v7.0
[! (img.shields.io)](www.tradingview.com)
[! (img.shields.io)](www.tradingview.com)
[! (img.shields.io)](LICENSE)
**Professional VIX-based Market Sentiment & Timing Indicator**
专业的 VIX 市场情绪与择时指标
---
## 🌟 Overview / 概述
VIX Term Structure Pro is an advanced multi-factor market timing indicator that analyzes the VIX futures term structure, volatility regime, and market breadth to generate actionable buy/sell signals.
VIX Term Structure Pro 是一款高级多因子市场择时指标,通过分析 VIX 期货期限结构、波动率区间及市场广度,生成可操作的买卖信号。
---
## 🚀 Key Features / 核心功能
### 📊 Multi-Factor Scoring System / 多因子评分系统
- **Term Structure Z-Score**: Measures deviation from historical mean / 期限结构 Z 分数:衡量与历史均值的偏离
- **VIX/VX1 Basis**: Spot premium detection for panic signals / VIX 现货溢价:恐慌信号检测
- **Contango Analysis**: Futures curve shape insights / 期货升水分析
- **SKEW Integration**: Options skew for tail risk / SKEW 整合:尾部风险监测
- **Put/Call Ratio**: Sentiment extremes / 看跌/看涨比率:情绪极端
- **VVIX Support**: Volatility of volatility (optional) / VVIX 支持:波动率的波动率
### 🎯 Three-Tier Signal System / 三级信号系统
| Signal | Score | Description |
|--------|-------|-------------|
| 🚨 **CRASH BUY** | ≥ 6 | Extreme panic, rare opportunity / 极端恐慌,罕见机会 |
| 🟢 **STRONG BUY** | ≥ 5 | Multi-factor confluence / 多因子共振 |
| 🟡 **BUY DIP** | ≥ 4 | Accumulate on weakness / 逢低吸纳 |
| 🟠 **SELL/HEDGE** | ≤ -2 | Consider reducing risk / 考虑减仓对冲 |
| 🔴 **STRONG SELL** | ≤ -5 | Strong bearish signals / 强烈看跌信号 |
| 🔥 **EUPHORIA SELL** | ≤ -6 | Extreme greed, sell signal / 极度贪婪,卖出信号 |
### 📈 Dashboard Indicators / 仪表盘指标解读
| Indicator | Bullish 🟢 | Bearish 🔴 |
|-----------|------------|------------|
| Overall Bias | STRONG BUY / BUY DIP | STRONG SELL / SELL/HEDGE |
| AI Score | ≥ 5 (Extreme Fear) | ≤ -5 (Extreme Greed) |
| Market Trend | 🟢SPX 🟢NDX (Above MA200) | 🔴SPX 🔴NDX (Below MA200) |
| VIX Regime | LOW VOL (<15) | HIGH VOL (>25) |
| Term Struct Z | < -2.0 (Panic) | > 2.0 (Complacency) |
---
## ⚙️ Configuration / 配置选项
### 📡 Data Sources / 数据源
- **VIX Symbol**: Default `CBOE:VIX` (Alternative: `TVC:VIX`)
- **Put/Call Ratio**: Default `INDEX:CPCI` (Index P/C)
- **Timeframe**: Daily (stable) or Chart (real-time)
### ⚠️ Strategy Mode / 策略模式
- **High (Scalping)**: Sensitive, for short-term trades / 高敏感,短线
- **Normal (Swing)**: Balanced approach / 平衡模式
- **Low (Trend/Safe)**: Conservative, trend-following / 保守,趋势跟踪
### 🔬 Backtest Mode / 回测模式
- **OFF (Real-time)**: Shows current day data, suitable for live monitoring / 显示当日数据,适合实盘监控
- **ON (Historical)**: Uses only confirmed data, avoids look-ahead bias / 仅使用已确认数据,避免未来函数
---
## 📖 Usage Guide / 使用指南
### Best Practices / 最佳实践
1. **Apply to SPX/SPY/QQQ daily charts** for optimal signal accuracy
在 SPX/SPY/QQQ 日线图上使用,信号准确度最佳
2. **Wait for next trading day** to execute signals (signals trigger on daily close)
信号触发后在下一交易日执行(信号基于日线收盘)
3. **Use in conjunction with price action** for confirmation
结合价格走势确认信号
4. **Enable Market Trend Filter** (MA200) for safer entries in uncertain markets
开启趋势过滤(MA200)以在不确定市场中更安全入场
### Signal Interpretation / 信号解读
```
🚨 CRASH BUY (Score ≥ 6)
→ Rare extreme panic event
→ Historical average return: significant positive over 2 months
→ Consider aggressive positioning
🟢 STRONG BUY (Score ≥ 5)
→ Multiple indicators align
→ Historical average return: positive over 1 month
→ Consider building positions
🟡 BUY DIP (Score ≥ 4)
→ Moderate fear detected
→ Suitable for adding to existing positions
→ Filtered out in bear markets if Trend Filter is ON
```
---
## 📊 Historical Statistics / 历史统计
The indicator tracks signal frequency and average subsequent returns:
- **CRASH BUY**: 40-day return period (~2 months)
- **STRONG BUY**: 20-day return period (~1 month)
- **BUY DIP**: 10-day return period (~2 weeks)
指标追踪信号频率和后续平均收益,可在仪表盘中查看历史统计。
---
## 🔔 Alerts / 警报
Built-in alert conditions with cooldown mechanism to prevent spam:
| Alert | Condition |
|-------|-----------|
| Crash Buy Alert | Score ≥ 6, extreme panic |
| Strong Buy Alert | Score ≥ 5, multi-factor confluence |
| Buy Dip Alert | Score ≥ threshold |
| Euphoria Sell Alert | Score ≤ -6, extreme greed |
| Strong Sell Alert | Score ≤ -5 |
| VIX Basis Panic | VIX spot premium spike |
---
## 📋 Changelog / 更新日志
### v7.0 (Current)
- ✨ Three-tier buy/sell signal system
- 📊 Signal statistics with average return tracking
- 🔬 Backtest Mode toggle for historical testing
- 🎨 Configurable ±1 Z-Score reference lines
- ⚡ Modular scoring functions
- 🛡️ Dual index trend display (SPX + NDX)
- 📱 Compact & Full dashboard modes
---
## ⚠️ Disclaimer / 免责声明
**English:**
This indicator is for educational and informational purposes only. It does not constitute financial advice. Past performance does not guarantee future results. Always do your own research and consider your risk tolerance before trading.
**中文:**
本指标仅供教育和信息参考,不构成投资建议。过往表现不代表未来收益。交易前请自行研究并评估风险承受能力。
---
## 📄 License / 许可证
MIT License - Feel free to use, modify, and share.
---
## 🤝 Contributing / 贡献
Issues and pull requests are welcome!
欢迎提交问题和贡献代码!
---
**Made with ❤️ for the trading community**
**为交易社区用心打造**
Zscore

Pair Correlation Master [Macro]The Main Idea
Trading represents a constant battle between Systemic Flows (the whole market moving together) and Idiosyncratic Moves (one specific asset moving on its own).
This tool allows you to monitor a "basket" of 4 assets simultaneously (e.g., the major USD pairs). It answers the most important question in forex and multi-asset trading: "Is this move happening because the Dollar is weak, or because the Euro is strong?"
It separates the "Signal" (the unique move) from the "Noise" (the herd movement).
1. The Chart Lines: The "Race" (Macro Trend)
Think of the lines on your chart as a long-distance race. They visualize the performance of all 4 assets over the last 200 candles (adjustable).
- Bunched Together: If all lines are moving in the same direction, the market is highly correlated. (e.g., "The Dollar is selling off everywhere").
- Fanning Out: If the lines are spreading apart, specific currencies are outperforming others.
- The Zero Line: This is the starting line.
--- Above 0: The pair is in a macro uptrend.
--- Below 0: The pair is in a macro downtrend.
2. The Dashboard: The "Health Check" (Micro Data)
The table in the top right gives you the immediate statistics for right now.
- A. The Z-Score (The Rubber Band)
This measures how "stretched" price is compared to its normal behavior.
- White (< 2.0): Normal trading activity.
- Orange (> 2.0): The price is stretching. Warning sign.
- Red (> 3.0): Critical Stretch. The rubber band is pulled to its limit. Statistically, a pullback or pause is highly likely.
B. The Star (★)
The script automatically calculates the average behavior of your group. If one asset is behaving completely differently from the rest, it marks it with a Star (★).
- Example: EURUSD, GBPUSD, and NZDUSD are flat, but AUDUSD is rallying hard. AUDUSD gets the ★. This is where the unique opportunity lies.
🎯 Best Uses: 4H & Daily Timeframes
This indicator is tuned for "Macro" analysis. It works best on the "4-Hour" and "Daily" charts to filter out intraday noise and capture swing trading moves.
- Strategy 1: The "Rubber Band" Snap (Mean Reversion)
- Setup: Look for a Z-Score in the RED (> 3.0) on the Daily timeframe.
- Action: This indicates an unsustainable move. Look for reversals or exhaustion patterns to trade against the trend back toward the mean.
- Strategy 2: The "Lone Wolf" (Trend Following)
- Setup: Look for the asset with the Star (★).
- Action: If the whole basket is flat (Balanced), but the Star asset is breaking out, that creates a high-quality trend trade because that specific currency has its own catalyst (News/Earnings).
- Strategy 3: Systemic Flows (Basket Trading)
- Setup: The dashboard footer says "⚠️ SYSTEMIC MOVE."
- Action: This means everything is moving together (e.g., a massive USD crash). Don't look for unique setups; just join the trend on the strongest pair.
Dashboard Footer Key
The bottom of the table summarizes the current state of the market for you:
- Balanced / Rangebound: The market is quiet. Good for range trading.
- Focus: : Trade this specific pair. It is moving independently.
- Systemic Move: The whole basket is moving violently. Trade the momentum.
p.s. Suggestion - apply and use on the chart rather than an oscillator.

ZScore SemiConductoresZ-Score of Semiconductor Sector Volume
This custom Pine Script indicator applies a Z-Score calculation to the aggregated trading volume of leading semiconductor companies. The goal is to highlight statistical extremes in sector activity that may signal unusual market behavior.
🔧 How it works
- Fixed ticker list: NVDA, AVGO, TSM, AMD, ASML, MU, ARM, ON, TXN, QCOM, INTC.
- Aggregate volume: The script sums the trading volume of all tickers in the list for the selected timeframe.
- Z-Score calculation:
- Moving average and standard deviation are computed over a configurable window (default = 50 bars).
- Formula:
Z= (Current Volume - Mean) / Standard Deviation
Visualization:
- Z-Score plotted in green.
- Reference lines at 0, ±1σ, ±2σ.
- Labels (triangles) mark critical signals when Z > +2 or Z < -2.
📈 Why it matters
- Detects abnormal surges or drops in sector-wide volume.
- Highlights potential euphoria (+2σ) or panic (-2σ) moments.
- Useful as a filter for trading strategies or as a sector-level alert system.
⚠️ Disclaimer: This script is for educational purposes only and not financial advice

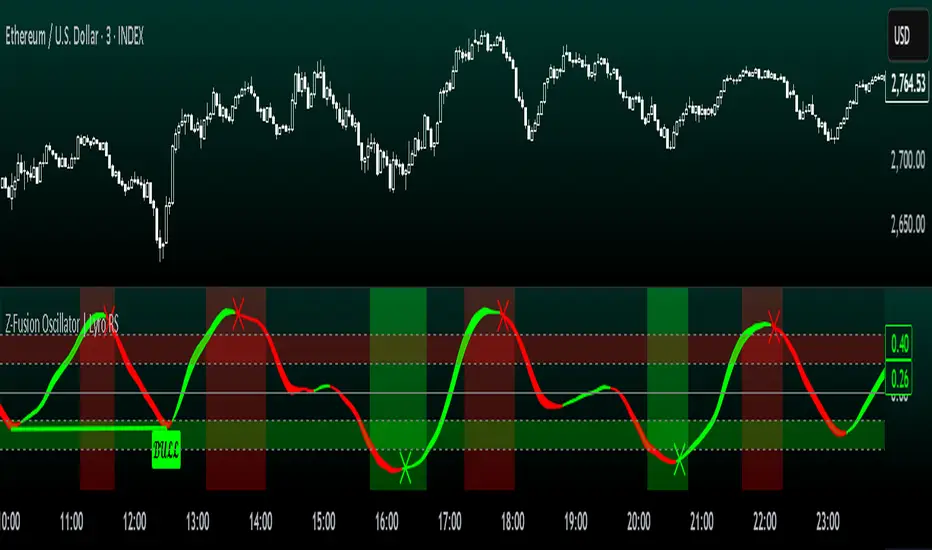
Z-Fusion Oscillator | Lyro RSThe Z-Fusion Oscillator converts five momentum indicators into Z-scores and blends them into one normalized signal that adapts across markets.
By combining normalization, smoothing, and divergence detection, users can easily identify when momentum is accelerating, weakening, reversing, or entering extreme zones
🔶 USAGE
The Z-Fusion Oscillator is designed to give traders a unified reading of market momentum—removing the noise of comparing tools that normally run on different scales.
By transforming RSI, MACD histogram, Stochastic, Momentum, and Rate of Change into Z-scores, this tool standardizes all inputs, making trend strength and shifts easier to interpret.
A dual-line system (fast Z-fusion line + slower baseline) highlights turning points, while overbought/oversold bands and “X-marks” help traders spot exhaustion and potential reversals.
🔹 Unified Momentum Structure
The indicator’s core strength comes from combining five Z-scored signals into one average.
Which makes momentum behavior more consistent across assets, reduces false extremes, and highlights true shifts in trend conviction.
🔹 Divergence Detection
The tool includes fully integrated divergence detection:
Regular Bullish Divergence: Price makes a lower low while Z-Fusion forms a higher low.
Regular Bearish Divergence: Price makes a higher high while Z-Fusion forms a lower high
Bullish and bearish divergences are marked directly on the oscillator with labels and colored pivot connections, making hidden momentum shifts obvious.
🔹 Visual Extremes
Two sets of upper and lower Z-score thresholds help identify:
Extreme overbought surges
Extreme oversold drops
Reversal zones
Potential exhaustion conditions
Background coloring reinforces when the oscillator moves beyond major levels, helping traders quickly assess momentum pressure.
🔹 Detecting Momentum Anomalies
Z-scores allow the oscillator to highlight when market momentum behaves abnormally relative to its own recent history.
For example:
The oscillator reaching +1 or –1 after an extended trend may indicate a climax.
A sharp Z-score reversal within an extreme zone can signal a trend exhaustion or a corrective move.
Divergences often appear earlier due to normalization smoothing out indicator noise.
This makes the Z-Fusion Oscillator particularly useful for spotting subtle shifts in trend direction that traditional indicators may miss.
🔶 DETAILS
🔹 Composite Z-Score Framework
Each momentum tool is smoothed, normalized, and transformed:
RSI → EMA-smoothed, Z-scored
MACD histogram → Z-scored
Stochastic → EMA + SMA smoothing, then Z-scored
Momentum → EMA-smoothed, Z-scored
Rate of Change → EMA-smoothed, Z-scored
These are averaged into one composite Z-score to provide a consistent reading across assets and market conditions.
🔹 Fusion Trend Lines
Two lines serve as the core signal:
Fast Line (savg) – reacts quicker to trend changes
Slow Line (savg2) – acts as a baseline filter
Crossovers between these lines highlight momentum shifts, while their color reflects trend bias.
🔹 Overbought/Oversold Zones
Two upper and two lower Z-score thresholds define “zones”:
Upper zones highlight overheated momentum or potential bearish reversals
Lower zones highlight depressed momentum or potential bullish reversals
Filled regions and background colors help visually confirm extreme conditions.
🔹 Pivot-Based Divergence Engine
The script includes filtered pivot detection with customizable look-backs and range limits to ensure divergences are meaningful, not noise-driven.
🔶 SETTINGS
🔹 Indicator Settings
Source — Price series used for all calculations.
Z-Score Length — Lookback period for Z-score normalization.
Z-Score MA Length — Smoothing length for the fusion signal lines.
Overbought/Oversold Levels — Four customizable threshold lines.
Color Palette — Choose from preset themes or define custom colors.
🔹 RSI
Length — RSI calculation period.
EMA Smoothing Length — Smooths RSI before Z-score conversion.
🔹 MACD
Fast Length — Fast EMA length.
Slow Length — Slow EMA length.
Signal Line Length — MACD signal smoothing.
🔹 Stochastic
%K Length — Main stochastic length.
EMA Smoothing — Smooths %K for stability.
%D Length — Smoothing for the signal line.
🔹 Momentum
Length — Momentum lookback.
EMA Smoothing — Smooths momentum before Z-scoring.
🔹 Rate of Change
Length — ROC lookback.
EMA Smoothing — Smooths ROC values.
🔹 Divergence
Enable/Disable Divergence Detection — Toggle divergence engine.
Pivot Left/Right Lookback — Defines pivot detection sensitivity.
Detection Range Limits — Controls allowable range for divergence.
Bull/Bear Colors & Styling — Customize divergence visualization.
🔶 SUMMARY
The Z-Fusion Oscillator combines multiple momentum signatures into a single normalized signal, enabling traders to:
Identify reversals early
Detect momentum exhaustion
Spot bullish and bearish divergences
Track overbought/oversold conditions
Visualize trend strength with clarity
Whether you're a swing trader, intraday analyst, or trend-reversal hunter, the Z-Fusion Oscillator provides a powerful and adaptive way to read momentum.
Uptrick: Dynamic Z-Score DivergenceIntroduction
Uptrick: Dynamic Z-Score Divergence is an oscillator that combines multiple momentum sources within a Z-Score framework, allowing for the detection of statistically significant mean-reversion setups, directional shifts, and divergence signals. It integrates a multi-source normalized oscillator, a slope-based signal engine, structured divergence logic, a slope-adaptive EMA with dynamic bands, and a modular bar coloring system. This script is designed to help traders identify statistically stretched conditions, evolving trend dynamics, and classical divergence behavior using a unified statistical approach.
Overview
At its core, this script calculates the Z-Score of three momentum sources—RSI, Stochastic RSI, and MACD—using a user-defined lookback period. These are averaged and smoothed to form the main oscillator line. This normalized oscillator reflects how far short-term momentum deviates from its mean, highlighting statistically extreme areas.
Signals are triggered when the oscillator reverses slope within defined inner zones, indicating a shift in direction while the signal remains in a statistically stretched state. These mean-reversion flips (referred to as TP signals) help identify turning points when price momentum begins to revert from extended zones.
In addition, the script includes a divergence detection engine that compares oscillator pivot points with price pivot points. It confirms regular bullish and bearish divergence by validating spacing between pivots and visualizes both the oscillator-side and chart-side divergences clearly.
A dynamic trend overlay system is included using a Slope Adaptive EMA (SA-EMA). This trend line becomes more responsive when Z-Score deviation increases, allowing the trend line to adapt to market conditions. It is paired with ATR-based bands that are slope-sensitive and selectively visible—offering context for dynamic support and resistance.
The script includes configurable bar coloring logic, allowing users to color candles based on oscillator slope, last confirmed divergence, or the most recent signal of any type. A full alert system is also built-in for key signals.
Originality
The script is based on the well-known concept of Z-Score valuation, which is a standard statistical method for identifying how far a signal deviates from its mean. This foundation—normalizing momentum values such as RSI or MACD to measure relative strength or weakness—is not unique to this script and is widely used in quantitative analysis.
What makes this implementation original is how it expands the Z-Score foundation into a fully featured, signal-producing system. First, it introduces a multi-source composite oscillator by combining three momentum inputs—RSI, Stochastic RSI, and MACD—into a unified Z-Score stream. Second, it builds on that stream with a directional slope logic that identifies turning points inside statistical zones.
The most distinctive additions are the layered features placed on top of this normalized oscillator:
A structured divergence detection engine that compares oscillator pivots with price pivots to validate regular bullish and bearish divergence using precise spacing and timing filters.
A fully integrated slope-adaptive EMA overlay, where the smoothing dynamically adjusts based on real-time Z-Score movement of RSI, allowing the trend line to become more reactive during high-momentum environments and slower during consolidation.
ATR-based dynamic bands that adapt to slope direction and offer real-time visual zones for support and resistance within trend structures.
These features are not typically found in standard Z-Score indicators and collectively provide a unique approach that bridges statistical normalization, structure detection, and adaptive trend modeling within one script.
Features
Z-Score-based oscillator combining RSI, StochRSI, and MACD
Configurable smoothing for stable composite signal output
Buy/Sell TP signals based on slope flips in defined zones
Background highlighting for extreme outer bands
Inner and outer zones with fill logic for statistical context
Pivot-based divergence detection (regular bullish/bearish)
Divergence markers on oscillator and price chart
Slope-Adaptive EMA (SA-EMA) with real-time adaptivity based on RSI Z-Score
ATR-based upper and lower bands around the SA-EMA, visibility tied to slope direction
Configurable bar coloring (oscillator slope, divergence, or most recent signal)
Alerts for TP signals and confirmed divergences
Optional fixed Y-axis scaling for consistent oscillator view
The full setup mode can be seen below:
Input Parameters
General Settings
Full Setup: Enables rendering of the full visual system (lines, bands, signals)
Z-Score Lookback: Lookback period for normalization (mean and standard deviation)
Main Line Smoothing: EMA length applied to the averaged Z-Score
Slope Detection Index: Used to calculate directional flips for signal logic
Enable Background Highlighting: Enables visual region coloring in
overbought/oversold areas
Force Visible Y-Axis Scale: Forces max/min bounds for a consistent oscillator range
Divergence Settings
Enable Divergence Detection: Toggles divergence logic
Pivot Lookback Left / Right: Defines the structure of oscillator pivot points
Minimum / Maximum Bars Between Pivots: Controls the allowed spacing range for divergence validation
Bar Coloring Settings
Bar Coloring Mode:
➜ Line Color: Colors bars based on oscillator slope
➜ Latest Confirmed Signal: Colors bars based on the most recent confirmed divergence
➜ Any Latest Signal: Colors based on the most recent signal (TP or divergence)
SA-EMA Settings
RSI Length: RSI period used to determine adaptivity
Z-Score Length: Lookback for normalizing RSI in adaptive logic
Base EMA Length: Base length for smoothing before adaptivity
Adaptivity Intensity: Scales the smoothing responsiveness based on RSI deviation
Slope Index: Determines slope direction for coloring and band logic
Band ATR Length / Band Multiplier: Controls the width and responsiveness of the trend-following bands
Alerts
The script includes the following alert conditions:
Buy Signal (TP reversal detected in oversold zone)
Sell Signal (TP reversal detected in overbought zone)
Confirmed Bullish Divergence (oscillator HL, price LL)
Confirmed Bearish Divergence (oscillator LH, price HH)
These alerts allow integration into automation systems or signal monitoring setups.
Summary
Uptrick: Dynamic Z-Score Divergence is a statistically grounded trading indicator that merges normalized multi-momentum analysis with real-time slope logic, divergence detection, and adaptive trend overlays. It helps traders identify mean-reversion conditions, divergence structures, and evolving trend zones using a modular system of statistical and structural tools. Its alert system, layered visuals, and flexible input design make it suitable for discretionary traders seeking to combine quantitative momentum logic with structural pattern recognition.
Disclaimer
This script is for educational and informational purposes only. No indicator can guarantee future performance, and trading involves risk. Always use risk management and test strategies in a simulated environment before deploying with live capital.

Fear & Greed Oscillator - Risk SentimentThe Fear & Greed Oscillator – Risk Sentiment is a macro-driven sentiment indicator inspired by the popular Fear & Greed Index , but rebuilt from the ground up using real, market-based economic data and statistical normalization.
While the traditional Fear & Greed Index uses components like volatility, volume, and social media trends to estimate sentiment, this version is powered by the Copper/Gold ratio — a historically respected gauge of macroeconomic confidence and risk appetite.
📈 Expansion vs. Contraction Theory
At the heart of this oscillator is a simple macroeconomic insight:
🟢 Copper performs well during periods of economic expansion and risk-on behavior (industrials, construction, manufacturing growth).
🔴 Gold performs well during periods of economic contraction , as a classic risk-off, capital-preserving asset.
By tracking the ratio of Copper to Gold prices over time and converting it into a Z-score , this tool shows when macro sentiment is statistically stretched toward greed or fear — based on how unusually strong one side of the ratio is relative to its historical average.
⚙️ How It Works
The script takes two user-defined tickers (default: Copper and Gold) and calculates their ratio.
It then applies Z-score normalization over a user-defined period (default: 200 bars).
A color gradient line is plotted:
🔴 Z < -2 = Extreme Fear
🟣 -2 to 0 = Mild Fear to Neutral
🔵 0 to 2 = Neutral to Greed
🟢 Z > 2 = Extreme Greed
Visual guides at ±1, ±2, ±3 standard deviations give immediate context.
Includes alert conditions when the Z-score crosses above +2 (Greed) or below -2 (Fear).
🔔 Alerts
“Z-Score has entered the Greed Zone ” when Z > 2
“Z-Score has entered the Fear Zone ” when Z < -2
These are designed to help catch macro sentiment extremes before or during large shifts in market behavior.
⚠️ Disclaimer
This indicator is a macro sentiment tool, not a direct trading signal. While the Copper/Gold ratio often reflects economic risk trends, correlation with risk assets (like Bitcoin or equities) is not guaranteed and may vary by cycle. Always use this indicator in conjunction with other tools and contextual analysis.

Analog Flow [KedArc Quant]Overview
AnalogFlow is an advanced analogue based market projection engine that reconstructs future price tendencies by matching current price behavior to historical analogues in the same instrument. Instead of using traditional indicators such as moving averages, RSI, or regression, AnalogFlow applies pattern vector similarity analysis - a data driven technique that identifies historically similar sequences and aggregates their subsequent movements into a smooth, forward looking curve.
Think of it as a market memory system:
If the current pattern looks like one we have seen before, how did price move afterward?
Why AnalogFlow Is Unique
1. Pattern centric - it does not rely on any standard indicator formula; it directly analyzes price movement vectors.
2. Adaptive - it learns from the same instrument's past behavior, making it self calibrating to volatility and regime shifts.
3. Non repainting - the projection is generated on the latest completed bar and remains fixed until new data is available.
4. Noise resistant - the EMA Blend engine smooths the projected trajectory, reducing random variance between analogues.
Inputs and Configuration
Pattern Bars
Number of bars in the reference pattern window: 40
Projection Bars
Number of bars forward to project: 30
Search Depth
Number of bars back to look for matching analogues: 600
Distance Metric
Comparison method: Euclidean, Manhattan, or Cosine (default Euclidean)
Matches
Number of top analogues to blend (1-5): Top 3
Build Mode
Projection type: Cumulative, MeanStep, or EMA Blend (default EMA Blend)
EMA Blend Length
Smoothness of the projected path: 15
Normalize Pattern
Enable Z score normalization for shape matching: true
Dissimilarity Mode
If true, finds inverse analogues for mean reversion analysis: false
Line Color and Width
Style settings for projection curve: Blue, width 2
How It Works with Past Data
1. The system builds a memory bank of patterns from the last N bars based on the scanDepth value.
2. It compares the latest Pattern Bars segment to each historical segment.
3. It selects the Top K most similar or dissimilar analogues.
4. For each analogue, it retrieves what happened after that pattern historically.
5. It averages or smooths those forward moves into a single composite forecast curve.
6. The forecast (blue line) is drawn ahead of the current candle using line.new with no repainting.
Output Explained
Blue Path
The weighted mean future trajectory based on historical analogues.
Smoother when EMA Blend mode is enabled.
Flat Section
Indicates low directional consensus or equilibrium across analogues.
Upward or Downward Slope
Represents historical tendency toward continuation or reversal following similar conditions.
Recommended Timeframes
Scalping / Short Term
1m - 5m : Short winLen (20-30), small ahead (10-15)
Swing Trading
15m - 1h : Balanced settings (winLen 40-60, ahead 20-30)
Positional / Multi Day
4h - 1D : Large windows (winLen 80-120, ahead 30-50)
Instrument Compatibility
Works seamlessly on:
Stocks and ETFs
Indices
Cryptocurrency
Commodities (Gold, Crude, etc.)
Futures and F&O (both intraday and positional)
Forex
No symbol specific calibration needed. It self adapts to volatility.
How Traders Can Use It
Forecast Context
Identify likely short term price path or drift direction.
Reversal Detection
Flip seekOpp to true for mean reversion pattern analysis.
Scenario Comparison
Observe whether the current regime tends to continue or stall.
Momentum Confirmation
Combine with trend tools such as EMA or MACD for directional bias.
Backtesting Support
Compare projected path versus realized price to evaluate reliability.
FAQ
Q1. Does AnalogFlow repaint?
No. It calculates only once per completed bar and projects forward. The future path remains static until a new bar closes.
Q2. Is it a neural network or AI model?
Not in the machine learning sense. It is a deterministic analogue matching engine using statistical distance metrics.
Q3. Why does the projection sometimes flatten?
That means similar historical setups had no clear consensus in direction (neutral expectation).
Q4. Can I use it for live trading signals?
AnalogFlow is not a signal generator. It provides probabilistic context for upcoming movement.
Q5. Does higher scanDepth improve accuracy?
Up to a point. More depth gives more analogues, but too much can dilute recency. Try 400 to 800.
Glossary
Analogue
A past pattern similar to the current price behavior.
Distance Metric
Mathematical formula for pattern similarity.
Step Vector
Difference between consecutive closing prices.
EMA Blend
Exponential smoothing of the projected path.
Cumulative Mode
Adds sequential historical deltas directly.
Z Score Normalization
Rescaling to mean 0 and variance 1 for shape comparison.
Summary
AnalogFlow converts the market's historical echoes into a structured, statistically weighted forward projection. It gives traders a contextual roadmap, not a signal, showing how similar past setups evolved and allowing better informed entries, exits, and scenario planning across all asset classes.
Disclaimer
This script is provided for educational purposes only.
Past performance does not guarantee future results.
Trading involves risk, and users should exercise caution and proper risk management when applying this strategy.

Uptrick: Volume Weighted BandsIntroduction
This indicator, Uptrick: Volume Weighted Bands, overlays dynamic, volume-informed trend channels directly on the chart. By fusing price and volume data through volume-weighted and exponential moving averages, the script forms a core trend line with adaptive bandwidth controlled by volatility. It is designed to help traders identify trend direction, breakout entries, and extended conditions that may warrant take-profits or pullback re-entries.
Overview
The Volume Weighted Bands system is built around a trend line calculated by averaging a Volume Weighted Moving Average (VWMA) and an Exponential Moving Average (EMA), both over a configurable lookback period. This hybrid trend baseline is then smoothed further and expanded into dynamic upper and lower bands using an Average True Range (ATR) multiplier. These bands adapt with market volatility and shift color based on prevailing price action, helping traders quickly identify bullish, bearish, or neutral conditions.
Originality and Unique Features
This script introduces originality by blending both price and volume in the core trend calculation, a technique that is more responsive than traditional moving average bands. Its multi-mode visualization (cloud, single-band, or line-only), combined with selective buy/sell signals, makes it flexible for discretionary and algorithmic strategies alike. Optional modules for take-profit signals based on z-score deviation and RSI slope, as well as buy-back detection logic with cooldown filters, offer practical tools for managing trades beyond simple entries.
Explanation of Inputs
Every user input in this script is included to give the trader control over behavior and visual presentation:
Trend Length (len): Defines the lookback window for both the VWMA and EMA, controlling the sensitivity of the core trend baseline. A lower value makes the bands more reactive, while a higher value smooths out short-term noise.
Extra Smoothing (smoothLen): Applies an additional EMA to the blended VWMA/EMA average. This second-level smoothing ensures the central trend line reacts gradually to shifts in price.
Band Width (ATR Multiplier) (bandMult): Multiplies the ATR to create the width of the upper and lower bands around the trend line. Larger values widen the bands, capturing more volatility, while smaller values narrow them.
ATR Length (atrLen): Sets the length of the ATR used in calculating band width and signal offsets. Longer values produce smoother band boundaries.
Show Buy/Sell Signals (showSignals): Toggles the primary crossover/crossunder entry signals, which are labeled when the close crosses the upper or lower band.
Visual Mode (visualMode): Allows selection between three display modes:
--> Cloud: Shows both bands and the central trend line with a shaded background.
--> Single Band: Displays only the active (upper or lower) band depending on trend state, with gradient fill to price.
--> Line Only: Shows only the trend line for a minimal visual profile.
Take Profit Signals (enableTP): Enables a z-score-based profit-taking signal system. Signals occur when price deviates significantly from the trend line and RSI confirms exhaustion.
TP Z-Score Threshold (tpThreshold): Sets the z-score deviation required to trigger a take-profit signal. Higher values reduce the frequency of signals, focusing on more extreme moves.
Re-Entries (enableBuyBack): Enables logic to signal when price reverts into the band after an initial breakout, suggesting a possible re-entry or pullback setup.
Buy Back Cooldown (bars) (buyBackCooldown): Defines a minimum bar count before a new buy-back signal is allowed, preventing rapid retriggering in choppy conditions.
Buy Offset and Sell Offset: Hidden inputs used to vertically adjust the placement of the Buy ("𝓤𝓹") and Sell ("𝓓𝓸𝔀𝓷") labels relative to the bands. These use ATR units to maintain proportionality across different instruments and timeframes.
Take-Profit Signal Module
The take-profit module uses a z-score of the distance between price and the trend line to detect extended conditions. In bullish trends, a signal appears when price is well above the band and RSI indicates exhaustion; the opposite applies for bearish conditions. A boolean flag is used to prevent retriggering until RSI resets. These signals are plotted with minimalist “X” markers near recent highs or lows, based on whether the market is extended upward or downward.
Re-Entry Logic
The re-entry system identifies instances where price momentarily dips or spikes into the opposite band but closes back inside, implying a continuation of the prevailing trend. This module can be particularly useful for traders managing entries after brief pullbacks. A built-in cooldown period helps filter out noise and prevents signal overloading during fast markets. Visual markers are shown as upward or downward arrows near the relevant candle wicks.
How to Use This Indicator
The basic usage of this indicator follows a directional, signal-driven approach. When a buy signal appears, it suggests entering a long position. The recommended stop loss placement is below the lower band, allowing for some breathing space to accommodate natural volatility. As the position progresses, take partial profits—typically 10% to 15% of the position—each time a take-profit signal (marked with an "X") is shown on the chart.
An optional feature is the buy-back signal, which can be used to re-enter after partial exits or missed entries. Utilizing this can help reduce losses during false breakouts or trend reversals by scaling in more gradually. However, it also means that in strong, clean trends, the full position may not be captured from the start, potentially reducing the total return. It is up to the trader to decide whether to enter fully on the initial signal or incrementally using buy-backs.
When a sell signal appears, the strategy advises fully exiting any long positions and immediately switching to a short position. The short trade follows the same logic: place your stop loss above the upper band with some margin, and again, take partial profits at each take-profit signal.
Visual Presentation and Signal Labels
All signals are plotted with clean, minimal labels that avoid clutter, and are color-coded using a custom palette designed to remain clear across light and dark chart themes. Bullish trends are marked in teal and bearish trends in magenta. Candles and wicks are also colored accordingly to align price action with the detected trend state. Buy and sell entries are marked with "𝓤𝓹" and "𝓓𝓸𝔀𝓷" labels.
Summary
In summary, the Uptrick: Volume Weighted Bands indicator provides a versatile, visually adaptive trend and volatility tool that can serve multiple styles of trading. Through its integration of price, volume, and volatility, along with modular take-profit and buy-back signaling, it aims to provide actionable structure across a range of market conditions.
Disclaimer
This indicator is for educational purposes only. Trading involves risk, and past performance does not guarantee future results. Always test strategies before applying them in live markets.

Cumulative Volume Delta Z Score [BackQuant]Cumulative Volume Delta Z Score
The Cumulative Volume Delta Z Score indicator is a sophisticated tool that combines the cumulative volume delta (CVD) with Z-Score normalization to provide traders with a clearer view of market dynamics. By analyzing volume imbalances and standardizing them through a Z-Score, this tool helps identify significant price movements and market trends while filtering out noise.
Core Concept of Cumulative Volume Delta (CVD)
Cumulative Volume Delta (CVD) is a popular indicator that tracks the net difference between buying and selling volume over time. CVD helps traders understand whether buying or selling pressure is dominating the market. Positive CVD signals buying pressure, while negative CVD indicates selling pressure.
The addition of Z-Score normalization to CVD makes it easier to evaluate whether current volume imbalances are unusual compared to past behavior. Z-Score helps in detecting extreme conditions by showing how far the current CVD is from its historical mean in terms of standard deviations.
Key Features
Cumulative Volume Delta (CVD): Tracks the net buying vs. selling volume, allowing traders to gauge the overall market sentiment.
Z-Score Normalization: Converts CVD into a standardized value to highlight extreme movements in volume that are statistically significant.
Divergence Detection: The indicator can spot bullish and bearish divergences between price and CVD, which can signal potential trend reversals.
Pivot-Based Divergence: Identifies price and CVD pivots, highlighting divergence patterns that are crucial for predicting price changes.
Trend Analysis: Colors bars according to trend direction, providing a visual indication of bullish or bearish conditions based on Z-Score.
How It Works
Cumulative Volume Delta (CVD): The CVD is calculated by summing the difference between buying and selling volume for each bar. It represents the net buying or selling pressure, giving insights into market sentiment.
Z-Score Normalization: The Z-Score is applied to the CVD to normalize its values, making it easier to compare current conditions with historical averages. A Z-Score greater than 0 indicates a bullish market, while a Z-Score less than 0 signals a bearish market.
Divergence Detection: The indicator detects regular and hidden bullish and bearish divergences between price and CVD. These divergences often precede trend reversals, offering traders a potential entry point.
Pivot-Based Analysis: The indicator uses pivot highs and lows in both price and CVD to identify divergence patterns. A bullish divergence occurs when price makes a lower low, but CVD fails to follow, suggesting weakening selling pressure. Conversely, a bearish divergence happens when price makes a higher high, but CVD doesn't confirm the move, indicating potential selling pressure.
Trend Coloring: The bars are colored based on the trend direction. Green bars indicate an uptrend (CVD is positive), and red bars indicate a downtrend (CVD is negative). This provides an easy-to-read visualization of market conditions.
Standard Deviation Levels: The indicator plots ±1σ, ±2σ, and ±3σ levels to indicate the degree of deviation from the average CVD. These levels act as thresholds for identifying extreme buying or selling pressure.
Customization Options
Anchor Timeframe: The user can define an anchor timeframe to aggregate the CVD, which can be customized based on the trader’s needs (e.g., daily, weekly, custom lower timeframes).
Z-Score Period: The period for calculating the Z-Score can be adjusted, allowing traders to fine-tune the indicator's sensitivity.
Divergence Detection: The tool offers controls to enable or disable divergence detection, with the ability to adjust the lookback periods for pivot detection.
Trend Coloring and Visuals: Traders can choose whether to color bars based on trend direction, display standard deviation levels, or visualize the data as a histogram or line plot.
Display Options: The indicator also allows for various display options, including showing the Z-Score values and divergence signals, with customizable colors and line widths.
Alerts and Signals
The Cumulative Volume Delta Z Score comes with pre-configured alert conditions for:
Z-Score Crossovers: Alerts are triggered when the Z-Score crosses the 0 line, indicating a potential trend reversal.
Shifting Trend: Alerts for when the Z-Score shifts direction, signaling a change in market sentiment.
Divergence Detection: Alerts for both regular and hidden bullish and bearish divergences, offering potential reversal signals.
Extreme Imbalances: Alerts when the Z-Score reaches extreme positive or negative levels, indicating overbought or oversold market conditions.
Applications in Trading
Trend Identification: Use the Z-Score to confirm bullish or bearish trends based on cumulative volume data, filtering out noise and false signals.
Reversal Signals: Divergences between price and CVD can help identify potential trend reversals, making it a powerful tool for swing traders.
Volume-Based Confirmation: The Z-Score allows traders to confirm price movements with volume data, providing more reliable signals compared to price action alone.
Divergence Strategy: Use the divergence signals to identify potential points of entry, particularly when regular or hidden divergences appear.
Volatility and Market Sentiment: The Z-Score provides insights into market volatility by measuring the deviation of CVD from its historical mean, helping to predict price movement strength.
The Cumulative Volume Delta Z Score is a powerful tool that combines volume analysis with statistical normalization. By focusing on volume imbalances and applying Z-Score normalization, this indicator provides clear, reliable signals for trend identification and potential reversals. It is especially useful for filtering out market noise and ensuring that trades are based on significant price movements driven by substantial volume changes.
This indicator is perfect for traders looking to add volume-based analysis to their strategy, offering a more robust and accurate way to gauge market sentiment and trend strength.

Z-Score Trend Channels [BackQuant]Z-Score Trend Channels
A self-contained price-statistics framework that turns a rolling z-score into price channels, bias states, and trade markers. Run either trend-following or mean-reversion from the same tool with clear, on-chart context.
What it is
A rolling statistical map that measures how far price is from its recent average in standard-deviation units (z-score).
Adaptive channels drawn in price space from fixed z thresholds, so the rails breathe with volatility.
A simple trend proxy from z-score momentum to separate trending from ranging conditions.
On-chart signals for pullback entries, stretched extremes, and practical exits.
Core idea (plain English math)
Rolling mean and volatility - Over a lookback you get the average price and its standard deviation.
Z-score - How many standard deviations the current price is above or below its average: z = (price - mean) / stdev. z near 0 means near average; positive is above; negative is below.
Noise control - An EMA smooths the raw z to reduce jitter and false flickers.
Channels back in price - Fixed z levels are converted back to price to form the upper, lower, and extreme rails.
Trend proxy - A smoothed change in z is used as a lightweight trend-strength line. Positive strength with positive z favors uptrend; negative strength with negative z favors downtrend.
What you see on the chart
Channels and fills - Mean, upper, lower, and optional extreme lines. The area mean->upper tints with the bearish color, mean->lower tints with the bullish color.
Background tint (optional) - Soft green, red, or neutral based on detected trend state.
Signals - Bullish Entry (triangle up) when z exits the oversold zone upward; Bearish Entry (triangle down) when z exits the overbought zone downward; Extreme markers (diamonds) at the extreme bands with a one-bar turn.
Table - Current z, trend state, trend strength, distance to bands, market state tag, and a quick volatility regime label.
Edge labels - MEAN, OB, and OS labels slightly projected forward with level values.
Inputs you will actually use
Z-Score Period - Lookback for mean and stdev. Larger = slower and steadier rails, smaller = more reactive.
Smoothing Period - EMA on z. Lower = earlier but choppier flips; higher = later but cleaner.
Price Source - Default hlc3. Choose close if you prefer session-close logic.
Upper and Lower Thresholds - Default around +2.0 and -2.0. Tighten for more signals, widen for fewer and stronger.
Extreme Upper and Lower - Deeper stretch guards, e.g., +/- 2.5.
Strength Period - EMA on z momentum. Sets how fast the trend proxy flips.
Trend Threshold - Minimum absolute z to accept a directional bias.
Visual toggles - Channels, signals, background tint, stats table, colors, and optional last-bar trend label.
How to use it: trend-following playbook
Read the state - Uptrend when z > Trend Threshold and trend strength > 0. Downtrend when z < -Trend Threshold and trend strength < 0. Neutral otherwise.
Entries - In an uptrend, prefer Bullish Entry signals that fire near the lower channel. In a downtrend, prefer Bearish Entry signals that fire near the upper channel.
Stops - Conservative: beyond the extreme channel on your side. Tighter: just outside the standard band that framed the signal.
Exits - For longs, exit or trim on a cross back through z = 0 or a clean tag of the upper threshold. For shorts, mirror with z = 0 up-cross or tag of the lower threshold. You can also reduce if trend strength flips against you.
Adds - In strong trends, additional signals near your side’s band can be add points. Avoid adding once z hovers near the opposite band for several bars.
How to use it: mean-reversion playbook
Find stretch - Standard reversions: Bullish Entry when z leaves the oversold zone upward; Bearish Entry when z leaves the overbought zone downward. Aggressive reversions: Extreme markers at extreme bands with a one-bar turn.
Entries - Take the signal as price exits the zone. Prefer setups where trend strength is near zero or tilting against the prior push.
Targets - First target is the mean line. A runner can aim for the opposite standard channel if momentum keeps flipping.
Stops - Outside the extreme band beyond your entry. If fading without extremes, place risk just beyond the opposite standard band.
Filters - Optional: skip counter-trend fades against a very strong trend state unless your risk is tight and predefined.
Reading the stats table
Current Z-Score - Magnitude and sign of displacement now.
Trend State - Uptrend, Downtrend, or Ranging.
Trend Strength - Smoothed z momentum. Higher absolute values imply stronger directional conviction.
Distance to Upper/Lower - Percent distance from price to each band, useful for sizing targets or judging room left.
Market State - Overbought, Oversold, Extreme OB, Extreme OS, or Normal.
Volatility Regime - High, Normal, or Low relative to recent distribution. Expect bands to widen in High and tighten in Low.
Parameter guidance (conceptual)
Z-Score Period - Choose longer for a structural mean, shorter for a reactive mean.
Smoothing Period - Lower for earlier but noisier reads; higher for slower but steadier reads.
Thresholds - Start around +/- 2.0. Tighten for scalping or quiet ranges. Widen for noisy or fast markets.
Trend Threshold and Strength Period - Raise to avoid weak, transient bias. Lower to capture earlier regime shifts.
Practical examples
Trend pullback long - State shows Uptrend. Price tests the lower channel; z dips near or below the lower threshold; a Bullish Entry prints. Stop just below extreme lower; first target mean; keep a runner if trend strength stays positive.
Mean-revert short - State is Ranging. z tags the extreme upper, an Extreme Bearish marker prints, then a Bearish Entry prints on the leave. Stop above extreme upper; target the mean; consider a runner toward the lower channel if strength turns negative.
Potential Questions you might have
Why z-score instead of fixed offsets - Because the bands adapt with volatility. When the tape gets quiet the rails tighten, when it runs hot the rails expand. Your entries stay normalized.
Do I need both modes - No. Many users run only trend pullbacks or only mean-reversions. The tool lets you toggle what you need and keep the chart readable.
Multi-timeframe workflow - A common approach is to set bias from a higher timeframe’s trend state and execute on a lower timeframe’s signals that align with it.
Summary
Z-Score Trend Channels gives you an adaptive mean, volatility-aware rails, a simple trend lens, and clear signals. Trade the trend by buying pullbacks in green and selling pullbacks in red, or fade stretched extremes back to the mean with defined risk. One framework, two strategies, consistent logic.

Trojan Cycle: Dip & Profit Hunter📉 Crypto is changing. Your signals should too.
This script doesn’t try to outguess price — it helps you track capital rotation and flow behavior in alignment with the evolving macro structure of the digital asset market.
Trojan Cycle: Dip & Profit Hunter is a signal engine built to support and validate the capital rotation models outlined in the Trojan Cycle and Synthetic Rotation theses — available via RWCS_LTD’s published charts
It is not a classic “buy low, sell high” tool. It is a structural filter that uses price/volume statistics to surface accumulation zones, synthetic traps, and macro context shifts — all aligned with the institutionalization of crypto post-2024.
🧠 Purpose & Value
Crypto no longer follows the retail-led, halving-driven pattern of 2017 or 2021.
Instead, institutional infrastructure, regulatory filters, and equity-market Trojan horses define the new path of capital.
This tool helps you visualize that path by interpreting behavior through statistical imbalances and real-time momentum signals.
Use it to:
Track where capital is accumulating or exiting
Identify signals consistent with true cycle rotation (vs. synthetic traps)
Validate your macro view with real-time statistical context
🔍 How It Works
The engine combines four signal layers:
1. Z-Score Logic
- Measures how far price and volume have deviated from their mean
- Detects dips, blowoffs, and exhaustion zones
2. Percentile Logic
- Compares current price and volume to historical rank distribution
- Flags statistically rare conditions (e.g. bottom 10% price, top 90% volume)
3. Combined Context Engine
- Integrates both models to generate one of 36 unique output states
- Each state provides a labeled market context (e.g., 🟢 Confluent Buy, 🔴 Confluent Sell, 🧨 Synthetic Trap )
4. Momentum Spread & Divergence
- Measures whether price is leading volume (trap risk) or volume is leading price (accumulation)
- Outputs intuitive momentum context with emoji-coded alerts
📋 What You See
🧠 Contextual Table UI with key Z-Scores, percentiles, signals, and market commentary
🎯 Emoji-coded signals to quickly grasp high-probability setups or risk zones
🌊 Optional overlays: price/volume divergence, momentum spread
🎨 Visual table customization (size, position) and chart highlights for signal clarity
🔔 Alert System
✅ Single dynamic alert using alert() that only fires when signal context changes
Prevents alert fatigue and allows clean webhook/automation integration
🧭 Use Cases
For macro cycle traders: Track where we are in the Trojan Cycle using statistical context
For thesis explorers: Use the 36-output signal map to match against your rotation thesis
For capital rotation watchers: Identify structural setups consistent with ETF-driven or compliance-filtered flow
For narrative skeptics: Avoid synthetic altseason traps where volume lags or flow dries up
🧪 Suggested Pairing for Thesis Validation
To use this tool as part of a thesis-confirmation framework , pair it with:
BTC.D — Bitcoin Dominance
ETH/BTC — Ethereum strength vs. Bitcoin
TOTALE100/ETH — Altcoin strength relative to ETH
RWCS_LTD’s published charts and macro cycle models
🏁 Final Note
Crypto has matured. So should your signals.
This tool doesn’t try to game the next 2 candles. It helps you understand the current phase in a compliance-filtered, institutionalized rotation model.
It’s not built for hype — it’s built for conviction.
Explore the thesis → Validate the structure → Trade with clarity.
🚨 Disclaimer
This script is not financial advice. It is an analytical tool designed to support market structure research and rotation thesis validation. Use this as part of a broader framework including technical structure, dominance charts, and macro data.

QFisher-R™ [ParadoxAlgo]QFISHER-R™ (Regime-Aware Fisher Transform)
A research/education tool that helps visualize potential momentum exhaustion and probable inflection zones using a quantitative, non-repainting Fisher framework with regime filters and multi-timeframe (MTF) confirmation.
What it does
Converts normalized price movement into a stabilized Fisher domain to highlight potential turning points.
Uses adaptive smoothing, robust (MAD/quantile) thresholds, and optional MTF alignment to contextualize extremes.
Provides a Reversal Probability Score (0–100) to summarize signal confluence (extreme, slope, cross, divergence, regime, and MTF checks).
Key features
Non-repainting logic (bar-close confirmation; security() with no lookahead).
Dynamic exhaustion bands (data-driven thresholds vs fixed ±2).
Adaptive smoothing (efficiency-ratio based).
Optional divergence tags on structurally valid pivots.
MTF confirmation (same logic computed on a higher timeframe).
Compact visuals with subtle plotting to reduce chart clutter.
Inputs (high level)
Source (e.g., HLC3 / Close / HA).
Core lookback, fast/slow range blend, and ER length.
Band sensitivity (robust thresholding).
MTF timeframe(s) and agreement requirement.
Toggle divergence & intrabar previews (default off).
Signals & Alerts
Turn Candidate (Up/Down) when multiple conditions align.
Trade-Grade Turn when score ≥ threshold and MTF agrees.
Divergence Confirmed when structural criteria are met.
Alerts are generated on confirmed bar close by default. Optional “preview” mode is available for experimentation.
How to use
Start on your preferred timeframe; optionally enable an HTF (e.g., 4×) for confirmation.
Look for RPS clusters near the exhaustion bands, slope inflections, and (optionally) divergences.
Combine with your own risk management, liquidity, and trend context.
Paper test first and calibrate thresholds to your instrument and timeframe.
Notes & limitations
This is not a buy/sell signal generator and does not predict future returns.
Readings can remain extreme during strong trends; use HTF context and your own filters.
Parameters are intentionally conservative by default; adjust carefully.
Compliance / Disclaimer
Educational & research tool only. Not financial advice. No recommendation to buy/sell any security or derivative.
Past performance, backtests, or examples (if any) are not indicative of future results.
Trading involves risk; you are responsible for your own decisions and risk management.
Built upon the Fisher Transform concept (Ehlers); all modifications, smoothing, regime logic, scoring, and visualization are original work by Paradox Algo.

Volume Footprint Anomaly Scanner [PhenLabs]📊 PhenLabs - Volume Footprint Anomaly Scanner (VFAS)
Version: PineScript™ v6
📌 Description
The PhenLabs Volume Footprint Anomaly Scanner (VFAS) is an advanced Pine Script indicator designed to detect and highlight significant imbalances in buying and selling pressure within individual price bars. By analyzing a calculated "Delta" – the net difference between estimated buy and sell volume – and employing statistical Z-score analysis, VFAS pinpoints moments when buying or selling activity becomes unusually dominant. This script was created not in hopes of creating a "Buy and Sell" indicator but rather providing the user with a more in-depth insight into the intrabar volume delta and how it can fluctuate in unusual ways, leading to anomalies that can be capitalized on.
This indicator helps traders identify high-conviction points where strong market participants are active, signaling potential shifts in momentum or continuation of a trend. It aims to provide a clearer understanding of underlying market dynamics, allowing for more informed decision-making in various trading strategies, from identifying entry points to confirming trend strength.
🚀 Points of Innovation
● Z-Score for Delta Analysis : Utilizes statistical Z-scores to objectively identify statistically significant anomalies in buying/selling pressure, moving beyond simple, arbitrary thresholds.
● Dynamic Confidence Scoring : Assigns a multi-star confidence rating (1-4 stars) to each signal, factoring in high volume, trend alignment, and specific confirmation criteria, providing a nuanced view of signal strength.
● Integrated Trend Filtering : Offers an optional Exponential Moving Average (EMA)-based trend filter to ensure signals align with the broader market direction, reducing false positives in ranging markets.
● Strict Confirmation Logic : Implements specific confirmation criteria for higher-confidence signals, including price action and a time-based gap from previous signals, enhancing reliability.
● Intuitive Info Dashboard : Provides a real-time summary of market trend and the latest signal's direction and confidence directly on the chart, streamlining information access.
🔧 Core Components
● Core Delta Engine : Estimates the net buying/selling pressure (bar Delta) by analyzing price movement within each bar relative to volume. It also calculates average volume to identify bars with unusually high activity.
● Anomaly Detection (Z-Score) : Computes the Z-score for the current bar's Delta, indicating how many standard deviations it is from its recent average. This statistical measure is central to identifying significant anomalies.
● Trend Filter : Utilizes a dual Exponential Moving Average (EMA) cross-over system to define the prevailing market trend (uptrend, downtrend, or range), providing contextual awareness.
● Signal Processing & Confidence Algorithm : Evaluates anomaly conditions against trend filters and confirmation rules, then calculates a dynamic confidence score to produce actionable, contextualized signal information.
🔥 Key Features
● Advanced Delta Anomaly Detection : Pinpoints bars with exceptionally high buying or selling pressure, indicating potential institutional activity or strong market conviction.
● Multi-Factor Confidence Scoring : Each signal comes with a 1-4 star rating, clearly communicating its reliability based on high volume, trend alignment, and specific confirmation criteria.
● Optional Trend Alignment : Users can choose to filter signals, so only those aligned with the prevailing EMA-defined trend are displayed, enhancing signal quality.
● Interactive Signal Labels : Displays compact labels on the chart at anomaly points, offering detailed tooltips upon hover, including signal type, direction, confidence, and contextual information.
● Customizable Bar Colors : Visually highlights bars with Delta anomalies, providing an immediate visual cue for strong buying or selling activity.
● Real-time Info Dashboard : A clean, customizable dashboard shows the current market trend and details of the latest detected signal, keeping key information accessible at a glance.
● Configurable Alerts : Set up alerts for bullish or bearish Delta anomalies to receive real-time notifications when significant market pressure shifts occur.
🎨 Visualization
Signal Labels :
* Placed at the top/bottom of anomaly bars, showing a "📈" (bullish) or "📉" (bearish) icon.
* Tooltip: Hovering over a label reveals detailed information: Signal Type (e.g., "Delta Anomaly"), Direction, Confidence (e.g., "★★★☆"), and a descriptive explanation of the anomaly.
* Interpretation: Clearly marks actionable signals and provides deep insights without cluttering the chart, enabling quick assessment of signal strength and context.
● Info Dashboard :
* Located at the top-right of the chart, providing a clean summary.
* Displays: "PhenLabs - VFAS" header, "Market Trend" (Uptrend/Downtrend/Range with color-coded status), and "Direction | Conf." (showing the last signal's direction and star confidence).
* Optional "💡 Hover over signals for details" reminder.
* Interpretation: A concise, real-time summary of the market's pulse and the most recent high-conviction event, helping traders stay informed at a glance.
📖 Usage Guidelines
Setting Categories
⚙️ Core Delta & Volume Engine
● Minimum Volume Lookback (Bars)
○ Default: 9
○ Range: Integer (e.g., 5-50)
○ Description: Defines the number of preceding bars used to calculate the average volume and delta. Bars with volume below this average won't be considered for high-volume signals. A shorter lookback is more reactive to recent changes, while a longer one provides a smoother average.
📈 Anomaly Detection Settings
Delta Z-Score Anomaly Threshold
○ Default: 2.5
○ Range: Float (e.g., 1.0-5.0+)
○ Description: The number of standard deviations from the mean that a bar's delta must exceed to be considered a significant anomaly. A higher threshold means fewer, but potentially stronger, signals. A lower threshold will generate more signals, which might include less significant events. Experiment to find the optimal balance for your trading style.
🔬 Context Filters
Enable Trend Filter
○ Default: False
○ Range: Boolean (True/False)
○ Description: When enabled, signals will only be generated if they align with the current market trend as determined by the EMAs (e.g., only bullish signals in an uptrend, bearish in a downtrend). This helps to filter out counter-trend noise.
● Trend EMA Fast
○ Default: 50
○ Range: Integer (e.g., 10-100)
○ Description: The period for the faster Exponential Moving Average used in the trend filter. In combination with the slow EMA, it defines the trend direction.
● Trend EMA Slow
○ Default: 200
○ Range: Integer (e.g., 100-400)
○ Description: The period for the slower Exponential Moving Average used in the trend filter. The relationship between the fast and slow EMA determines if the market is in an uptrend (fast > slow) or downtrend (fast < slow).
🎨 Visual & UI Settings
● Show Info Dashboard
○ Default: True
○ Range: Boolean (True/False)
○ Description: Toggles the visibility of the dashboard on the chart, which provides a summary of market trend and the last detected signal.
● Show Dashboard Tooltip
○ Default: True
○ Range: Boolean (True/False)
○ Description: Toggles a reminder message in the dashboard to hover over signal labels for more detailed information.
● Show Delta Anomaly Bar Colors
○ Default: True
○ Range: Boolean (True/False)
○ Description: Enables or disables the coloring of bars based on their delta direction and whether they represent a significant anomaly.
● Show Signal Labels
○ Default: True
○ Range: Boolean (True/False)
○ Description: Controls the visibility of the “📈” or “📉” labels that appear on the chart when a delta anomaly signal is generated.
🔔 Alert Settings
Alert on Delta Anomaly
○ Default: True
○ Range: Boolean (True/False)
○ Description: When enabled, this setting allows you to set up alerts in TradingView that will trigger whenever a new bullish or bearish delta anomaly is detected.
✅ Best Use Cases
Early Trend Reversal / Continuation Detection: Identify strong surges of buying/selling pressure at key support/resistance levels that could indicate a reversal or the continuation of a strong move.
● Confirmation of Breakouts: Use high-confidence delta anomalies to confirm the validity of price breakouts, indicating strong conviction behind the move.
● Entry and Exit Points: Pinpoint precise entry opportunities when anomalies align with your trading strategy, or identify potential exhaustion signals for exiting trades.
● Scalping and Day Trading: The indicator’s sensitivity to intraday buying/selling imbalances makes it highly effective for short-term trading strategies.
● Market Sentiment Analysis: Gain a real-time understanding of underlying market sentiment by observing the prevalence and strength of bullish vs. bearish anomalies.
⚠️ Limitations
Estimated Delta: The script uses a simplified method to estimate delta based on bar close relative to its range, not actual order book or footprint data. While effective, it’s an approximation.
● Sensitivity to Z-Score Threshold: The effectiveness heavily relies on the `Delta Z-Score Anomaly Threshold`. Too low, and you’ll get many false positives; too high, and you might miss valid signals.
● Confirmation Criteria: The 4-star confidence level’s “confirmation” relies on specific subsequent bar conditions and previous confirmed signals, which might be too strict or specific for all contexts.
● Requires Context: While powerful, VFAS is best used in conjunction with other technical analysis tools and price action to form a comprehensive trading strategy. It is not a standalone “buy/sell” signal.
💡 What Makes This Unique
Statistical Rigor: The application of Z-score analysis to bar delta provides an objective, statistically-driven way to identify true anomalies, moving beyond arbitrary thresholds.
● Multi-Factor Confidence Scoring: The unique 1-4 star confidence system integrates multiple market dynamics (volume, trend alignment, specific follow-through) into a single, easy-to-interpret rating.
● User-Friendly Design: From the intuitive dashboard to the detailed signal tooltips, the indicator prioritizes clear and accessible information for traders of all experience levels.
🔬 How It Works
1. Bar Delta Calculation:
● The script first estimates the “buy volume” and “sell volume” for each bar. This is done by assuming that volume proportional to the distance from the low to the close represents buying, and volume proportional to the distance from the high to the close represents selling.
● How this contributes: This provides a proxy for the net buying or selling pressure (delta) within that specific price bar, even without access to actual footprint data.
2. Volume & Delta Z-Score Analysis:
● The average volume over a user-defined lookback period is calculated. Bars with volume less than twice this average are generally considered of lower interest.
● The Z-score for the calculated bar delta is computed. The Z-score measures how many standard deviations the current bar’s delta is from its average delta over the `Minimum Volume Lookback` period.
● How this contributes: A high positive Z-score indicates a bullish delta anomaly (significantly more buying than usual), while a high negative Z-score indicates a bearish delta anomaly (significantly more selling than usual). This identifies statistically unusual levels of pressure.
3. Trend Filtering (Optional):
● Two Exponential Moving Averages (Fast and Slow EMA) are used to determine the prevailing market trend. An uptrend is identified when the Fast EMA is above the Slow EMA, and a downtrend when the Fast EMA is below the Slow EMA.
● How this contributes: If enabled, the indicator will only display bullish delta anomalies during an uptrend and bearish delta anomalies during a downtrend, helping to confirm signals within the broader market context and avoid counter-trend signals.
4. Signal Generation & Confidence Scoring:
● When a delta Z-score exceeds the user-defined anomaly threshold, a signal is generated.
● This signal is then passed through a multi-factor confidence algorithm (`f_calculateConfidence`). It awards stars based on: high volume presence, alignment with the overall trend (if enabled), and a fourth star for very strong Z-scores (above 3.0) combined with specific follow-through candle patterns after a cooling-off period from a previous confirmed signal.
● How this contributes: Provides a qualitative rating (1-4 stars) for each anomaly, allowing traders to quickly assess the potential significance and reliability of the signal.
💡 Note:
The PhenLabs Volume Footprint Anomaly Scanner is a powerful analytical tool, but it’s crucial to understand that no indicator guarantees profit. Always backtest and forward-test the indicator settings on your chosen assets and timeframes. Consider integrating VFAS with your existing trading strategy, using its signals as confirmation for entries, exits, or trend bias. The Z-score threshold is highly customizable; lower values will yield more signals (including potential noise), while higher values will provide fewer but potentially higher-conviction signals. Adjust this parameter based on market volatility and your risk tolerance. Remember to combine statistical insights from VFAS with price action, support/resistance levels, and your overall market outlook for optimal results.

Stochastic Z-Score [AlgoAlpha]🟠 OVERVIEW
This indicator is a custom-built oscillator called the Stochastic Z-Score , which blends a volatility-normalized Z-Score with stochastic principles and smooths it using a Hull Moving Average (HMA). It transforms raw price deviations into a normalized momentum structure, then processes that through a stochastic function to better identify extreme moves. A secondary long-term momentum component is also included using an ALMA smoother. The result is a responsive oscillator that reacts to sharp imbalances while remaining stable in sideways conditions. Colored histograms, dynamic oscillator bands, and reversal labels help users visually assess shifts in momentum and identify potential turning points.
🟠 CONCEPTS
The Z-Score is calculated by comparing price to its mean and dividing by its standard deviation—this normalizes movement and highlights how far current price has stretched from typical values. This Z-Score is then passed through a stochastic function, which further refines the signal into a bounded range for easier interpretation. To reduce noise, a Hull Moving Average is applied. A separate long-term trend filter based on the ALMA of the Z-Score helps determine broader context, filtering out short-term traps. Zones are mapped with thresholds at ±2 and ±2.5 to distinguish regular momentum from extreme exhaustion. The tool is built to adapt across timeframes and assets.
🟠 FEATURES
Z-Score histogram with gradient color to visualize deviation intensity (optional toggle).
Primary oscillator line (smoothed stochastic Z-Score) with adaptive coloring based on momentum direction.
Dynamic bands at ±2 and ±2.5 to represent regular vs extreme momentum zones.
Long-term momentum line (ALMA) with contextual coloring to separate trend phases.
Automatic reversal markers when short-term crosses occur at extremes with supporting long-term momentum.
Built-in alerts for oscillator direction changes, zero-line crosses, overbought/oversold entries, and trend confirmation.
🟠 USAGE
Use this script to track momentum shifts and identify potential reversal areas. When the oscillator is rising and crosses above the previous value—especially from deeply negative zones (below -2)—and the ALMA is also above zero, this suggests bullish reversal conditions. The opposite holds for bearish setups. Reversal labels ("▲" and "▼") appear only when both short- and long-term conditions align. The ±2 and ±2.5 thresholds act as momentum warning zones; values inside are typical trends, while those beyond suggest exhaustion or extremes. Adjust the length input to match the asset’s volatility. Enable the histogram to explore underlying raw Z-Score movements. Alerts can be configured to notify key changes in momentum or zone entries.

Crowding model ║ BullVision🔬 Overview
The Crypto Crowding Model Pro is a sophisticated analytical tool designed to visualize and quantify market conditions across multiple cryptocurrencies. By leveraging Relative Strength Index (RSI) and Z-score calculations, this indicator provides traders with an intuitive and detailed snapshot of current crypto market dynamics, highlighting areas of extreme momentum, crowded trades, and potential reversal points.
⚙️ Key Concepts
📊 RSI and Z-Score Analysis
RSI (Relative Strength Index) evaluates the momentum and strength of each cryptocurrency, identifying overbought or oversold conditions.
Z-Score Normalization measures each asset's current price deviation relative to its historical average, identifying statistically significant extremes.
🎯 Crowding Analytics
An integrated analytics panel provides real-time crowding metrics, quantifying market sentiment into four distinct categories:
🔥 FOMO (Fear of Missing Out): High momentum, potential exhaustion.
❄️ Fear: Low momentum, potential reversal or consolidation.
📈 Recovery: Moderate upward momentum after a downward trend.
💪 Strength: Stable bullish conditions with sustained momentum.
🖥️ Visual Scatter Plot
Assets are plotted on a dynamic scatter plot, positioning each cryptocurrency according to its RSI and Z-score.
Color coding, symbol shapes, and sizes help quickly identify main market segments (BTC, ETH, TOTAL, OTHERS) and individual asset conditions.
🧩 Quadrant Classification
Assets are categorized into four quadrants based on their momentum and deviation:
Overbought Extended: High RSI and positive Z-score.
Recovery Phase: Low RSI but positive Z-score.
Oversold Compressed: Low RSI and negative Z-score.
Strong Consolidation: High RSI but negative Z-score.
🔧 User Customization
🎨 Visual Settings
Bar Scale: Adjust the scatter plot visual scale.
Asset Visibility: Optionally display key market benchmarks (TOTAL, BTC, ETH, OTHERS).
Gradient Background: Enhances visual interpretation of asset clusters.
Crowding Analytics Panel: Toggle the analytics panel on/off.
📊 Indicator Parameters
RSI Length: Defines the calculation period for RSI.
Z-score Lookback: Historical lookback period for normalization.
Crowding Alert Threshold: Sets alert sensitivity for crowded market conditions.
🎯 Zone Settings
Quadrant Labels: Displays descriptive labels for each quadrant.
Danger Zones: Highlights extreme RSI levels indicative of heightened market risk.
📈 Visual Output
Dynamic Scatter Plot: Visualizes asset positioning clearly and intuitively.
Gradient and Grid: Professional gridlines and subtle gradient backgrounds assist visual assessment.
Danger Zone Highlights: Visually indicates RSI extremes to warn of potential market turning points.
Crowding Analytics Panel: Real-time summary of market sentiment and asset distribution.
🔍 Use Cases
This indicator is particularly beneficial for traders and analysts looking to:
Identify crowded trades and potential reversal points.
Quickly assess overall market sentiment and individual asset strength.
Integrate a robust momentum analysis into broader technical or fundamental strategies.
Enhance market timing and improve risk management decisions.
⚠️ Important Notes
This indicator does not provide explicit buy or sell signals.
It is intended solely for informational, analytical, and educational purposes.
Past performance and signals are not indicative of future market results.
Always combine with additional tools and analysis as part of comprehensive decision-making.

Z-scored ZLEMA | OquantZ-Scored ZLEMA | Oquant
This indicator combines the Zero-Lag Exponential Moving Average (ZLEMA) with Z-score normalization to present recent ZLEMA values relative to its mean. It helps users observe trend direction and momentum with reduced lag, while also highlighting potential overbought or oversold levels based on how far ZLEMA values deviate from their mean.
🧠 Concept Overview
📉 Zero Lag Exponential Moving Average (ZLEMA)
The EMA is a popular tool that calculates an average price, but unlike a simple moving average, it gives more weight to recent prices. This means the EMA reacts faster to new price changes and is less affected by older data. However, even with this weighting, the EMA still introduces some lag.
ZLEMA improves on the EMA by reducing this lag. It does this by adjusting how it accounts for previous prices, effectively "shifting" the data to better align the average with current market action. The result is an average that stays smooth but responds more quickly to real price changes—helping traders spot turning points or trend shifts earlier without being fooled by random noise.
📏 Z-score Normalization
Once ZLEMA is calculated, the indicator applies Z-score normalization to measure how far the current ZLEMA value is from its mean. The Z-score expresses this difference using standard deviations, providing a clear, standardized scale. This helps highlight when price moves are unusually strong—either upward or downward—beyond normal fluctuations.
🔍 How This Indicator Works
Smooth Price Data with ZLEMA
The indicator begins by applying the Zero-Lag Exponential Moving Average (ZLEMA) to the chosen price data. Unlike a regular moving average, ZLEMA reduces the typical delay by adjusting the input data before averaging. It does this by "shifting" the price series to remove the lag caused by older prices. This way, ZLEMA stays smooth but reacts more quickly to recent price changes—helping the indicator follow market moves faster without being too noisy.
Normalize ZLEMA values Using Z-score
Once ZLEMA is calculated, the indicator applies Z-score normalization to measure how far the current ZLEMA value is from its mean. The Z-score expresses this difference in terms of standard deviations, creating a clear, standardized scale. This helps highlight when price moves are unusually strong—either up or down—beyond normal fluctuations.
Set Signal Thresholds
Two threshold levels are set on the Z-score scale—crossing above the upper threshold is considered a long (buy) signal, indicating bullish momentum, while crossing below the lower threshold is considered a short (sell) signal, indicating bearish momentum.
Show Visual Signals on the Chart
The Z-score and bars are plotted with colors: green when Z-score is above the bullish threshold, purple when Z-score is below the bearish threshold.
⚙️ Customizable Inputs
Source: Choose the price source (close, open, etc.) for calculations.
ZLEMA Length: Adjust the ZLEMA length to control smoothness versus responsiveness.
Z-score period: Set the Z-score period to define how far back the indicator measures normal price behavior.
Thresholds: Adjust the upper and lower thresholds to control how sensitive the indicator is to strong momentum changes.
📈 Practical Use
This indicator helps identify trend directions and changes faster by combining ZLEMA with statistical analysis. It highlights when price moves are stronger than normal, making it easier to spot early signs of momentum shifts. Traders can use it to confirm trends or detect potential reversals with more timely signals.
🔔 Alert Support
This indicator includes optional built-in alert conditions that notify you when the Z-score crosses above the bullish threshold (long signal) or below the bearish threshold (short signal). You can enable these alerts to get timely updates on potential momentum shifts without constantly watching the chart.
⚠️ Disclaimer: This indicator is intended for educational and informational purposes only. Trading/investing involves risk, and past performance does not guarantee future results. Always test and evaluate indicators/strategies before applying them in live markets. Use at your own risk.

Uptrick: Universal Z-Score ValuationOverview
The Uptrick: Universal Z-Score Valuation is a tool designed to help traders spot when the market might be overreacting—whether that’s on the upside or the downside. It does this by combining the Z-scores of multiple key indicators into a single average, letting you see how far the current market conditions have stretched away from “normal.” This average is shown as a smooth line, supported by color-coded visuals, signal markers, optional background highlights, and a live breakdown table that shows the contribution of each indicator in real time. The focus here is on spotting potential reversals, not following trends. The indicator works well across all timeframes and asset classes, from fast intraday charts like the 1-minute and 5-minute, to higher timeframes such as the 4-hour, daily, or even weekly. Its universal design makes it suitable for any market — whether you're trading crypto, stocks, forex, or commodities.
Introduction
To understand what this indicator does, let’s start with the idea of a Z-score. In simple terms, a Z-score tells you how far a number is from the average of its recent history, measured in standard deviations. If the price of an asset is two standard deviations above its mean, that means it’s statistically “rare” or extended. That doesn’t guarantee a reversal—but it suggests the move is unusual enough to pay attention.
This concept isn’t new, but what this indicator does differently is apply the Z-score to a wide set of market signals—not just price. It looks at momentum, volatility, volume, risk-adjusted performance, and even institutional price baselines. Each of those indicators is normalized using Z-scores, and then they’re combined into one average. This gives you a single, easy-to-read line that summarizes whether the entire market is behaving abnormally. Instead of reacting to one indicator, you’re reacting to a statistically balanced blend.
Purpose
The goal of this script is to catch turning points—places where the market may be topping out or bottoming after becoming overstretched. It’s built for traders who want to fade sharp moves rather than follow trends. Think of moments when price explodes upward and starts pulling away from every moving average, volume spikes, volatility rises, and RSI shoots up. This tool is meant to spot those situations—not just when price is stretched, but when multiple different indicators agree that something is overdone.
Originality and Uniqueness
Most indicators that use Z-scores only apply them to one thing—price, RSI, or maybe Bollinger Bands. This one is different because it treats each indicator as a contributor to the full picture. You decide which ones to include, and the script averages them out. This makes the tool flexible but also deeply informative.
It doesn’t rely on complex or hidden math. It uses basic Z-score formulas, applies them to well-known indicators, and shows you the result. What makes it unique is the way it brings those signals together—statistically, visually, and interactively—so you can see what’s happening in the moment with full transparency. It’s not trying to be flashy or predictive. It’s just showing you when things have gone too far, too fast.
Inputs and Parameters
This indicator includes a wide range of configurable inputs, allowing users to customize which components are included in the Z-score average, how each indicator is calculated, and how results are displayed visually. Below is a detailed explanation of each input:
General Settings
Z-Score Lookback (default: 100): Number of bars used to calculate the mean and standard deviation for Z-score normalization. Larger values smooth the Z-scores; smaller values make them more reactive.
Bar Color Mode (default: None): Determines how bars are visually colored. Options include: None: No candle coloring applied. - Heat: Smooth gradient based on the Z-score value. - Latest Signal: Applies a solid color based on the most recent buy or sell signal
Boolean - General
Plot Universal Valuation Line (default: true): If enabled, plots the average Z-score (zAvg) line in the separate pane.
Show Signals (default: true): Displays labels ("𝓤𝓹" for buy, "𝓓𝓸𝔀𝓷" for sell) when zAvg crosses above or below user-defined thresholds.
Show Z-Score Table (default: true): Displays a live table listing each enabled indicator's Z-score and the current average.
Select Indicators
These toggles enable or disable each indicator from contributing to the Z-score average:
Use VWAP Z-Score (default: true)
Use Sortino Z-Score (default: true)
Use ROC Z-Score (default: true)
Use Price Z-Score (default: true)
Use MACD Histogram Z-Score (default: false)
Use Bollinger %B Z-Score (default: false)
Use Stochastic K Z-Score (default: false)
Use Volume Z-Score (default: false)
Use ATR Z-Score (default: false)
Use RSI Z-Score (default: false)
Use Omega Z-Score (default: true)
Use Sharpe Z-Score (default: true)
Only enabled indicators are included in the average. This modular design allows traders to tailor the signal mix to their preferences.
Indicator Lengths
These inputs control how each individual indicator is calculated:
MACD Fast Length (default: 12)
MACD Slow Length (default: 26)
MACD Signal Length (default: 9)
Bollinger Basis Length (default: 20): Used to compute the Bollinger %B.
Bollinger Deviation Multiplier (default: 2.0): Standard deviation multiplier for the Bollinger Band calculation.
Stochastic Length (default: 14)
ATR Length (default: 14)
RSI Length (default: 14)
ROC Length (default: 10)
Zones
These thresholds define key signal levels for the Z-score average:
Neutral Line Level (default: 0): Baseline for the average Z-score.
Bullish Zone Level (default: -1): Optional intermediate zone suggesting early bullish conditions.
Bearish Zone Level (default: 1): Optional intermediate zone suggesting early bearish conditions.
Z = +2 Line Level (default: 2): Primary threshold for bearish signals.
Z = +3 Line Level (default: 3): Extreme bearish warning level.
Z = -2 Line Level (default: -2): Primary threshold for bullish signals.
Z = -3 Line Level (default: -3): Extreme bullish warning level.
These zone levels are used to generate signals, fill background shading, and draw horizontal lines for visual reference.
Why These Indicators Were Merged
Each indicator in this script was chosen for a specific reason. They all measure something different but complementary.
The VWAP Z-score helps you see when price has moved far from the volume-weighted average, often used by institutions.
Sortino Ratio Z-score focuses only on downside risk, which is often more relevant to traders than overall volatility.
ROC Z-score shows how fast price is changing—strong momentum may burn out quickly.
Price Z-score is the raw measure of how far current price has moved from its mean.
RSI Z-score shows whether momentum itself is stretched.
MACD Histogram Z-score captures shifts in trend strength and acceleration.
%B (Bollinger) Z-score indicates how close price is to the upper or lower volatility envelope.
Stochastic K Z-score gives a sense of how high or low price is relative to its recent range.
Volume Z-score shows when trading activity is unusually high or low.
ATR Z-score gives a read on volatility, showing if price movement is expanding or contracting.
Sharpe Z-score measures reward-to-risk performance, useful for evaluating trend quality.
Omega Z-score looks at the ratio of good returns to bad ones, offering a more nuanced view of efficiency.
By normalizing each of these using Z-scores and averaging only the ones you turn on, the script creates a flexible, balanced view of the market’s statistical stretch.
Calculations
The core formula is the standard Z-score:
Z = (current value - average) / standard deviation
Every indicator uses this formula after it’s calculated using your chosen settings. For example, RSI is first calculated as usual, then its Z-score is calculated over your selected lookback period. The script does this for every indicator you enable. Then it averages those Z-scores together to create a single value: zAvg. That value is plotted and used to generate visual cues, signals, table values, background color changes, and candle coloring.
Sequence
Each selected indicator is calculated using your custom input lengths.
The Z-score of each indicator is computed using the shared lookback period.
All active Z-scores are added up and averaged.
The resulting zAvg value is plotted as a line.
Signal conditions check if zAvg crosses user-defined thresholds (default: ±2).
If enabled, the script plots buy/sell signal labels at those crossover points.
The candle color is updated using your selected mode (heatmap or signal-based).
If extreme Z-scores are reached, background highlighting is applied.
A live table updates with each individual Z-score so you know what’s driving the signal.
Features
This script isn’t just about stats—it’s about making them usable in real time. Every feature has a clear reason to exist, and they’re all there to give you a better read on market conditions.
1. Universal Z-Score Line
This is your primary reference. It reflects the average Z-score across all selected indicators. The line updates live and is color-coded to show how far it is from neutral. The further it gets from 0, the brighter the color becomes—cyan for deeply oversold conditions, magenta for overbought. This gives you instant feedback on how statistically “hot” or “cold” the market is, without needing to read any numbers.
2. Signal Labels (“𝓤𝓹” and “𝓓𝓸𝔀𝓷”)
When the average Z-score drops below your lower bound, you’ll see a "𝓤𝓹" label below the bar, suggesting potential bullish reversal conditions. When it rises above the upper bound, a "𝓓𝓸𝔀𝓷" label is shown above the bar—indicating possible bearish exhaustion. These labels are visually clear and minimal so they don’t clutter your chart. They're based on clear crossover logic and do not repaint.
3. Real-Time Z-Score Table
The table shows each indicator's individual Z-score and the final average. It updates every bar, giving you a transparent breakdown of what’s happening under the hood. If the market is showing an extreme average score, this table helps you pinpoint which indicators are contributing the most—so you’re not just guessing where the pressure is coming from.
4. Bar Coloring Modes
You can choose from three modes:
None: Keeps your candles clean and untouched.
Heat: Applies a smooth gradient color based on Z-score intensity. As conditions become more extreme, candle color transitions from neutral to either cyan (bullish pressure) or magenta (bearish pressure).
Latest Signal: Applies hard coloring based on the most recent signal—greenish for a buy, purple for a sell. This mode is great for tracking market state at a glance without relying on a gradient.
Every part of the candle is colored—body, wick, and border—for full visibility.
5. Background Highlighting
When zAvg enters an extreme zone (typically above +2 or below -2), the background shifts color to reflect the market’s intensity. These changes aren’t overwhelming—they’re light fills that act as ambient warnings, helping you stay aware of when price might be reaching a tipping point.
6. Customizable Zone Lines and Fills
You can define what counts as neutral, overbought, and oversold using manual inputs. Horizontal lines show your thresholds, and shaded regions highlight the most extreme zones (+2 to +3 and -2 to -3). These lines give you visual structure to understand where price currently stands in relation to your personal reversal model.
7. Modular Indicator Control
You don’t have to use all the indicators. You can enable or disable any of the 12 with a simple checkbox. This means you can build your own “blend” of market context—maybe you only care about RSI, price, and volume. Or maybe you want everything on. The script adapts accordingly, only averaging what you select.
8. Fully Customizable Sensitivity and Lengths
You can adjust the Z-score lookback length globally (default 100), and tweak individual indicator lengths separately. This lets you tune the indicator’s responsiveness to suit your trading style—slower for longer swings, faster for scalping.
9. Clean Integration with Any Chart Layout
All visual elements are designed to be informative without taking over your chart. The coloring is soft but clear, the labels are readable without being huge, and you can turn off any feature you don’t need. The indicator can work as a full dashboard or as a simple line with a couple of alerts—it’s up to you.
10. Precise, Real-Time Signal Logic
The crossover logic for signals is exact and only fires when the Z-score moves across your defined boundary. No estimation, no delay. Everything is calculated based on current and previous bar data, and nothing repaints or back-adjusts.
Conclusion
The Universal Z-Score Valuation indicator is a tool for traders who want a clear, unbiased way to detect overextension. Instead of relying on a single signal, you get a composite of several market perspectives—momentum, volatility, volume, and more—all standardized into a single view. The script gives you the freedom to control the logic, the visuals, and the components. Whether you use it as a confirmation tool or a primary signal source, it’s designed to give you clarity when markets become chaotic.
Disclaimer
This indicator is for research and educational use only. It does not constitute financial advice or guarantees of performance. All trading involves risk, and users should test any strategy thoroughly before applying it to live markets. Use this tool at your own discretion.

Z Score Overlay [BigBeluga]🔵 OVERVIEW
A clean and effective Z-score overlay that visually tracks how far price deviates from its moving average. By standardizing price movements, this tool helps traders understand when price is statistically extended or compressed—up to ±4 standard deviations. The built-in scale and real-time bin markers offer immediate context on where price stands in relation to its recent mean.
🔵 CONCEPTS
Z Score Calculation:
Z = (Close − SMA) ÷ Standard Deviation
This formula shows how many standard deviations the current price is from its mean.
Statistical Extremes:
• Z > +2 or Z < −2 suggests statistically significant deviation.
• Z near 0 implies price is close to its average.
Standardization of Price Behavior: Makes it easier to compare volatility and overextension across timeframes and assets.
🔵 FEATURES
Colored Z Line: Gradient coloring based on how far price deviates—
• Red = oversold (−4),
• Green = overbought (+4),
• Yellow = neutral (~0).
Deviation Scale Bar: A vertical scale from −4 to +4 standard deviations plotted to the right of price.
Active Z Score Bin: Highlights the current Z-score bin with a “◀” arrow
Context Labels: Clear numeric labels for each Z-level from −4 to +4 along the side.
Live Value Display: Shows exact Z-score on the active level.
Non-intrusive Overlay: Can be applied directly to price chart without changing scaling behavior.
🔵 HOW TO USE
Identify overbought/oversold areas based on +2 / −2 thresholds.
Spot potential mean reversion trades when Z returns from extreme levels.
Confirm strong trends when price remains consistently outside ±2.
Use in multi-timeframe setups to compare strength across contexts.
🔵 CONCLUSION
Z Score Overlay transforms raw price action into a normalized statistical view, allowing traders to easily assess deviation strength and mean-reversion potential. The intuitive scale and color-coded display make it ideal for traders seeking objective, volatility-aware entries and exits.

40 Ticker Cross-Sectional Z-Scores [BackQuant]40 Ticker Cross-Sectional Z-Scores
BackQuant’s 40 Ticker Cross-Sectional Z-Scores is a powerful portfolio management strategy that analyzes the relative performance of up to 40 different assets, comparing them on a cross-sectional basis to identify the top and bottom performers. This indicator computes Z-scores for each asset based on their log returns and evaluates them relative to the mean and standard deviation over a rolling window. The Z-scores represent how far an asset's return deviates from the average, and these values are used to rank the assets, allowing for dynamic asset allocation based on performance.
By focusing on the strongest-performing assets and avoiding the weakest, this strategy aims to enhance returns while managing risk. Additionally, by adjusting for standard deviations, the system offers a risk-adjusted method of ranking assets, making it suitable for traders who want to dynamically allocate capital based on performance metrics rather than just price movements.
Key Features
1. Cross-Sectional Z-Score Calculation:
The system calculates Z-scores for 40 different assets, evaluating their log returns against the mean and standard deviation over a rolling window. This enables users to assess the relative performance of each asset dynamically, highlighting which assets are performing better or worse compared to their historical norms. The Z-score is a useful statistical tool for identifying outliers in asset performance.
2. Asset Ranking and Allocation:
The system ranks assets based on their Z-scores and allocates capital to the top performers. It identifies the top and bottom assets, and traders can allocate capital to the top-performing assets, ensuring that their portfolio is aligned with the best performers. Conversely, the bottom assets are removed from the portfolio, reducing exposure to underperforming assets.
3. Rolling Window for Mean and Standard Deviation Calculations:
The Z-scores are calculated based on rolling means and standard deviations, making the system adaptive to changing market conditions. This rolling calculation window allows the strategy to adjust to recent performance trends and minimize the impact of outdated data.
4. Mean and Standard Deviation Visualization:
The script provides real-time visualizations of the mean (x̄) and standard deviation (σ) of asset returns, helping traders quickly identify trends and volatility in their portfolio. These visual indicators are useful for understanding the current market environment and making more informed allocation decisions.
5. Top & Bottom Performer Tables:
The system generates tables that display the top and bottom performers, ranked by their Z-scores. Traders can quickly see which assets are outperforming and underperforming. These tables provide clear and actionable insights, helping traders make informed decisions about which assets to include in their portfolio.
6. Customizable Parameters:
The strategy allows traders to customize several key parameters, including:
Rolling Calculation Window: Set the window size for the rolling mean and standard deviation calculations.
Top & Bottom Tickers: Choose how many of the top and bottom assets to display and allocate capital to.
Table Orientation: Select between vertical or horizontal table formats to suit the user’s preference.
7. Forward Test & Out-of-Sample Testing:
The system includes out-of-sample forward tests, ensuring that the strategy is evaluated based on real-time performance, not just historical data. This forward testing approach helps validate the robustness of the strategy in dynamic market conditions.
8. Visual Feedback and Alerts:
The system provides visual feedback on the current asset rankings and allocations, with dynamic labels and plots on the chart. Additionally, users receive alerts when allocations change, keeping them informed of important adjustments.
9. Risk Management via Z-Scores and Std Dev:
The system’s approach to asset selection is based on Z-scores, which normalize performance relative to the historical mean. By incorporating standard deviation, it accounts for the volatility and risk associated with each asset. This allows for more precise risk management and portfolio construction.
10. Note on Mean Reversion Strategy:
If you take the inverse of the signals provided by this indicator, the strategy can be used for mean-reversion rather than trend-following. This would involve buying the underperforming assets and selling the outperforming ones. However, it's important to note that this approach does not work well with highly correlated assets, as the relationship between the assets could result in the same directional movement, undermining the effectiveness of the mean-reversion strategy.
References
www.uts.edu.au
onlinelibrary.wiley.com
www.cmegroup.com
Final Thoughts
The 40 Ticker Cross-Sectional Z-Scores strategy offers a data-driven approach to portfolio management, dynamically allocating capital based on the relative performance of assets. By using Z-scores and standard deviations, this strategy ensures that capital is directed to the strongest performers while avoiding weaker assets, ultimately improving the risk-adjusted returns of the portfolio. Whether you’re focused on trend-following or looking to explore mean-reversion strategies, this flexible system can be tailored to suit your investment goals.

Uptrick: Dynamic Z-Score DeviationOverview
Uptrick: Dynamic Z‑Score Deviation is a trading indicator built in Pine Script that combines statistical filters and adaptive smoothing to highlight potential reversal points in price action. It combines a hybrid moving average, dual Z‑Score analysis on both price and RSI, and visual enhancements like slope‑based coloring, ATR‑based shadow bands, and dynamically scaled reversal signals.
Introduction
Statistical indicators like Z‑Scores measure how far a value deviates from its average relative to the typical variation (standard deviation). Standard deviation quantifies how dispersed a set of values is around its mean. A Z‑Score of +2 indicates a value two standard deviations above the mean, while -2 is two below. Traders use Z‑Scores to spot unusually high or low readings that may signal overbought or oversold conditions.
Moving averages smooth out price data to reveal trends. The Arnaud Legoux Moving Average (ALMA) reduces lag and noise through weighted averaging. A Zero‑Lag EMA (approximated here using a time‑shifted EMA) seeks to further minimize delay in following price. The RSI (Relative Strength Index) is a momentum oscillator that measures recent gains against losses over a set period.
ATR (Average True Range) gauges market volatility by averaging the range between high and low over a lookback period. Shadow bands built using ATR give a visual mood of volatility around a central trend line. Together, these tools inform a dynamic but statistically grounded view of market extremes.
Purpose
The main goal of this indicator is to help traders spot short‑term reversal opportunities on lower timeframes. By requiring both price and momentum (RSI) to exhibit statistically significant deviations from their norms, it filters out weak setups and focuses on higher‑probability mean‑reversion zones. Reversal signals appear when price deviates far enough from its hybrid moving average and RSI deviates similarly in the same direction. This makes it suitable for discretionary traders seeking clean entry cues in volatile environments.
Originality and Uniqueness
Uptrick: Dynamic Z‑Score Deviation distinguishes itself from standard reversal or mean‑reversion tools by combining several elements into a single framework:
A composite moving average (ALMA + Zero‑Lag EMA) for a smooth yet responsive baseline
Dual Z‑Score filters on price and RSI rather than relying on a single measure
Adaptive visual elements, including slope‑aware coloring, multi‑layer ATR shadows, and signal sizing based on combined Z‑Score magnitude
Most indicators focus on one aspect—price envelopes or RSI thresholds—whereas Uptrick: Dynamic Z‑Score Deviation requires both layers to align before signaling. Its visual design aids quick interpretation without overwhelming the chart.
Why these indicators were merged
Every component in Uptrick: Dynamic Z‑Score Deviation has a purpose:
• ALMA: provides a smooth moving average with reduced lag and fewer false crossovers than a simple SMA or EMA.
• Zero‑Lag EMA (ZLMA approximation): further reduces the delay relative to price by applying a time shift to EMA inputs. This keeps the composite MA closer to current price action.
• RSI and its EMA filter: RSI measures momentum. Applying an EMA filter on RSI smooths out false spikes and confirms genuine overbought or oversold momentum.
• Dual Z‑Scores: computing Z‑Scores on both the distance between price and the composite MA, and on smoothed RSI, ensures that signals only fire when both price and momentum are unusually stretched.
• ATR bands: using ATR‑based shadow layers visualizes volatility around the MA, guiding traders on potential support and resistance zones.
At the end, these pieces merge into a single indicator that detects statistically significant mean reversions while staying adaptive to real‑time volatility and momentum.
Calculations
1. Compute ALMA over the chosen MA length, offset, and sigma.
2. Approximate ZLMA by applying EMA to twice the price minus the price shifted by the MA length.
3. Calculate the composite moving average as the average of ALMA and ZLMA.
4. Compute raw RSI and smooth it with ALMA. Apply an EMA filter to raw RSI to reduce noise.
5. For both price and smoothed RSI, calculate the mean and standard deviation over the Z‑Score lookback period.
6. Compute Z‑Scores:
• z_price = (current price − composite MA mean) / standard deviation of price deviations
• z_rsi = (smoothed RSI − mean RSI) / standard deviation of RSI
7. Determine reversal conditions: both Z‑Scores exceed their thresholds in the same direction, RSI EMA is in oversold/overbought zones (below 40 or above 60), and price movement confirms directionality.
8. Compute signal strength as the sum of the absolute Z‑Scores, then classify into weak, medium, or strong.
9. Calculate ATR over the chosen period and multiply by layer multipliers to form shadow widths.
10.Derive slope over the chosen slope length and color the MA line and bars based on direction, optionally smoothing color transitions via EMA on RGB channels.
How this indicator actually works
1. The script begins by smoothing price data with ALMA and approximating a zero‑lag EMA, then averaging them for the main MA.
2. RSI is calculated, then smoothed and filtered.
3. Using a rolling window, the script computes statistical measures for both price deviations and RSI.
4. Z‑Scores tell how far current values lie from their recent norms.
5. When both Z‑Scores cross configured thresholds and momentum conditions align, reversal signals are flagged.
6. Signals are drawn with size and color reflecting strength.
7. The MA is plotted with dynamic coloring; ATR shadows are layered beneath to show volatility envelopes.
8. Bars can be colored to match MA slope, reinforcing trend context.
9. Alert conditions allow automated notifications when signals occur.
Inputs
Main Length: Main MA Length. Sets the period for ALMA and ZLMA.
RSI Length: RSI Length. Determines the lookback for momentum calculations.
Z-Score Lookback: Z‑Score Lookback. Window for mean and standard deviation computations.
Price Z-Score Threshold: Price Z‑Score Threshold. Minimum deviation required for price.
RSI Z-Score threshold: RSI Z‑Score Threshold. Minimum deviation required for momentum.
RSI EMA Filter Length: RSI EMA Filter Length. Smooths raw RSI readings.
ALMA Offset: Controls ALMA’s focal point in the window.
ALMA Sigma: Adjusts ALMA’s smoothing strength.
Show Reversal Signals : Toggle to display reversal signal markers.
Slope Sensitivity: Length for slope calculation. Higher values smooth slope changes.
Use Bar Coloring: Enables coloring of price bars based on MA slope.
Show MA Shadow: Toggle for ATR‑based shadow bands.
Shadow Layer Count: Number of shadow layers (1–4).
Base Shadow ATR Multiplier: Multiplier for ATR when sizing the first band.
Smooth Color Transitions (boolean): Smooths RGB transitions for line and shadows, if enabled.
ATR Length for Shadow: ATR Period for computing volatility bands.
Use Dynamic Signal Size: Toggles dynamic scaling of reversal symbols.
Features
Moving average smoothing: a hybrid of ALMA and Zero‑Lag EMA that balances responsiveness and noise reduction.
Slope coloring: MA line and optionally price bars change color based on trend direction; color transitions can be smoothed for visual continuity.
ATR shadow layers: translucent bands around the MA show volatility envelopes; up to four concentric layers help gauge distance from normal price swings.
Dual Z‑Score filters: price and momentum must both deviate beyond thresholds to trigger signals, reducing false positives.
Dynamic signal sizing: reversal markers scale in size based on the combined Z‑Score magnitude, making stronger signals more prominent.
Adaptive visuals: optional smoothing of color channels creates gradient effects on lines and fills for a polished look.
Alert conditions: built‑in buy and sell alerts notify traders when reversal setups emerge.
Conclusion
Uptrick: Dynamic Z‑Score Deviation delivers a structured way to identify short‑term reversal opportunities by fusing statistical rigor with adaptive smoothing and clear visual cues. It guides traders through multiple confirmation layers—hybrid moving average, dual Z‑Score analysis, momentum filtering, and volatility envelopes—while keeping the chart clean and informative.
Disclaimer
This indicator is provided for informational and educational purposes only and does not constitute financial advice. Trading carries risk and may not be suitable for all participants. Past performance is not indicative of future results. Always do your own analysis and risk management before making trading decisions.
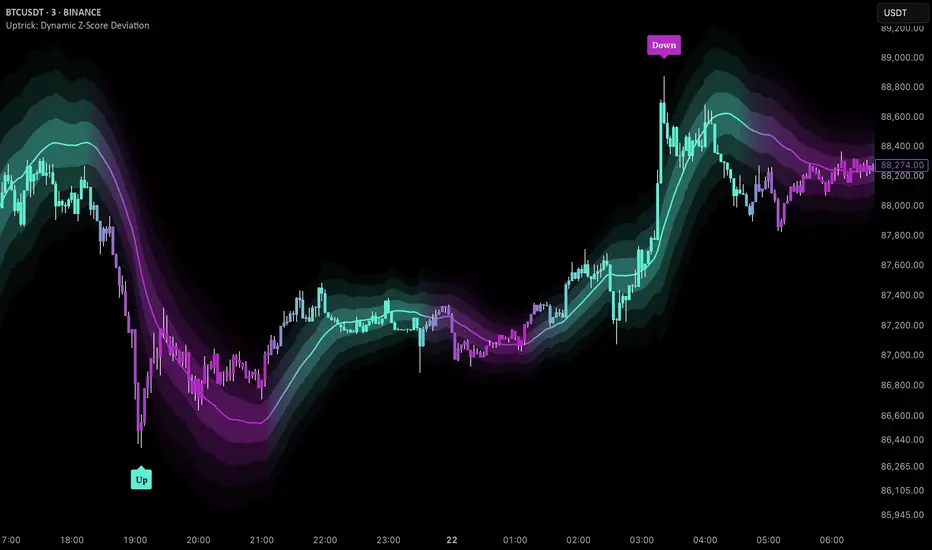
Institutional MACD (Z-Score Edition) [VolumeVigilante]📈 Institutional MACD (Z-Score Edition) — Professional-Grade Momentum Signal
This is not your average MACD .
The Institutional MACD (Z-Score Edition) is a statistically enhanced momentum tool, purpose-built for serious traders and breakout hunters . By applying Z-Score normalization to the classic MACD structure, this indicator uncovers statistically significant momentum shifts , enabling cleaner reads on price extremes, trend continuation, and potential reversals.
💡 Why It Matters
The classic MACD is powerful — but raw momentum values can be noisy and relative , especially on volatile assets like BTC/USD . By transforming the MACD line, signal line, and histogram into Z-scores , we anchor these signals in statistical context . This makes the Institutional MACD:
✔️ Timeframe-agnostic and asset-normalized
✔️ Ideal for spotting true breakouts , not false flags
✔️ A reliable tool for detecting momentum divergence and exhaustion
🧪 Key Features
✅ Full Z-Score normalization (MACD, Signal, Histogram)
✅ Highlighted ±Z threshold bands for overbought/oversold zones
✅ Customizable histogram coloring for visual momentum shifts
✅ Built-in alerts for zero-crosses and Z-threshold breaks
✅ Clean overlay with optional display toggles
🔁 Strategy Tip: Mean Reversion Signals with Statistical Confidence
This indicator isn't just for spotting breakouts — it also shines as a mean reversion tool , thanks to its Z-Score normalization .
When the Z-Score histogram crosses beyond ±2, it marks a statistically significant deviation from the mean — often signaling that momentum is overstretched and the asset may be due for a pullback or reversal .
📌 How to use it:
Z > +2 → Price action is in overbought territory. Watch for exhaustion or short setups.
Z < -2 → Momentum is deeply oversold. Look for reversal confirmation or long opportunities.
These zones often precede snap-back moves , especially in range-bound or corrective markets .
🎯 Combine Z-Score extremes with:
Candlestick confirmation
Support/resistance zones
Volume or price divergence
Other mean reversion tools (e.g., RSI, Bollinger Bands)
Unlike the raw MACD, this version delivers statistical thresholds , not guesswork — helping traders make decisions rooted in probability, not emotion.
📢 Trade Smart. Trade Vigilantly.
Published by VolumeVigilante

Institutional Quantum Momentum Impulse [BullByte]## Overview
The Institutional Quantum Momentum Impulse (IQMI) is a sophisticated momentum oscillator designed to detect institutional-level trend strength, volatility conditions, and market regime shifts. It combines multiple advanced technical concepts, including:
- Quantum Momentum Engine (Hilbert Transform + MACD Divergence + Stochastic Energy)
- Fractal Volatility Scoring (GARCH + Keltner-based volatility)
- Dynamic Adaptive Bands (Self-adjusting thresholds based on efficiency)
- Market Phase Detection (Volume + Momentum alignment)
- Liquidity & Cumulative Delta Analysis
The indicator provides a Z-score normalized momentum reading, making it ideal for mean-reversion and trend-following strategies.
---
## Key Features
### 1. Quantum Momentum Core
- Combines Hilbert Transform, MACD divergence, and Stochastic Energy into a single composite momentum score.
- Normalized using a Z-score for statistical significance.
- Smoothed with EMA/WMA/HMA for cleaner signals.
### 2. Dynamic Adaptive Bands
- Upper/Lower bands adjust based on volatility and efficiency ratio .
- Acts as overbought/oversold zones when momentum reaches extremes.
### 3. Market Phase Detection
- Identifies bullish , bearish , or neutral phases using:
- Volume-Weighted MA alignment
- Fractal momentum extremes
### 4. Volatility & Liquidity Filters
- Fractal Volatility Score (0-100 scale) shows market instability.
- Liquidity Check ensures trades are taken in favorable spread conditions.
### 5. Dashboard & Visuals
- Real-time dashboard with key metrics:
- Momentum strength, volatility, efficiency, cumulative delta, and market regime.
- Gradient coloring for intuitive momentum visualization .
---
## Best Trade Setups
### 1. Trend-Following Entries
- Signal :
- QM crosses above zero + Market Phase = Bullish + ADX > 25
- Cumulative Delta rising (buying pressure)
- Confirmation :
- Efficiency > 0.5 (strong momentum quality)
- Liquidity = High (tight spreads)
### 2. Mean-Reversion Entries
- Signal :
- QM touches upper band + Volatility expanding
- Market Regime = Ranging (ADX < 25)
- Confirmation :
- Efficiency < 0.3 (weak momentum follow-through)
- Cumulative Delta divergence (price high but delta declining)
### 3. Breakout Confirmation
- Signal :
- QM holds above zero after a pullback
- Market Phase shifts to Bullish/Bearish
- Confirmation :
- Volatility rising (expansion phase)
- Liquidity remains high
---
## Recommended Timeframes
- Intraday (5M - 1H): Works well for scalping & swing trades.
- Swing Trading (4H - Daily): Best for trend-following setups.
- Position Trading (Weekly+): Useful for macro trend confirmation.
---
## Input Customization
- Resonance Factor (1.0 - 3.618 ): Adjusts MACD divergence sensitivity.
- Entropy Filter (0.382/0.50/0.618) : Controls stochastic damping.
- Smoothing Type (EMA/WMA/HMA) : Changes momentum responsiveness.
- Normalization Period : Adjusts Z-score lookback.
---
The IQMI is a professional-grade momentum indicator that combines institutional-level concepts into a single, easy-to-read oscillator. It works across all markets (stocks, forex, crypto) and is ideal for traders who want:
✅ Early trend detection
✅ Volatility-adjusted signals
✅ Institutional liquidity insights
✅ Clear dashboard for quick analysis
Try it on TradingView and enhance your trading edge! 🚀
Happy Trading!
- BullByte

Uptrick: Z-Score FlowOverview
Uptrick: Z-Score Flow is a technical indicator that integrates trend-sensitive momentum analysi s with mean-reversion logic derived from Z-Score calculations. Its primary objective is to identify market conditions where price has either stretched too far from its mean (overbought or oversold) or sits at a statistically “normal” range, and then cross-reference this observation with trend direction and RSI-based momentum signals. The result is a more contextual approach to trade entry and exit, emphasizing precision, clarity, and adaptability across varying market regimes.
Introduction
Financial instruments frequently transition between trending modes, where price extends strongly in one direction, and ranging modes, where price oscillates around a central value. A simple statistical measure like Z-Score can highlight price extremes by comparing the current price against its historical mean and standard deviation. However, such extremes alone can be misleading if the broader market structure is trending forcefully. Uptrick: Z-Score Flow aims to solve this gap by combining Z-Score with an exponential moving average (EMA) trend filter and a smoothed RSI momentum check, thus filtering out signals that contradict the prevailing market environment.
Purpose
The purpose of this script is to help traders pinpoint both mean-reversion opportunities and trend-based pullbacks in a way that is statistically grounded yet still mindful of overarching price action. By pairing Z-Score thresholds with supportive conditions, the script reduces the likelihood of acting on random price spikes or dips and instead focuses on movements that are significant within both historical and current contextual frameworks.
Originality and Uniquness
Layered Signal Verification: Signals require the fulfillment of multiple layers (Z-Score extreme, EMA trend bias, and RSI momentum posture) rather than merely breaching a statistical threshold.
RSI Zone Lockout: Once RSI enters an overbought/oversold zone and triggers a signal, the script locks out subsequent signals until RSI recovers above or below those zones, limiting back-to-back triggers.
Controlled Cooldown: A dedicated cooldown mechanic ensures that the script waits a specified number of bars before issuing a new signal in the opposite direction.
Gradient-Based Visualization: Distinct gradient fills between price and the Z-Mean line enhance readability, showing at a glance whether price is trading above or below its statistical average.
Comprehensive Metrics Panel: An optional on-chart table summarizes the Z-Score’s key metrics, streamlining the process of verifying current statistical extremes, mean levels, and momentum directions.
Why these indicators were merged
Z-Score measurements excel at identifying when price deviates from its mean, but they do not intrinsically reveal whether the market’s trajectory supports a reversion or if price might continue along its trend. The EMA, commonly used for spotting trend directions, offers valuable insight into whether price is predominantly ascending or descending. However, relying solely on a trend filter overlooks the intensity of price moves. RSI then adds a dedicated measure of momentum, helping confirm if the market’s energy aligns with a potential reversal (for example, price is statistically low but RSI suggests looming upward momentum). By uniting these three lenses—Z-Score for statistical context, EMA for trend direction, and RSI for momentum force—the script offers a more comprehensive and adaptable system, aiming to avoid false positives caused by focusing on just one aspect of price behavior.
Calculations
The core calculation begins with a simple moving average (SMA) of price over zLen bars, referred to as the basis. Next, the script computes the standard deviation of price over the same window. Dividing the difference between the current price and the basis by this standard deviation produces the Z-Score, indicating how many standard deviations the price is from its mean. A positive Z-Score reveals price is above its average; a negative reading indicates the opposite.
To detect overall market direction, the script calculates an exponential moving average (emaTrend) over emaTrendLen bars. If price is above this EMA, the script deems the market bullish; if below, it’s considered bearish. For momentum confirmation, the script computes a standard RSI over rsiLen bars, then applies a smoothing EMA over rsiEmaLen bars. This smoothed RSI (rsiEma) is monitored for both its absolute level (oversold or overbought) and its slope (the difference between the current and previous value). Finally, slopeIndex determines how many bars back the script compares the basis to check whether the Z-Mean line is generally rising, falling, or flat, which then informs the coloring scheme on the chart.
Calculations and Rational
Simple Moving Average for Baseline: An SMA is used for the core mean because it places equal weight on each bar in the lookback period. This helps maintain a straightforward interpretation of overbought or oversold conditions in the context of a uniform historical average.
Standard Deviation for Volatility: Standard deviation measures the variability of the data around the mean. By dividing price’s difference from the mean by this value, the Z-Score can highlight whether price is unusually stretched given typical volatility.
Exponential Moving Average for Trend: Unlike an SMA, an EMA places more emphasis on recent data, reacting quicker to new price developments. This quicker response helps the script promptly identify trend shifts, which can be crucial for filtering out signals that go against a strong directional move.
RSI for Momentum Confirmation: RSI is an oscillator that gauges price movement strength by comparing average gains to average losses over a set period. By further smoothing this RSI with another EMA, short-lived oscillations become less influential, making signals more robust.
SlopeIndex for Slope-Based Coloring: To clarify whether the market’s central tendency is rising or falling, the script compares the basis now to its level slopeIndex bars ago. A higher current reading indicates an upward slope; a lower reading, a downward slope; and similar readings, a flat slope. This is visually represented on the chart, providing an immediate sense of the directionality.
Inputs
zLen (Z-Score Period)
Specifies how many bars to include for computing the SMA and standard deviation that form the basis of the Z-Score calculation. Larger values produce smoother but slower signals; smaller values catch quick changes but may generate noise.
emaTrendLen (EMA Trend Filter)
Sets the length of the EMA used to detect the market’s primary direction. This is pivotal for distinguishing whether signals should be considered (price aligning with an uptrend or downtrend) or filtered out.
rsiLen (RSI Length)
Defines the window for the initial RSI calculation. This RSI, when combined with the subsequent smoothing EMA, forms the foundation for momentum-based signal confirmations.
rsiEmaLen (EMA of RSI Period)
Applies an exponential moving average over the RSI readings for additional smoothing. This step helps mitigate rapid RSI fluctuations that might otherwise produce whipsaw signals.
zBuyLevel (Z-Score Buy Threshold)
Determines how negative the Z-Score must be for the script to consider a potential oversold signal. If the Z-Score dives below this threshold (and other criteria are met), a buy signal is generated.
zSellLevel (Z-Score Sell Threshold)
Determines how positive the Z-Score must be for a potential overbought signal. If the Z-Score surpasses this threshold (and other checks are satisfied), a sell signal is generated.
cooldownBars (Cooldown (Bars))
Enforces a bar-based delay between opposite signals. Once a buy signal has fired, the script must wait the specified number of bars before registering a new sell signal, and vice versa.
slopeIndex (Slope Sensitivity (Bars))
Specifies how many bars back the script compares the current basis for slope coloration. A bigger slopeIndex highlights larger directional trends, while a smaller number emphasizes shorter-term shifts.
showMeanLine (Show Z-Score Mean Line)
Enables or disables the plotting of the Z-Mean and its slope-based coloring. Traders who prefer minimal chart clutter may turn this off while still retaining signals.
Features
Statistical Core (Z-Score Detection):
This feature computes the Z-Score by taking the difference between the current price and the basis (SMA) and dividing by the standard deviation. In effect, it translates price fluctuations into a standardized measure that reveals how significant a move is relative to the typical variation seen over the lookback. When the Z-Score crosses predefined thresholds (zBuyLevel for oversold and zSellLevel for overbought), it signals that price could be at an extreme.
How It Works: On each bar, the script updates the SMA and standard deviation. The Z-Score is then refreshed accordingly. Traders can interpret particularly large negative or positive Z-Score values as scenarios where price is abnormally low or high.
EMA Trend Filter:
An EMA over emaTrendLen bars is used to classify the market as bullish if the price is above it and bearish if the price is below it. This classification is applied to the Z-Score signals, accepting them only when they align with the broader price direction.
How It Works: If the script detects a Z-Score below zBuyLevel, it further checks if price is actually in a downtrend (below EMA) before issuing a buy signal. This might seem counterintuitive, but a “downtrend” environment plus an oversold reading often signals a potential bounce or a mean-reversion play. Conversely, for sell signals, the script checks if the market is in an uptrend first. If it is, an overbought reading aligns with potential profit-taking.
RSI Momentum Confirmation with Oversold/Overbought Lockout:
RSI is calculated over rsiLen, then smoothed by an EMA over rsiEmaLen. If this smoothed RSI dips below a certain threshold (for example, 30) and then begins to slope upward, the indicator treats it as a potential sign of recovering momentum. Similarly, if RSI climbs above a certain threshold (for instance, 70) and starts to slope downward, that suggests dwindling momentum. Additionally, once RSI is in these zones, the indicator locks out repetitive signals until RSI fully exits and re-enters those extreme territories.
How It Works: Each bar, the script measures whether RSI has dropped below the oversold threshold (like 30) and has a positive slope. If it does, the buy side is considered “unlocked.” For sell signals, RSI must exceed an overbought threshold (70) and slope downward. The combination of threshold and slope helps confirm that a reversal is genuinely in progress instead of issuing signals while momentum remains weak or stuck in extremes.
Cooldown Mechanism:
The script features a custom bar-based cooldown that prevents issuing new signals in the opposite direction immediately after one is triggered. This helps avoid whipsaw situations where the market quickly flips from oversold to overbought or vice versa.
How It Works: When a buy signal fires, the indicator notes the bar index. If the Z-Score and RSI conditions later suggest a sell, the script compares the current bar index to the last buy signal’s bar index. If the difference is within cooldownBars, the signal is disallowed. This ensures a predefined “quiet period” before switching signals.
Slope-Based Coloring (Z-Mean Line and Shadow):
The script compares the current basis value to its value slopeIndex bars ago. A higher reading now indicates a generally upward slope, while a lower reading indicates a downward slope. The script then shades the Z-Mean line in a corresponding bullish or bearish color, or remains neutral if little change is detected.
How It Works: This slope calculation is refreshingly straightforward: basis – basis . If the result is positive, the line is colored bullish; if negative, it is colored bearish; if approximately zero, it remains neutral. This provides a quick visual cue of the medium-term directional bias.
Gradient Overlays:
With gradient fills, the script highlights where price stands in relation to the Z-Mean. When price is above the basis, a purple-shaded region is painted, visually indicating a “bearish zone” for potential overbought conditions. When price is below, a teal-like overlay is used, suggesting a “bullish zone” for potential oversold conditions.
How It Works: Each bar, the script checks if price is above or below the basis. It then applies a fill between close and basis, using distinct colors to show whether the market is trading above or below its mean. This creates an immediate sense of how extended the market might be.
Buy and Sell Labels (with Alerts):
When a legitimate buy or sell condition passes every check (Z-Score threshold, EMA trend alignment, RSI gating, and cooldown clearance), the script plots a corresponding label directly on the chart. It also fires an alert (if alerts are set up), making it convenient for traders who want timely notifications.
How It Works: If rawBuy or rawSell conditions are met (refined by RSI, EMA trend, and cooldown constraints), the script calls the respective plot function to paint an arrow label on the chart. Alerts are triggered simultaneously, carrying easily recognizable messages.
Metrics Table:
The optional on-chart table (activated by showMetrics) presents real-time Z-Score data, including the current Z-Score, its rolling mean, the maximum and minimum Z-Score values observed over the last zLen bars, a percentile position, and a short-term directional note (rising, falling, or flat).
Current – The present Z-Score reading
Mean – Average Z-Score over the zLen period
Min/Max – Lowest and highest Z-Score values within zLen
Position – Where the current Z-Score sits between the min and max (as a percentile)
Trend – Whether the Z-Score is increasing, decreasing, or flat
Conclusion
Uptrick: Z-Score Flow offers a versatile solution for traders who need a statistically informed perspective on price extremes combined with practical checks for overall trend and momentum. By leveraging a well-defined combination of Z-Score, EMA trend classification, RSI-based momentum gating, slope-based visualization, and a cooldown mechanic, the script reduces the occurrence of false or premature signals. Its gradient fills and optional metrics table contribute further clarity, ensuring that users can quickly assess market posture and make more confident trading decisions in real time.
Disclaimer
This script is intended solely for informational and educational purposes. Trading in any financial market comes with substantial risk, and there is no guarantee of success or the avoidance of loss. Historical performance does not ensure future results. Always conduct thorough research and consider professional guidance prior to making any investment or trading decisions.
