震荡后上涨?日线级别的IP走势行为分析【理论基础】
所有的价格行为无法就2种情况,要么是震荡行情,要么是趋势行情(上升趋势,下降趋势);
上升趋势特点:低点不断抬高,高点不断抬高
下降趋势特点:低点不断降低,高点不断降低
震荡特点:无明显方向
有效趋势线定义:价格至少 3 次及 3 次以上触碰此线,且趋势线触碰的次数越多,有效性越强
关键支撑/阻力线:价格多次触碰此线,且成交量越大越有效
震荡常见形态:
三角形
矩形
旗形(通道)
【行为分析】
明确上述定义后,就可以描述IP的价格走势行为;
第一段上涨趋势,接着是一段大三角震荡,根据价格行为规律:(上涨/下降)趋势->震荡(可能为反转)->(上涨/下降)趋势,可以推出接下来为趋势,这里跌破大三角形成下降趋势;
由于震荡行为多变,这里又切换成通道内震荡,跌破通道下轨后再次形成下降趋势;
小段下跌后,再一次形成三角震荡,不出意外的话,要么继续下跌,要么形成反转形成上涨;随后的行情如图,是反转上涨->震荡->上涨->???;
之前行情分析完后,可以通过连线获取到一条上升趋势线,但是这里仅有2个触碰点,暂时还不能验证其有效性;这里先假定此线有效,很明显,这里仍处于上涨趋势中;
那么目前行情处于什么阶段呢?
上涨:延续之前的走势,突破前高
震荡:橘红色矩形内震荡,上下波动,或者走出其他震荡形态
根据前面一段115%的上涨趋势,此轮上涨约98%,它们隶属于同级别,同级别上涨对应同级别震荡,同样可以轻松推断出,前面的前高就是此次上涨趋势的终点,现在应该是在走与上个三角震荡同级别的震荡。
更进一步,时间也为同级别的22天,那么在10月份左右会形成下一段趋势行情,暂定剧本为触及上升趋势线后继续上涨。
IPUSDT.3S交易观点

Bitcoin setting new highs, beware of callback risksHello guys, welcome to my channel. I am a new blogger Crypto Hand. I use the shortest time every day to bring you the most practical information about the coin circle, stocks, and futures circle. However, I have to say that the following content is only for news, not for investment advice.
First of all, Let’s review Bitcoin’s price performance over the past 24 hours and analyze key technical indicators and market trends. If you like this kind of content, please like and subscribe, and let’s get started.
Data overview
Let's take a look at the data first. In the past two weeks, the price of Bitcoin has risen sharply, breaking through the historical high and reaching $111,980. The overall trend is very strong, and media organizations have also boasted about it. The most common statement is that it will reach $200,000 by the end of the year. The price of gold is also consolidating at a high level, and $3,200 per ounce is still a key support level. Now both gold and Bitcoin have an obvious feature, the average daily trading volume is not very large, there are not many enthusiastic traders entering the market,but rather a few large institutions secretly hoarding goods.
In terms of trading volume, a total of 15,620 bitcoins were traded in the past 24 hours, with a turnover of $98.984 billion. Bitcoin hit its highest point in history last Thursday, when the Dubai Crypto Expo was held, but in the following days, Bitcoin showed an overall correction trend, and the market volume was not obvious. However, by participating in the Crypto Expo, we can find that the current market attracts more funds from third world countries. The majority of visitors to this Expo are South Asians, mainly concentrated in India, Pakistan and Sri Lanka, which can reflect that more funds from relatively underdeveloped countries are pouring into the crypto industry.
Data Analysis
Next, we move on to the technical analysis. From the 4-hour chart, after a few days of narrow fluctuations, the price of Bitcoin has always fluctuated between $110,000 and $105,000. And this situation has been formed since the lowest price of $77,000. Whenever the price reaches a certain level, it will oscillate at that level to form a support belt, which is more in line with the classic "five-wave theory". The current position has reached the fifth wave. If a negative line follows, it will be a relatively healthy adjustment. If it continues to rise, it means that the market is relatively fanatical and may have entered a new overbought stage.
The current value of the market's panic and greed index is 65, which is in the greed position, indicating that the market sentiment is still relatively healthy. Since Bitcoin has occupied $100,000, it has been in the greed position. The market has a psychological expectation of a drop in Bitcoin prices. At the same time, since there is no more hot money entering the market, more retail investors will sell every time the price rises, which will stabilize the price at a more rational position.
Summary and predictions
In summary, Bitcoin has hit new highs recently, but there is not much hot money in the market. The price has risen due to the game between institutions and big whales, which is a relatively healthy rise. From the data graph, the daily line and the 4-hour trading chart have shown a price of "five-wave rise" curve, so there is a high probability of a callback in the subsequent transactions. The first support position of the callback is the current position of $105,000 . If it falls below, the next position is the "fourth wave" support band of $101,000, and so on. Friends who want to enter the market at this position can buy DCA at the support band of each wave. For friends who do contracts, this range is a favorable position for shorting.
The Biyapay platform will provide you with better and more convenient services in the crypto market. BiyaPay is a world-leading multi-asset trading center headquartered in Singapore. It has successively established subsidiaries and expanded its business in the United States, Hong Kong and other places. At present, the number of registered users has reached five hundred and nine thousand, covering various countries and regions around the world. Its business includes global payments and international remittances, as well as major investment services such as US stocks / Hong Kong stocks and digital currencies. BiyaPay currently supports online real-time exchange of more than 30 mainstream legal currencies and more than 200 mainstream digital currencies. You can check the exchange rate and convert it on the BiyaPay website. It provides a mid-rate with zero hidden price difference and has only very small handling fee, which is simpler, more transparent and cheaper. It also adopts the local transfer method in most countries or regions in the world, with no limit on the amount, and truly achieves same-day remittance and same-day arrival, making global remittance faster, more convenient and safer.
So much for so today’s sharing. See you tomorrow!

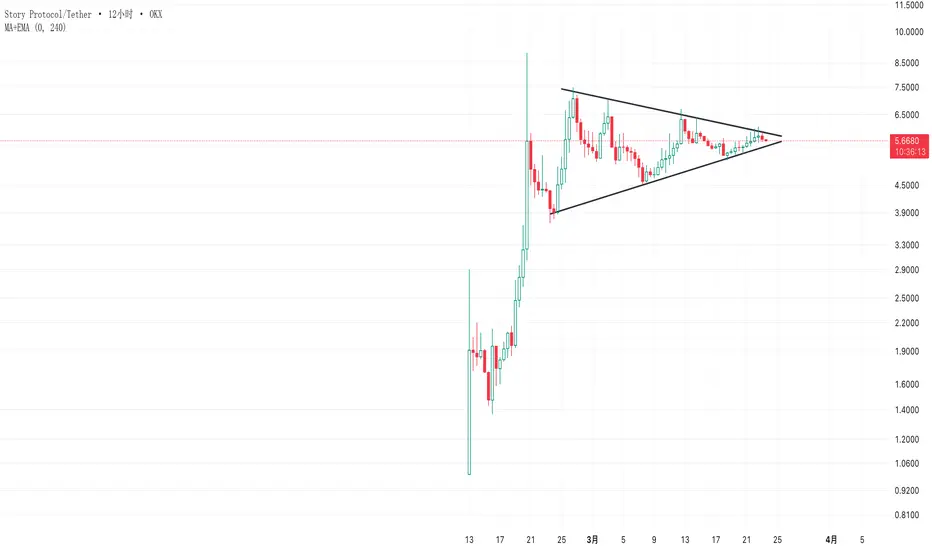
story ip 强烈看涨目前盘面结构是一个6小时结构的大三角形结构,走到末端,币价即将赢来大的波动,力道很足。如果向上突破,则看创新高。如果向下变盘,跌破4.6是一个关键信号,所以做多止损4.6,破位空头做实。
OKX:IPUSDT
以上仅作为自己的交易笔记,2个月后回来看;