Here’s a simple and comprehensive analysis of CAC 40 Index (FRA40) daily chart 👇
---
🧭 General Market Structure
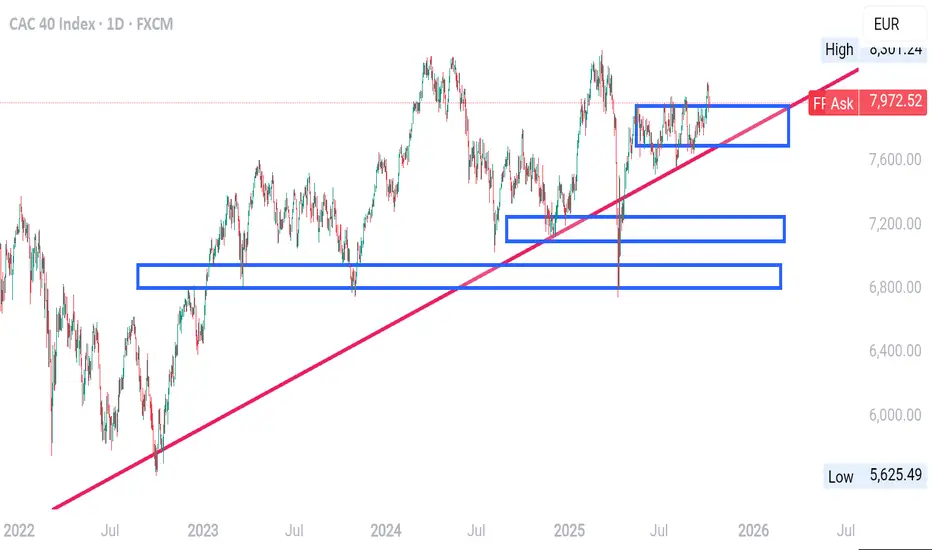
The chart shows a clear long-term uptrend since mid-2022, marked by the ascending red trendline.
This means buyers (institutions) have generally been in control, creating higher lows and higher highs.
---
🔵 Key Institutional Zones
You’ve marked several blue rectangular zones — these are institutional demand zones (buy zones). Let’s break them down:
1. Upper Blue Zone (around 7,800–7,950)
This is the most recent consolidation zone where price has been ranging sideways.
It shows that institutions are accumulating — meaning big players are building positions before deciding the next move.
If price breaks above this zone strongly, it could trigger a bullish continuation toward new highs.
If price falls below the zone, it could signal distribution (a sell-off phase).
2. Middle Blue Zone (around 7,150–7,250)
This was a previous demand area where strong buying pressure entered before.
If the market corrects downward, this zone is the first strong institutional buy zone where buyers may re-enter.
3. Lower Blue Zone (around 6,750–6,900)
This is a major long-term institutional accumulation zone.
It represents deep value — if price ever returns here, it could offer a high-probability long-term buy opportunity.
---
🔺 Trendline Dynamics
The red ascending trendline has been acting as a dynamic support, confirming the bullish structure.
Price is currently sitting right above this trendline, showing that buyers are still defending it.
A break and close below this trendline would be an early warning that momentum is weakening.
---
⚖️ Current Outlook (as of ~7,975 EUR)
The market is at a key resistance near all-time highs.
Two possible outcomes:
1. Bullish scenario — price breaks above 8,000 and sustains: continuation toward new highs.
2. Bearish scenario — price rejects this level, breaks below the red trendline and upper blue zone: correction down to 7,200 or even 6,900 zones.
---
🧠 Simple Summary
Aspect Meaning
Trend Uptrend (bullish bias)
Structure Higher highs/lows intact
Current phase Consolidation near resistance
Key supports 7,200 and 6,800 zones
Key resistance 8,000–8,050 area
Decision point Break above 8,000 → bullish continuation<br>Break below trendline → correction likely
---
🧭 General Market Structure
The chart shows a clear long-term uptrend since mid-2022, marked by the ascending red trendline.
This means buyers (institutions) have generally been in control, creating higher lows and higher highs.
---
🔵 Key Institutional Zones
You’ve marked several blue rectangular zones — these are institutional demand zones (buy zones). Let’s break them down:
1. Upper Blue Zone (around 7,800–7,950)
This is the most recent consolidation zone where price has been ranging sideways.
It shows that institutions are accumulating — meaning big players are building positions before deciding the next move.
If price breaks above this zone strongly, it could trigger a bullish continuation toward new highs.
If price falls below the zone, it could signal distribution (a sell-off phase).
2. Middle Blue Zone (around 7,150–7,250)
This was a previous demand area where strong buying pressure entered before.
If the market corrects downward, this zone is the first strong institutional buy zone where buyers may re-enter.
3. Lower Blue Zone (around 6,750–6,900)
This is a major long-term institutional accumulation zone.
It represents deep value — if price ever returns here, it could offer a high-probability long-term buy opportunity.
---
🔺 Trendline Dynamics
The red ascending trendline has been acting as a dynamic support, confirming the bullish structure.
Price is currently sitting right above this trendline, showing that buyers are still defending it.
A break and close below this trendline would be an early warning that momentum is weakening.
---
⚖️ Current Outlook (as of ~7,975 EUR)
The market is at a key resistance near all-time highs.
Two possible outcomes:
1. Bullish scenario — price breaks above 8,000 and sustains: continuation toward new highs.
2. Bearish scenario — price rejects this level, breaks below the red trendline and upper blue zone: correction down to 7,200 or even 6,900 zones.
---
🧠 Simple Summary
Aspect Meaning
Trend Uptrend (bullish bias)
Structure Higher highs/lows intact
Current phase Consolidation near resistance
Key supports 7,200 and 6,800 zones
Key resistance 8,000–8,050 area
Decision point Break above 8,000 → bullish continuation<br>Break below trendline → correction likely
免责声明
这些信息和出版物并不意味着也不构成TradingView提供或认可的金融、投资、交易或其它类型的建议或背书。请在使用条款阅读更多信息。
免责声明
这些信息和出版物并不意味着也不构成TradingView提供或认可的金融、投资、交易或其它类型的建议或背书。请在使用条款阅读更多信息。