Hello guys!
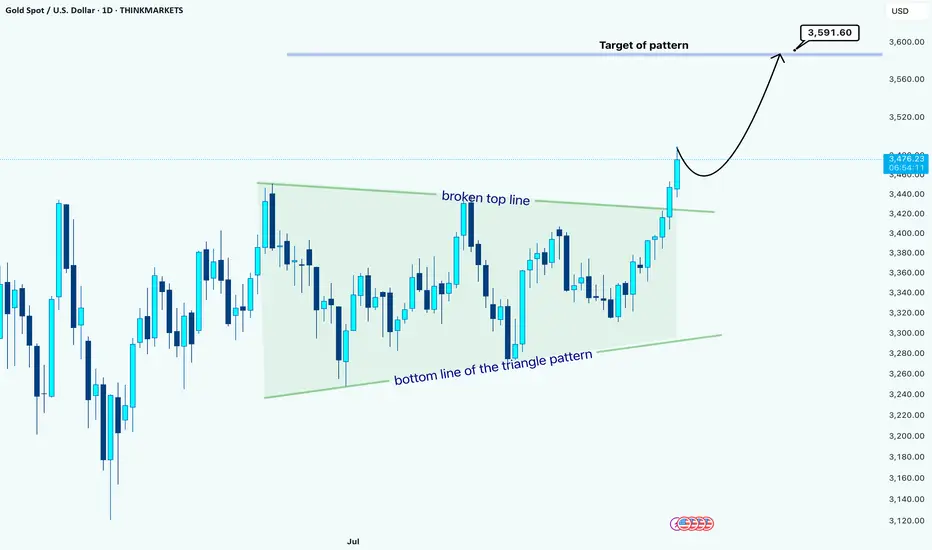
Gold has finally broken out of a large triangle consolidation pattern that has been building for weeks. The price action respected both the top resistance line and the bottom support line multiple times, showing clear compression before the breakout.
🚀 Recently, the price broke above the top line of the triangle, confirming a bullish breakout. This kind of move usually signals the start of a continuation phase with momentum in the direction of the breakout.
Based on the measured move from the triangle formation, the projected target sits around 3,591.60 USD. Price is currently trading near 3,476 USD, which still leaves room for further upside.
💡 Typically, after such a breakout, the market may retest the broken resistance line (now turned support) before resuming its move higher. (but the pullback is not certain now)
Summary:
As long as Gold holds above the broken triangle resistance, the bias remains bullish toward the projected target.
Disclaimer: As part of ThinkMarkets’ Influencer Program, I am sponsored to share and publish their charts in my analysis.
Gold has finally broken out of a large triangle consolidation pattern that has been building for weeks. The price action respected both the top resistance line and the bottom support line multiple times, showing clear compression before the breakout.
🚀 Recently, the price broke above the top line of the triangle, confirming a bullish breakout. This kind of move usually signals the start of a continuation phase with momentum in the direction of the breakout.
Based on the measured move from the triangle formation, the projected target sits around 3,591.60 USD. Price is currently trading near 3,476 USD, which still leaves room for further upside.
💡 Typically, after such a breakout, the market may retest the broken resistance line (now turned support) before resuming its move higher. (but the pullback is not certain now)
Summary:
- Pattern: Symmetrical Triangle
- Breakout Direction: Bullish
- Current Price: 3,476 USD
- Target: 3,591.60 USD
As long as Gold holds above the broken triangle resistance, the bias remains bullish toward the projected target.
Disclaimer: As part of ThinkMarkets’ Influencer Program, I am sponsored to share and publish their charts in my analysis.
交易开始
it is runing!
Proud ThinkMarkets Ambassador -> Discover & Grow: bit.ly/Think-Markets
------
My recommended Exchange -> YEX: bit.ly/YEX-M
------
Telegram channel: t.me/melikatrader94
Forex channel: t.me/melikatrader94GoldForex
------
My recommended Exchange -> YEX: bit.ly/YEX-M
------
Telegram channel: t.me/melikatrader94
Forex channel: t.me/melikatrader94GoldForex
相关出版物
免责声明
这些信息和出版物并不意味着也不构成TradingView提供或认可的金融、投资、交易或其它类型的建议或背书。请在使用条款阅读更多信息。