Historically, when U.S. interest rates
The difference today is the sovereign bid. Since 2022, central banks have been buying over 1,000 tonnes annually, creating a structural floor that didn’t exist in past cycles. Any weakness is likely to be bought aggressively, producing a V‑shaped recovery rather than a drawn‑out bear market.
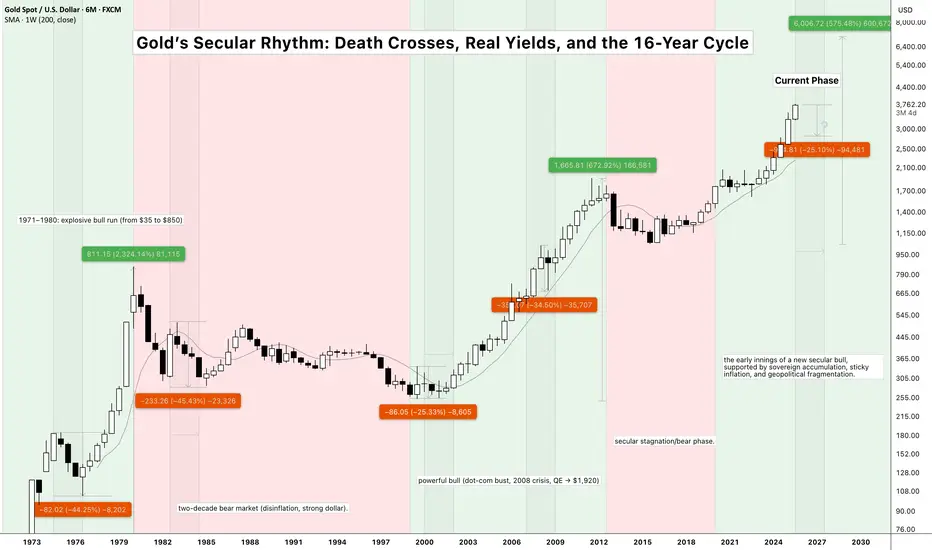
Meanwhile, the 10‑Year Real Interest Rate is hovering around 1.5–1.7%, still artificially high. History shows that when real yields inevitably turn negative (likely by 2026), gold tends to explode higher regardless of crisis timing.
Layer this onto the 16‑year secular cycle thesis and the central bank accumulation story, and the setup is compelling: gold may still face sharp but temporary corrections, yet the long‑term trajectory remains firmly higher. The key question is whether sovereign demand can fully absorb potential Western ETF liquidation during the next bout of financial stress.
Disclaimer: This analysis is for educational purposes only and should not be considered financial advice. Past performance does not guarantee future results. Always conduct your own research and consult with financial professionals before making investment decisions.
The NFX Team
相关出版物
免责声明
这些信息和出版物并非旨在提供,也不构成TradingView提供或认可的任何形式的财务、投资、交易或其他类型的建议或推荐。请阅读使用条款了解更多信息。