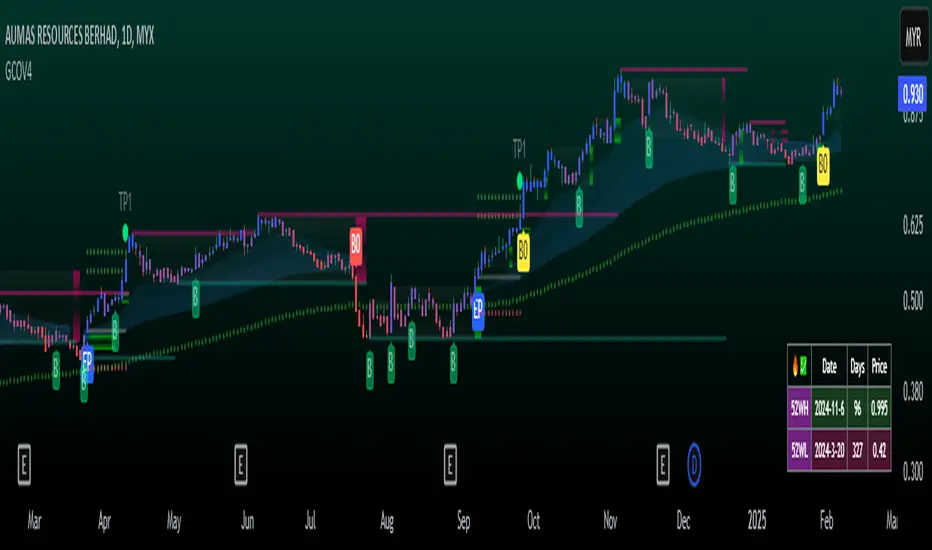
GCOV4 PROTECH

This indicator is built specifically for SWING, PULLBACK and BREAKOUT strategy trading in the stocks/equity market. It uses an indicator instrument consisting of ATR TRAILING STOP (ATR), EXPONENTIAL MOVING AVERAGE(EMA), PIVOT POINT and VOLUME ANALYSIS.
The parameters that have been upgraded are to meet the needs of trading strategies whether short or long term trading. In addition, it is built to reduce the risk of trading activities and help traders to adhere to the best trading plan.
This transformation involves 3 trading strategy modes namely SWING PRO, PULL & BOUND and BREAKOUT STRATEGY.
Rebuild of Instrument & Parameter
This indicator is also an upgraded instrument that is sourced from the previous indicator, the GOLDENCO AIE2 INDICATOR.
This R&D of course to make trading activities more effective, dynamic and to increase the confidence of traders in current trading activities. The indicator has been upgraded in terms of parameters as well as additional instruments. Among them are;
1. ATR Trailing Stop
2. Exponential Moving Average – fastMA/slowMA Length
3. LabelEntry Price/Stoploss/Takeprofit line;
>The take profit and stop loss rates are based on percentages. However
traders can change the percentage rate according to their respective
trading plans.
>existing percentage rates have been set(build-in) for standard rate.
So you have to reset based on the type of stock/market cap either penny
stock or blue chip stock.
>The candle/bars have been colored to make it easier for traders to see price
trends whether in bullish or bearish conditions.
Hopefully with the upgrading of these indicators will make traders more successful in trading activities, especially in the equity markets.
DISCLAIMER;
ALL NOTES AND INDICATING TOOLS ARE FOR EDUCATIONAL ONLY AND AS A FACILITATOR AND PREPARATION IN TRADING ACTIVITIES. ADMIN IS NOT RESPONSIBLE FOR ANY RISKS IN YOUR TRADING ACTIVITIES. TAKE AT YOUR OWN RISK.
FunTrader/Aieyee @2022
1. fix some bugs on signal, remove unneeded
2. use RSI variables into bars/candles
3. Add delta volume channel (DVC)
> DVC to shows net volume either bull or bear,
> and detect base/sideways/accumulation by cumulative vol,
Prepared for boom up/spike to the moon
4. generate new tools for visual neatness
5. switch to version 5 script
Delta Volume Channel( DVC)
How does DVC work
2 types of bull/bear
note;
the strategy of using the existing signal remains, as usual, no change.
In case the DVC display bothers you, you can hide it in the input settings.
2. fix some error> redisplay previously invisible plots (ema5, ema200)
now you can see them again
1) Input setting change;
So, you can reset the color of the EMAs plot and the low high in the indicator setting, the
instrument group has also been rearranged
2) Added the 52 week high & low display table as well as the line plot.
How to get updates;
click the indicator name again, done
see the changes that occur as shown in the chart below
2. minimize volume channel, plot and filling transparency,
3. remove the bugs
仅限邀请脚本
Only users approved by the author can access this script. You'll need to request and get permission to use it. This is typically granted after payment. For more details, follow the author's instructions below or contact TraderAsist directly.
TradingView does NOT recommend paying for or using a script unless you fully trust its author and understand how it works. You may also find free, open-source alternatives in our community scripts.
作者的说明
免责声明
仅限邀请脚本
Only users approved by the author can access this script. You'll need to request and get permission to use it. This is typically granted after payment. For more details, follow the author's instructions below or contact TraderAsist directly.
TradingView does NOT recommend paying for or using a script unless you fully trust its author and understand how it works. You may also find free, open-source alternatives in our community scripts.