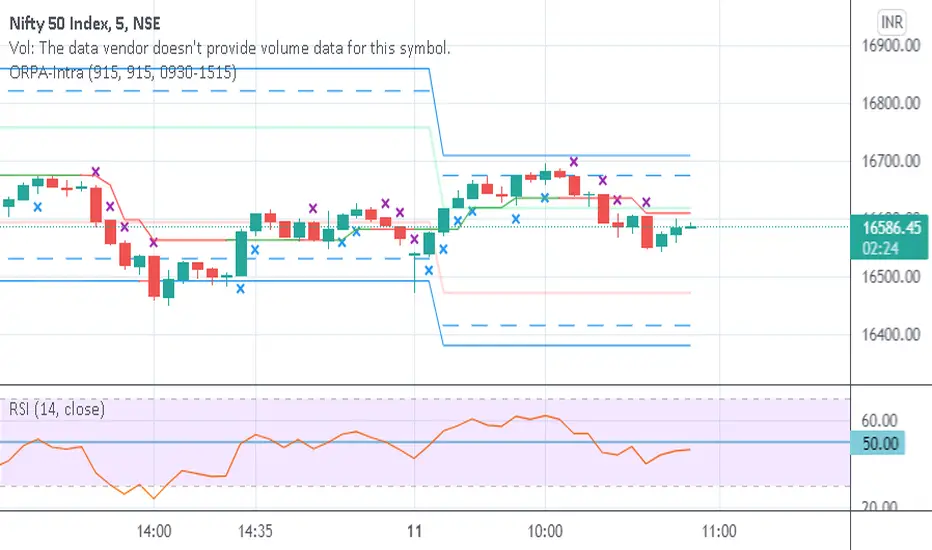
Opening Range-Price Action IntradayThis combines Opening Range of 15 min and Price Action in one script. Crosses are marked on candles for upside and downside. Break of High/Low of cross marked candles gives direction of market.
Action
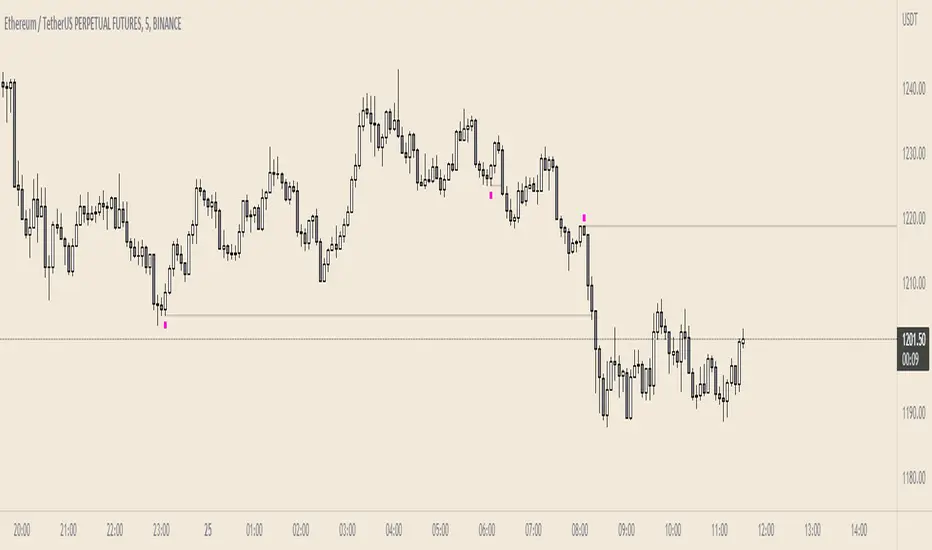
Failed AuctionAs we know, buyers and sellers take part in the market auction.
A failed auction is where price could not tick above or below a specific price. This means that there were no buyers willing to buy or sellers willing to sell beyond that price. Price then moves away in the other direction.
The failed auction acts as a magnet and becomes a target to revisit sooner or later. The failed auction is a successful/finished auction once it has been satisfied.
On the indicator, two adjacent candles with the exact same high or low are marked. The icon will appear on the high or low of the 2nd candle. This notifies us that there was a failed auction.
If you are in a trade, you can use the failed auction to hold onto the trade longer. If you are not in a trade, you should be cautious if a failed auction rests above or below you limit order.
Icons and colours are customisable. An option to have plotted lines for the failed auction is included.
Works on all timeframes.
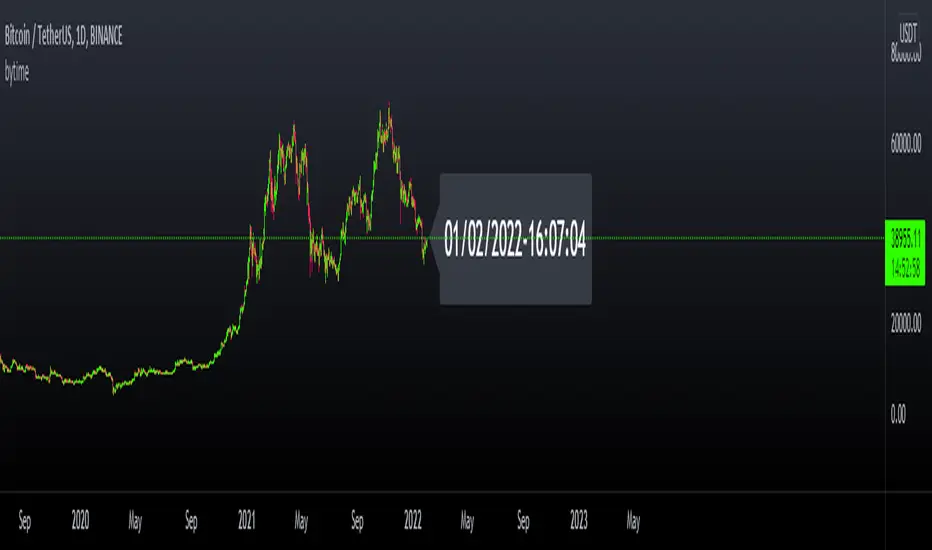
bytimeLibrary "bytime"
TODO: to do something at the specified time.
////Return =>> ht = hour , mt = minute , st = second ,Dt = Day, Mt = month, Yt = year , dateTime = full time format./////////////
Note : Remember to always add import when you call our library and change Gtime() to Timeset.Gtime() is used to access internal data.
import hapharmonic/bytime/1 as Timeset
=Timeset.Gtime()
/////////////Set a time to trigger an alert./////////////
ck = false
///hour : minute : second
if ht == TH and mt == TM and st == TS
//some action
//...
//.
ck := true
Gtime()
GT - Recent High/Low█ OVERVIEW
This indicator will help traders identify the recent high and low of the current trend so we know where we are in the trend. If recent high/low broken it could be that the trend is changing. This indicator is based on price action.
█ HOW IT WORKS
Basically, a trend is when the prices move up and down in a stair-step fashion. In an uptrend, The indicator keeps track of the up and down movement and remember the last high and once the price pull back and broke the recent high it will mark out the new high. When prices pull back in and uptrend it must not broken the recent low. If the pull back move broke the recent low it could means that the trend is changing and we could see prices start going down. Downtrend is the reverse of uptrend.
Whenever the price broke the recent high or low the script will go back from the candle that broken the previous high to find the recent low. As long as the high of previous candle is lower than each other consecutively backward, all of those candle will be counted as part of the up move. The lowest low of these candles will be counted as the recent low. If one of the candles that are part of the up move is an inside bar then the recent low is the low of that inside bar candle (for downtrend it will be the high). Inside bar candle is a candle that it's high and low are both inside the high and low of the candle preceding it (to its left).
█ DISCLAIMERS
The content of this post is NOT investment advice and I am not a financial advisor.
This is for educational purpose only.
Always do you own research. Do not blindly trust a random stranger online.
█ HOW DOES IT HELP YOU
Moving the recent high and low every time a candle break out is a very tedious job. Plus, you cannot set an automatic alert system whenever price broke a recent high or low. This indicator allow you to create an alert whenever a recent high or low is broken.
You can use this indicator as a trailing stop loss strategy. Move the stop loss of your long position to the recent low level whenever price broke recent high or move the stop loss of your short position to the recent high level whenever price broke recent low.
The bullet line is the minor recent high or low before the prices broke the major recent high/low. This line could be the level where prices touch before continue with the trend.
█ TRADING IDEAS
Based on how a candle broke the recent high or low, if it breaks impulsively you can develop your strategy to trade the pullback and hoping on the trend before it continue to move up or down.
█ CURRENT FEATURES
Recent high/low.
Previous high/low.
Inside bar marker.
Alert for when high/low broken. Configurable message format either in JSON or plain text, useful when using with webhook alert.
Bullet line (trend continuation line).
Toggle switch to redraw in realtime. CAUTION: this will cause repainting and alert will fire multiple time during a real-time bar.
█ NOTES
- I am very new to pine script. So there could be a way to handle the alert in realtime to not fire multiple time, Once I found a way I will update the indicator. However, redrawing in realtime will definitely cause repainting of high/low or bullet line, as far as I know this cannot be fixed because it is how pine script compiler works.
- If you like the indicators and it helps you please be sure to leave a like.
█ CREDITS
This indicator is made by me but the idea is inspired by Guerrilla Trading course. Which is why this indicator is closed-source. Guerrilla doesn't support the use of indicators and they believe in mastering reading candle sticks using price action on a naked chart. However, I'm a visual learner, I do my due diligent in backtesting and learning how to read the chart. I think that a little help with indicator to smooth my learning curve or make it easier to identify important level is very useful.
!IMPORTANT!: If you are a member of Guerrilla please do not advertise this indicator on their forum as they do not support the idea of using indicators.
While using the indicator if you found any bugs or the lines draw incorrectly please report it directly to me by leaving a comment or message me directly. Do not report the bugs of this indicator to Guerrilla Trading as this has nothing to do with them and they are not the maintainer.
If you are not a member of Guerrilla but you are considering joining Guerrilla Trading. You can support me out by using my affiliate link in my Signature . Thank you very much!
█ CONTRIBUTE
If you are a developer and a member of Guerrilla and you would like to contribute to this indicator please message me.

MTF Market Structure Highs and LowsThe indicator marks the last fractal highs and lows (W,D,4H and 1H options) to help determine current market structure. The script was created to help with directional bias but also as a MTF visual aid for stop hunts/liquidity raids.
Liquidity areas are where we assume trader's stop losses would be when buying or selling. Liquidity lies above and below swing points and institutions need liquidity to fill large orders.
Monitor price action as it hits these areas for a potential reversal trade.

Synthetic Price Action GeneratorNOTICE:
First thing you need to know, it "DOES NOT" reflect the price of the ticker you will load it on. THIS IS NOT AN INDICATOR FOR TRADING! It's a developer tool solely generating random values that look exactly like the fractals we observe every single day. This script's generated candles are as fake as the never ending garbage news cycles we are often force fed and expected to believe by using carefully scripted narratives peddled as hypnotic truth to psychologically and emotionally influence you to the point of control by coercion and subjugation. I wanted to make the script's synthetic nature very clear using that analogy, it's dynamically artificial. Do not accidentally become disillusioned by this scripts values, make trading decisions from it, and lastly don't become victim to predatory media magic ministry parrots with pretty, handsome smiles, compelling you to board their ferris wheel of fear. Now, on to the good stuff...
BACKSTORY:
Occasionally I find myself in situations where I have to build analyzers in Pine to actually build novel quantitative analytic indicators and tools worthy of future use. These analyzers certainly don't exist on this platform, but usually are required to engineer and tweak algorithms of the highest quality with the finest computational caliber. I have numerous other synthesizers to publish besides this one.
For many reasons, I needed a synthetic environment to utilize the analyzers I built in Pine, to even pursue building some exotic indicators and algorithms. Pine doesn't allow sourcing of tuples. Not to mention, I required numerous Pine advancements to make long held dreams into tangible realities. Many Pine upgrades have arrived and MANY, MANY more are in need of implementation for all. Now that I have this, intending to use it in the future often when in need, you can now use it too. I do anticipate some skilled Pine poets will employ this intended handy utility to design and/or improved indicators for trading.
ORIGIN:
This was inspired by the brilliance from the world renowned ALGOmist John F. Ehlers, but it's taken on a completely alien form from its original DNA. Browsing on the internet for something else, I came across an article with a small code snippet, and I remembered an old wish of mine. I have long known that by flipping back and forth on specific tickers and timeframes in my Watchlist is not the most efficient way to evaluate indicators in multiple theatres of price action. I realized, I always wanted to possess and use this sort of tool, so... I put it into Pine form, but now have decided to inject it with Pine Script steroids. The outcome is highly mutable candle formations in a reusable mutagenic package, observable above and masquerading as genuine looking price candles.
OVERVIEW:
I guess you could call it a price action synthesizer, but I entitled it "Synthetic Price Action Generator" for those who may be searching for such a thing. You may find this more useful on the All or 5Y charts initially to witness indication from beginning (barstate.isfirst === barindex==0) to end (last_bar_index), but you may also use keyboard shortcuts + + to view the earliest plottable bars on any timeframe. I often use that keyboard shortcut to qualify an indicator through the entirety of it's runtime.
A lot can go wrong unexpectedly with indicator initialization, and you will never know it if you don't inspect it. Many recursively endowed Infinite Impulse Response (IIR) Filters can initialize with unintended results that minutely ring in slightly erroneous fashion for the entire runtime, beginning to end, causing deviations from "what should of been..." values with false signals. Looking closely at spg(), you will recognize that 3 EMAs are employed to manage and maintain randomness of CLOSE, HIGH, and LOW. In fact, any indicator's barindex==0 initialization can be inspected with the keyboard shortcuts above. If you see anything obviously strange in an authors indicator, please contact the developer if possible and respectfully notify them.
PURPOSE:
The primary intended application of this script, is to offer developers from advanced to even novice skill levels assistance with building next generation indicators. Mostly, it's purpose is for testing and troubleshooting indicators AND evaluating how they perform in a "manageable" randomized environment. Some times indicators flake out on rare but problematic price fluctuations, and this may help you with finding your issues/errata sooner than later. While the candles upon initial loading look pristine, by tweaking it to the minval/maxval parameters limits OR beyond with a few code modifications, you can generate unusual volatility, for instance... huge wicks. Limits of minval= and maxval= of are by default set to a comfort zone of operation. Massive wicks or candle bodies will undoubtedly affect your indication and often render them useless on tickers that exhibit that behavior, like WGMCF intraday currently.
Copy/paste boundaries are provided for relevant insertion into another script. Paste placement should happen at the very top of a script. Note that by overwriting the close, open, high, etc... values, your compiler will give you generous warnings of "variable shadowing" in abundance, but this is an expected part of applying it to your novel script, no worries. plotcandle() can be copied over too and enabled/disabled in Settings->Style. Always remember to fully remove this scripts' code and those assignments properly before actual trading use of your script occurs, AND specifically when publishing. The entirety of this provided code should never, never exist in a published indicator.
OTHER INTENTIONS:
Even though these are 100% synthetic generated price points, you will notice ALL of the fractal pseudo-patterns that commonly exist in the markets, are naturally occurring with this generator too. You can also swiftly immerse yourself in pattern recognition exercises with increased efficiency in real time by clicking any SPAG Setting in focus and then using the up/down arrow keys. I hope I explained potential uses adequately...
On a personal note, the existence of fractal symmetry often makes me wonder, do we truly live in a totality chaotic universe or is it ordered mathematically for some outcomes to a certain extent. I think both. My observations, it's a pre-deterministic reality completely influenced by infinitesimal amounts of sentient free will with unimaginable existing and emerging quantities. Some how an unknown mysterious mechanism governing the totality of universal physics and mathematics counts this 100.0% flawlessly and perpetually. Anyways, you can't change the past that long existed before your birth or even yesterday, but you can choose to dream, create, and forge the future into your desires and hopes. As always, shite always happens when your not looking for it. What you choose to do after stepping in it unintentionally... is totally up to you. :) Maybe this tool and tips provided will aid you in not stepping in an algo cachucha up to your ankles somehow.
SCRIPTING LESSONS PORTRAYED IN THIS SCRIPT:
Pine etiquette and code cleanliness
Overwrite capabilities of built-in Pine variables for testing indicators
Various techniques to organize Settings panel while providing ease of adjustment utility
Use of tooltip= to provide users adequate valuable information. Most people want to trade with indicators, not blindly make adjustments to them without any knowledge of their intended operation/effects
When available time provides itself, I will consider your inquiries, thoughts, and concepts presented below in the comments section, should you have any questions or comments regarding this indicator. When my indicators achieve more prevalent use by TV members , I may implement more ideas when they present themselves as worthy additions. Have a profitable future everyone!

[H] Multi Coin Compare
Use a focal point to compare multiple coins price action to one another in real time
View the price of up to 5 coins in an easy to view table
Fully Customizable

FX Sessions - All in OneFX Sessions - All In One
This Script offer a wide variety of goodies
SESSION OPEN
it will draw a line for the TOP, MID and LOW of the asian session (you can adjust the hours of the session)
It will draw a line for the TOP and LOW of the London Session (you can adjust the hours of the session)
It will draw a line for the TOP and LOW of the NY Session (you can adjust the hours of the session)
SEPARATORS
while on lower timeframe, you will have a separator for days that occurs at midnight NY time
While on Daily timeframe, you will have a separator that will separate every month, on the 1st trading day of that given month
IMBALANCE
The candle leaving imbalance (a candle where there is a portion that is not matched with a price action left or right)
NY Midnight opening price
a dotted line will be drawn (up to 500 bar limitation) from NY open until it reaches either the 500 bar or the end of the day.
on lower timeframe (below 3 minutes) the bar will not reach the end of the day

Auto Price Action - Multi Time Frame [Mehrok]Auto Price Action - Volume Price and Spread - Multi Time Frame
Volume Price and Spread script generates important support and resistance levels basis activity happening in price, volume and candle spread. The basic idea has been taken from concepts of VSA which underlies that weakness appears in uptrend and strength in downtrend. Script will try to find candles which have volume higher then average and candle spread.
Underlying logic:
Script generates significant high's as resistance and lows as support basis activity happened on volume , price and candle spread. Multi Time Frame gives ability to find strong support and resistance levels on higher time frames and display on lower time frame chart.
Usage:
As it records and maintain important high and lows happening on candles till the time new levels are generated therefore generated price levels act as significant support or resistance. Higher the activity in volume , price and spread stronger that price level would act as support or resistance in future.
Script work on all time frame where volume information is available. In absence of volume information script would only generate optional levels and that too if activated.

Auto Price Action - Volume Price and Spread [Mehrok]Auto Price Action - Volume Price and Spread script generates important support and resistance levels basis activity happening in price, volume and candle spread. The basic idea has been taken from concepts of VSA which underlies that weakness appears in uptrend and strength in downtrend. Script will try to find candles which have volume higher then average and candle spread.
Underlying logic:
Script generates significant high's as resistance and lows as support basis activity happened on volume, price and candle spread. Once criteria set in script is met it would then mark that candle with resistance or support line which would act as important price action level later in time.
Usage:
As it records and maintain important high and lows happening on candles till the time new levels are generated therefore generated price levels act as significant support or resistance. Higher the activity in volume, price and spread stronger that price level would act as support or resistance in future.
Settings:
AvgLen- It would allow you to set the SMA settings for volume bars. By default set at 20 means that SMA of 20D volume would be considered in script.
Volume Start Threshold - Default 1.3 - You can change this setting basis stock volatility. This would set the starting point in script to trigger support or resistance levels if volume is equal or higher then the multiplier you have chosen.
Bearish Volume Mult 1, 2 and 3: Set the the levels which can be adjusted to generate x1, x2 or x3 resistance levels which would appear on top of candles.
Bullish Volume Mult 1, 2 and 3: Set the levels which can be adjusted to generate x1, x2, or x3 support levels which would appear at bottom of candles.
Use of bearish and bullish volume mult is to let user define the multiplier value against which current volume bar would be checked. Higher the value means rare it would be.
x1 - Starting level of resistance/support. It would be considered as level 1 of support or resistance which can be broken easily. Happen too often.
x2 - Medium level of resistance/support. It would be considered as level 2 of support or resistance which can give tough fight as price would reach this level. If set as more then 50% of stock volatility of instrument then price would react for sure.
x3 - Strongest level of resistance/support. If set 3 or higher it would be rare to be generated and price may not visit level too often.
Bullish Candle Matrix %: Keep it above 50 to let script check how strong bullish candle is. Strength of candle increase as value increase from 50 towards 100. Keep it at 52 to track maximum bullish candles.
Bearish Candle Matrix %: Keep it below 50 to let script check how strong bearish candle is. Strength of candle increase as value increase from 50 towards 0. Keep it at 47to track maximum bearish candles.
Optional Lines
Optional lines usage no volume activity therefore can generate important price levels basis volume and price only.
Script work on all time frame where volume information is available. In absence of volume information script would only generate optional levels and that too if activated.

Ryan's Candle Comboinside bar breakouts and reversal moves. version 1. use however u like it I cannot guarantee profitability :)
Price ActionFirst, you have to know price action, RTM price action Handbook could help you
this indicator shows you base and momentum candles
base candles could be zones of trade that show you fighting of bulls and bears, and momentum candles could show the power of those zones.
Base candles are white in the chart, and you can place your order at the good zone.
Rally candles and drop candles are momentum candles, and bold rally and bold drop show that it is more powerful than its before candle.
Zigzag compression is one way that shows the compression in trend.
it looks like the Wedges pattern at classic technical that shows pending orders are closed, so the target zone could be powerful to reverse the trend.
Black background of candle means that candle doesn't reach its before candle and so it is poor candle, I named it domination.
It is better to do not trade at poor candles.
At the end, I find Price action the best way to trade, and it makes you free of other indicator, even volume indicator.
This indicator is good for those who use price action strategy to trade and those who want to learn the price action.
It could be so helpful and reliable way to find the zones, and place buy or sell order and the target, specially for scalping.

Super Volume+(Süper Hacim+)English
The "Super Volume+" plug-in was designed to be used in conjunction with the "Super Volume" plug-in, but can also be used alone. It facilitates the use of "Volume Bar Patterns(Volume Action)" by marking voluminous and non-voluminous bars on the chart. It also helps to distinguish between useful support and resistance by highlighting strong trading zones. You can receive "high volume" notifications with the alarm feature.
How to use?
Volume buys and sells are marked with dark dots.
Volumeless buys and sells are marked with light colored dots.
Having more dark dots on the support or resistance lines you draw indicates that those regions are strong regions.
Warning: I discovered these formations, they are still in the testing phase. You should be careful while using it.
Shifting Volume Patterns
*The volumeless red candles on the hills indicate that the decline will begin, and the decline accelerates with the normal and volume sales that follow.
*Green candles with no volume at the bottom indicate that the rise will begin, and the rise will accelerate with the normal and voluminous purchases that follow.
Fake Volume Patterns
*Volumeless red candles formed in an upward movement are false decreases and the rise continues.
*The volumeless green candles formed in a bearish movement are false rises and the decline continues.
Working logic:
For Shifting Volume Formations; the total volume of buying and selling is less than half of the 90 bar average. Incoming transactions are greatly reduced. This shows us that either the buyer or the seller is about to run out. Transactions of the prevailing party increase. We can understand which side is winning by looking at the color of the candle when the candle is closed. If it is red, the decline continues, if it is green, the rise continues.
For Fake Volume Formations; the total volume of buying and selling is less than half of the 90 bar average. Let's consider a minor trend, a candle without volume (buying or selling without volume) will not be enough to disrupt the trend. A small amount that comes in cannot change the direction of the buying or selling transaction. The price continues in the same direction even if there are candles of different colors in the trend.
Türkçe
"Süper Hacim+" eklentisi "Süper Hacim" eklentisi ile birlikte kullanılmak için tasarlandı ancak tek başına da kullanılabilir. Grafik üzerinde hacimli ve hacimsiz barları işaretleyerek "Hacim Çubuk Formasyonlarının" kullanımını kolaylaştırır. Ayrıca güçlü alım satım bölgelerini belirginleştirmesi sayesinde işe yarayacak destek ve dirençlerin kolayca ayırt edilmesine yardımcı olur. Alarm özelliği ile "yüksek hacim" bildirimleri alabilirsiniz.
Nasıl Kullanılır?
Hacimli alış ve satışlar koyu renkli noktalar ile işaretlenir.
Hacimsiz alış ve satışlar açık renkli noktalar ile işaretlenir.
Çizdiğiniz destek veya direnç çizgileri üzerinde koyu renkli noktaların fazla olması o bölgelerin güçlü bölgeler olduğunu gösterir.
Uyarı: Bu formasyonları ben keşfettim hala test aşamasındadır. Kullanırken dikkatli olmalısınız.
Yön Değiştiren Hacim Formasyonları
*Tepelerde oluşan hacimsiz kırmızı mumlar düşüşün başlayacağına işaret eder sonrasında gelen normal ve hacimli satışlarla düşüş hızlanır.
*Diplerde oluşan hacimsiz yeşil mumlar yükselişin başlayacağına işaret eder sonrasında gelen normal ve hacimli alışlarla yükseliş hızlanır.
Fake Hacim Formasyonları
*Bir yükseliş hareketi içerisinde oluşan hacimsiz kırmızı mumlar sahte düşüşlerdir yükseliş devam eder.
*Bir düşüş hareketi içerisinde oluşan hacimsiz yeşil mumlar sahte yükselişlerdir düşüş devam eder.
Çalışma mantığı:
Yön Değiştiren Hacim Formasyonları için; alış ve satış toplam hacim miktarı 90 barlık ortalamanın yarısından azdır. Gelen işlemler çok azalmıştır. Bu da bize alıcıların yada satıcıların ikisinden birinin bitmek üzere olduğunu gösterir. Üstünlük kazanan tarafın işlemleri artar. Hangi tarafın kazandığını mum kapandığında rengine bakarak anlayabiliriz kırmızı ise düşüş devam eder yeşil ise yükseliş devam eder.
Fake Hacim Formasyonları için; alış ve satış toplam hacim miktarı 90 barlık ortalamanın yarısından azdır. Minör bir trend düşünelim yükselen yada düşen trendin tersine oluşacak hacimsiz mum (hacimsiz alış veya satış) trendi bozmaya yetmeyecektir. Gelen küçük bir miktar alış yada satış işlemin yönünü değiştiremez. Trend içinde farklı renkte mum olsa da fiyat aynı yönde devam eder.
Örnek / Example:

DEMO of STC Price ActionThis is replica of the STC Price Action Script & is created for demo purpose only. Few features of original script may not be available in Demo Script.
How this works:
This Indicator looks to identify patterns which shows high movement area which may have occurred due to big orders at that time. It helps to Identify Price Action Zones where we may anticipate some reverse move. These Zones & Moves are helpful for Traders.
Buying Zone is below current Market Price. It indicates Price Action area where Buyers overpowered Sellers hence there was big Leg out Candle. This zone may again give buying momentum if Price comes back to that level. As a Trader one may take opportunity enter into the Trade on Bullish Side.
Selling Zone is above current Market Price. It indicate Price Action area where Sellers overpowered Buyers hence there was big Leg out Candle. This zone may again give Selling momentum if Price comes back to that level. As a Trader one may take opportunity enter into the Trade on Bearish Side.
DISCLAIMER:
This indicator/code IS NOT intended to be a formal investment advice or recommendation by the author, nor should be construed as such. Users will be fully responsible by their use regarding their own trading vehicles/assets.
It is strongly recommended that you should get full knowledge of how price actions work and wait for the clear indications before attempting.

STC Price Action ZoneHow this works:
This Indicator looks to identify patterns which shows high movement area which may have occurred due to big orders at that time. It helps to Identify Price Action Zones where we may anticipate some reverse move. These Zones & Moves are helpful for Traders.
Buying Zone is below current Market Price. It indicates Price Action area where Buyers overpowered Sellers hence there was big Leg out Candle. This zone may again give buying momentum if Price comes back to that level. As a Trader one may take opportunity enter into the Trade on Bullish Side.
Selling Zone is above current Market Price. It indicate Price Action area where Sellers overpowered Buyers hence there was big Leg out Candle. This zone may again give Selling momentum if Price comes back to that level. As a Trader one may take opportunity enter into the Trade on Bearish Side.
DISCLAIMER:
This indicator/code IS NOT intended to be a formal investment advice or recommendation by the author, nor should be construed as such. Users will be fully responsible by their use regarding their own trading vehicles/assets.
It is strongly recommended that you should get full knowledge of how price actions work and wait for the clear indications before attempting.

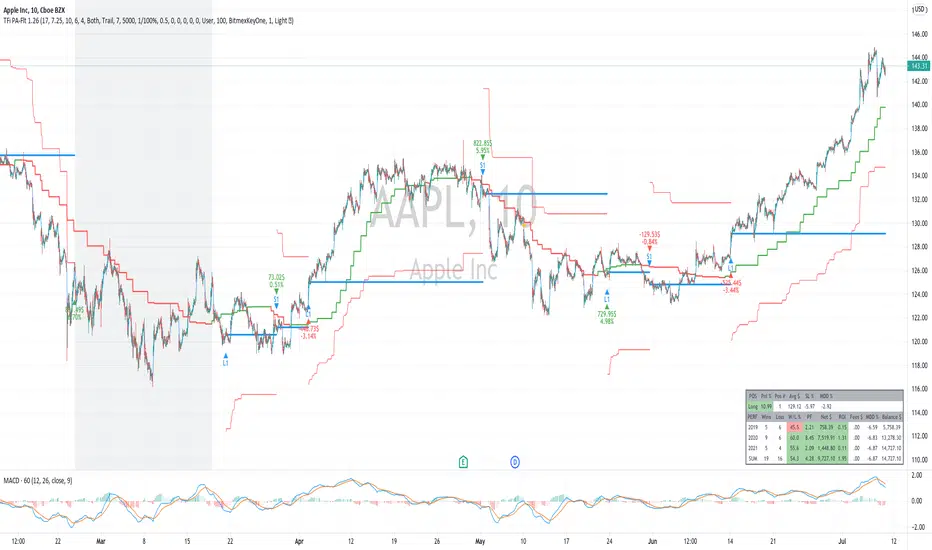
TFi Price Action Resampling Filter V1 - FULLThe script is resampling the price based on its range/price-action and creates an alternative filter to smoothen price movements.
Overview of features:
Optional stop-loss
Optional flags to control the position entry
Optional flags to control the position exit
Built-in backtesting engine with start balance, position size and pyramiding; each year will be evaluated separately
Inputs for a percentage entry and exit slippage, entry/exit and daily funding fees
Configurable alerts, which follow the exact position of the entry/exit marker
Alert messages contain predefined trading instruction to execute orders via Alertatron or TradeFab's proprietary trading server, or can be defined by the user
The script renders a performance/status table, which shows the current position status and result of the built-in trading simulation results.
It shows the following statistic values:
Current position PnL - also background turns green if position is in profit and red if in loss
Average entry price and number of positions
Current percentage distance to the optional stop-loss level
Current Maximum Draw Down
Number of wins and losses and the win/loss ratio per year and overall
Profit and loss amount, paid fees per year and overall
Profit-ratio and Maximum Draw Down per year and overall
Balance and ROI per year and overall
Relative VolatilityRelative volatility highlights large changes in price. This was designed to be used with my relative volume indicator so that traders can see the effect of volume on price action. It is also a good tool to analyse breakout patterns to identify best entry points and waves.
Above shows relative volatility and relative volume working together.

Tipsy EMA Tipsy EMA
v0.2a
Coded by vaidab.
A simple strategy to buy dips in an uptrend.
How to use:
- buy on trend when price retraces to the orange "buy" line and compound orders
- sell when price reaches red line (stop loss) or at 💰 (take profit)
Note that you can reverse trade on the 💰 sign for a short scalp / day trade.
Uptrend: green/red background. Danger zone: orange bg. No go zone: no bg.
Potential buys (in a clear trend): 55, 100, 200 EMA touches and
fibo retracements to .382 and .618.
Potential stop loss: when price breaks the 200 EMA (marked by a red line).
Exit signs: opposite trend divergences (RSI).
Take profit: EMA 55 crossing down EMA 100.
Use it in confluence with market structure. E.g. If 200 EMA ligns up with
past market structure, if there are whole numbers or if there's a monthly level.
Tested BTCUSDT D, 4H

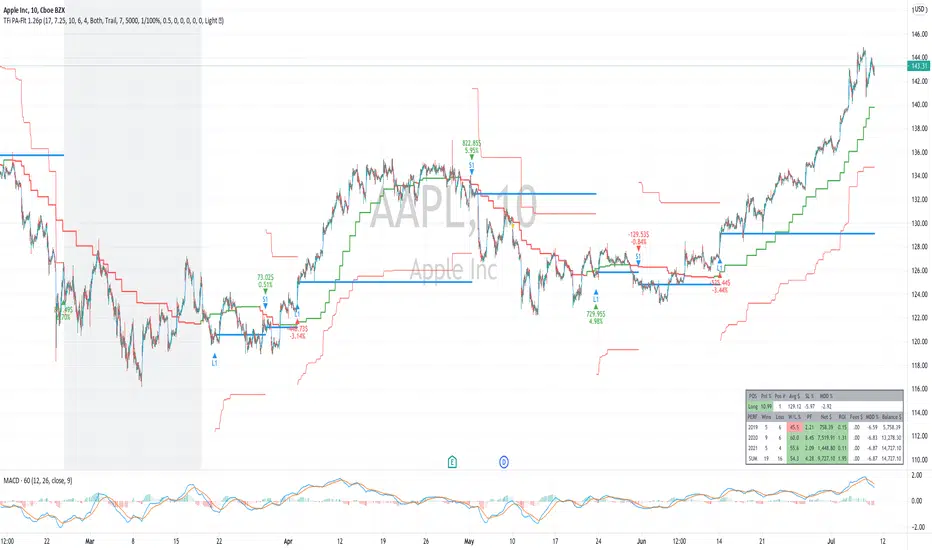
TFi Price Action Resampling Filter V1The script is resampling the price based on its range/price-action and creates an alternative filter to smoothen price movements.
Overview of features:
Optional stop-loss
Optional flags to control the position entry
Optional flags to control the position exit
Built-in backtesting engine with start balance, position size and pyramiding
Inputs for a percentage entry and exit slippage, entry/exit and daily funding fees
Configurable alerts, which follow the exact position of the entry/exit marker
Alert messages contain predefined trading instruction to execute orders via Alertatron or TradeFab's proprietary trading server
The script renders a status box at the last bar, which shows the current position status and result of the built-in trading simulation results.
It shows the following statistic values:
Current position PnL - also background turns green if position is in profit and red if in loss
Average entry price and number of positions
Current percentage distance to the optional stop-loss level
Current Maximum Draw Down
Overall number of wins and losses and the win/loss ratio
Overall profit and loss amount, paid fees
Overall profit-ratio and Maximum Draw Down
Overall balance and ROI

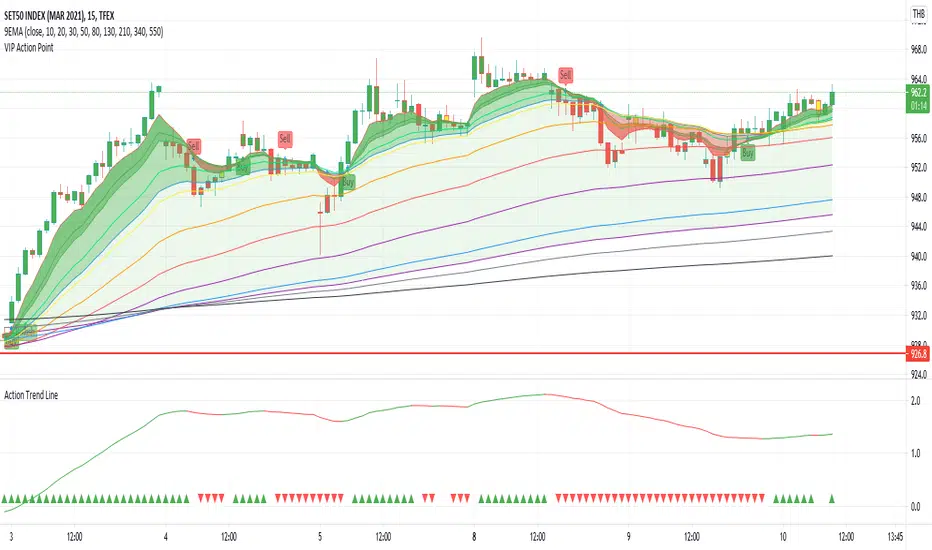
Action Trend LineAction Trend Line is different of Moving Average between ema26 and ema260
My idea is, if ema26 drop to ema260 means downtrend
if ema26 increase or moving out of ema260 means uptrend
then writting a different line by 100 scale to be clear vision
at the bottom have plot sign up and down for each candle, it is status information
The chart show Action Trend Line, by 2 color and 2 sign at the bottom of chart.
If the line is growing up then color is green. you could know that is uptrend.
If the line is going down then color is red. you could know that is downtrend.
The triangle sign at the bottom of chart show trend folowing.
If previous and this line are uptrend, the triangle up and green color.
If previous and this line are downtrend, the triangle down and redcolor.
otherwise, the trend going to change it dosen't plot any sign, you cloud know warning the trend going to be change.
Must try and make you clearly understand.
First Week Trend [MX]I created this indicator based on one of my ways of analyzing the BTC trend in particular, I noticed that the break of the first weekly candle usually indicates the trend for the rest of the month.
This indicator has a bug in which if you change the timeframe of the indicator it will show erroneous values
If you use the candlestick chart, you will need to pull the visual order of this indicator to the top to overlay the colors of the standard candles, or simply hide the standard candles
the trend colors are bugged in timeframes other than the weekly
special thanks to @xdecow who helped me with the code
////////////////////////////////////////////////////////////////////////
Eu criei esse indicador baseado em uma das minhas formas de analisar a tendência do BTC em específico, eu notei que o rompimento do primeiro candle do semanal costuma indicar a tendência para o resto do mês.
Esse script tem um bug em que se mudar o timeframe do indicador ele irá mostrar valores errados
Se você usa o gráfico de candlesticks, você precisará puxar para o topo a ordem visual desse indicador para sobrepor as cores do candles padrões, ou simplesmente ocultar os candles padrões
as cores da tendencia estão bugados em outros timeframes diferentes do semanal
agradecimentos especiais ao @xdecow que me ajudou no código

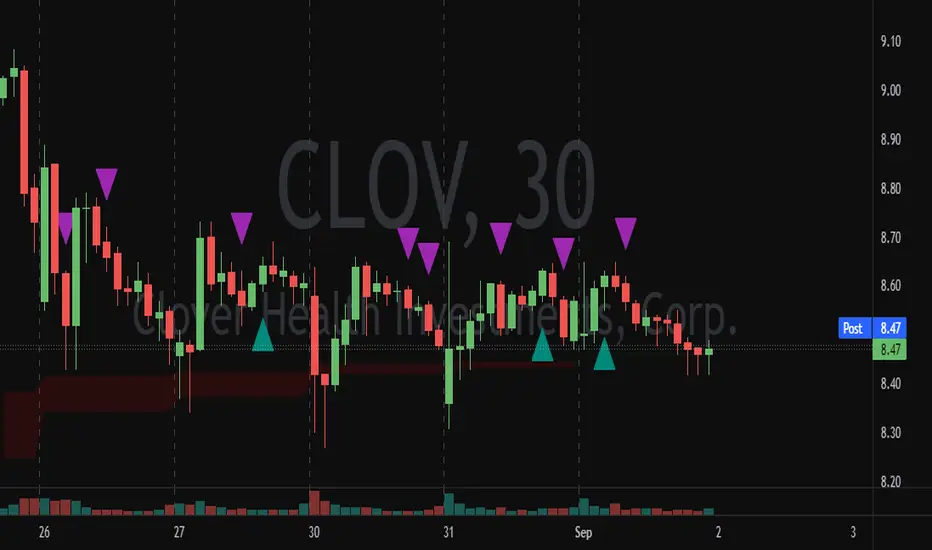
Demand Supply Indicator With AlertsThe Demand Supply Zone indicator with Alerts helps in identifying the Demand Supply zones on chart by pinpointing them.
The indicator looks for Demand Zone patterns, Drop-Base-Rally or Rally-Base-Rally , when such pattern is identified the indicator marks it on the chart. Likewise, if the indicator identifies Supply Zone patterns, Rally-Base-Drop or Drop-Base-Drop the indicator marks it as Supply Zone. The basing candles are changed to Blue color and the Legout candles are changed to Black color by default.
Using the Demand Supply Zone Indicator with Alerts you can also set Alerts on your favourite scripts and timeframes, to get notification when Demand Supply Zones are formed.
List of all the features is provided below.
1. You can choose which patterns the indicator should identify.
2. Number of candles in basing from 1 to 6.
3. Strength of the legout.
4. Identify follow-through patterns.
5. Hide Single Legout patterns.
6. Strength of the first legout in follow through pattern.
7. Strength of the second legout in the follow through pattern.
8. Customize Basing Color
9. Customize Legout Color
10. Display Pattern Name
11. Display Proximal and Distal Values
12. Color customization for Demand Supply Zone Labels
13. Set Alerts based on Demand Supply Zone formation
To set Alerts follow the steps provided below.
1. Go to the symbol chart and select the timeframe on which you want to set Alerts.
2. Select Alerts Tab and click on Create Alert, shortcut key Alt+A
3. In Condition Select, Demand Supply Indicator With Alerts
4. In Options, select Once Per Bar Close
5. Select expiry as per your preference or keep it open-ended
6. Select Alerts Actions as per your preference
7. Alert name is optional
8. Default message is “Zone Alert” and can be modified
9. Click on Create and in the warning window select Continue Anyway
Once you have active alert, you will keep getting notification whenever a Demand/Supply zone in identified on the symbol and time frame you selected.
Use the link below to obtain access to this indicator.
