DMT 369 DRAGRONFLY StudyDragonfly Study version plus statistics panel
Successful traders trade with a fixed plan and without emotion, but this a lot harder than many new traders think. Many never master this skill and suffer continual drawdowns on their accounts as they overtrade high leverage positions in volatile markets.
ĐΜŦ Autobot resolves this issue by taking the human element out of the equation, allowing full automation of trades using TradingView alerts to trigger your favourite trading bot, such as Alertatron or 3Commas.
Being a Trend Reversal Indicator based on Volatility & Average True Range , ĐΜŦ Autobot is designed to identify spots in the market that offer suitable scalp and swing trade opportunities.
Due to popular demand we have expanded our ĐΜŦ Autobot product line to include the new ĐΜŦ Autobot Dragonfly 3-6-9 Edition which combines DMT with 3-6-9 Vortex mathematics, our Titan indicator and a multi-ladder scalping strategy to ensure you maintain a preferable average entry when price action moves against your position.
Indicator View
It its default state the DMT Autobot Dragonfly indicator displays key signal information, such as:
• Support & resistance range lines
• Titan Body Small & Large Time Frame lines
• Long & Short entry positions
• Long & Short position ladders
• Profit targets
Dragonfly displays a range between resistance (upper line) and support (lower line) on the chart.
Once the price is granted support in the range the lower line will turn green. As price action develops it will make repeated attempts to test support. If support holds price will attempt to test the resistance line (red).
When resistance is broken and the price is above the upper line, the line will turn blue confirming the bullish momentum and provide a potential buy opportunity.
Price action will make attempts to test the upper line as support and will keep rising while support is granted.
Once support is lost the upper line will become red once more. As price action develops it will make repeated attempts to test resistance. If resistance holds, the price will attempt to test the support line (green).
When support is broken and the price goes below the lower line, the line will turn red confirming the bearish momentum and provide a potential selling opportunity.
Price action will make attempts to test the lower line as resistance and will keep dropping while resistance is granted.
Titan Body
The Titan Body Small & Large time frame options in the indicator add additional trendlines to the chart to provide further clarity and confirmation to the Support & Resistance range indication.
Once price is granted support by the Small Time Frame trend line the line will turn green. As price action develops it will make repeated attempts to test the Small Time Frame support. Once the price is below the Small Time Frame trend line , the line will turn red and can act as resistance in a trend reversal.
When price is granted support by the Large Time Frame trend line the line will turn cyan. As price action develops it will make repeated attempts to test the Large Time Frame support. Once the price is below the Large Time Frame trend line , the line will turn orange and can act as resistance in a trend reversal.
The Titan Body enabled and customized in the indicator’s style settings,
Alert indicators
DMT Autobot Dragonfly Edition generates signals that can be used to scalp trade a volatile asset.
Signals are enabled and customized in the indicator’s input settings Additional options can be found in the options, but it is recommended that these are left at the default, as shown below. The indicator generates many
Entry and Profit levels can be disabled or customized in the indicator’s style settings,
Tradingview Alerts
Using Tradingview alerts, DMT Autobot Dragonfly signals can be used to trigger a trading bot.
To trigger a long or short position, set the Tradingview Alert Condition to DMT 369 Dragonfly and select the long or short option.
It is recommended that long or short positions are configured to trigger Once Per Bar Close
Ladders can also be triggered using alerts. To trigger a ladder order, set the Tradingview Alert Condition to DMT 369 Dragonfly and select the appropriate Long or Short ADD option that is to be triggered by the relevant values defined in the indicator’s configuration.
It is recommended that ladder orders are configured to trigger Once Per Bar,
To trigger a take profit order, set the Tradingview Alert Condition to DMT 369 Dragonfly and select the Long or Short TP option that is to be triggered by the relevant values defined in the indicator’s configuration.
Take profit orders can be configured as Once Per Bar Close or Once Per Minute.
If you wish to trigger a take profit signal immediately when the indicator’s defined take profit value is achieved, then use the Once Per Bar option.
Selecting Once Per Bar Close to generate a take profit signal is a gamble as the candle may close far away from the defined profit target – positive or negative.
While stops can be used, they are not applicable to the recommended ladder strategy.
Ladder Strategy
The DMT Autobot Dragonfly indicator always turns an underwater position into a win by utilizing a ladder strategy.
By using the recommended defaults, the indicator will trigger ladder orders at 3%, 6% & 9% using increasing order sizes,
Order sizes increase exponentially to ensure a good average price is maintained. If you are not using DMT Autobot Dragonfly signals to trigger ladder or take profit orders, please ensure your trading bot is configured to recalculate the new ladder entry and profit target based on the new average position entry price as each ladder is filled.
If you are using DMT Autobot Dragonfly on a leveraged asset, please ensure the leverage position is configured suitably so that your position is not liquidated if the price rapidly moves against you.
If u are looking for more information or access to the script please private msg me in trading view chat thx for support
Action

DMT 369 DRAGRONFLY STRATSuccessful traders trade with a fixed plan and without emotion, but this a lot harder than many new traders think. Many never master this skill and suffer continual drawdowns on their accounts as they overtrade high leverage positions in volatile markets.
ĐΜŦ Autobot resolves this issue by taking the human element out of the equation, allowing full automation of trades using TradingView alerts to trigger your favourite trading bot, such as Alertatron or 3Commas.
Being a Trend Reversal Indicator based on Volatility & Average True Range, ĐΜŦ Autobot is designed to identify spots in the market that offer suitable scalp and swing trade opportunities.
Due to popular demand we have expanded our ĐΜŦ Autobot product line to include the new ĐΜŦ Autobot Dragonfly 3-6-9 Edition which combines DMT with 3-6-9 Vortex mathematics, our Titan indicator and a multi-ladder scalping strategy to ensure you maintain a preferable average entry when price action moves against your position.
Indicator View
It its default state the DMT Autobot Dragonfly indicator displays key signal information, such as:
• Support & resistance range lines
• Titan Body Small & Large Time Frame lines
• Long & Short entry positions
• Long & Short position ladders
• Profit targets
Dragonfly displays a range between resistance (upper line) and support (lower line) on the chart.
Once the price is granted support in the range the lower line will turn green. As price action develops it will make repeated attempts to test support. If support holds price will attempt to test the resistance line (red).
When resistance is broken and the price is above the upper line, the line will turn blue confirming the bullish momentum and provide a potential buy opportunity.
Price action will make attempts to test the upper line as support and will keep rising while support is granted.
Once support is lost the upper line will become red once more. As price action develops it will make repeated attempts to test resistance. If resistance holds, the price will attempt to test the support line (green).
When support is broken and the price goes below the lower line, the line will turn red confirming the bearish momentum and provide a potential selling opportunity.
Price action will make attempts to test the lower line as resistance and will keep dropping while resistance is granted.
Titan Body
The Titan Body Small & Large time frame options in the indicator add additional trendlines to the chart to provide further clarity and confirmation to the Support & Resistance range indication.
Once price is granted support by the Small Time Frame trend line the line will turn green. As price action develops it will make repeated attempts to test the Small Time Frame support. Once the price is below the Small Time Frame trend line, the line will turn red and can act as resistance in a trend reversal.
When price is granted support by the Large Time Frame trend line the line will turn cyan. As price action develops it will make repeated attempts to test the Large Time Frame support. Once the price is below the Large Time Frame trend line, the line will turn orange and can act as resistance in a trend reversal.
The Titan Body enabled and customized in the indicator’s style settings,
Alert indicators
DMT Autobot Dragonfly Edition generates signals that can be used to scalp trade a volatile asset.
Signals are enabled and customized in the indicator’s input settings Additional options can be found in the options, but it is recommended that these are left at the default, as shown below. The indicator generates many
Entry and Profit levels can be disabled or customized in the indicator’s style settings,
Tradingview Alerts
Using Tradingview alerts, DMT Autobot Dragonfly signals can be used to trigger a trading bot.
To trigger a long or short position, set the Tradingview Alert Condition to DMT 369 Dragonfly and select the long or short option.
It is recommended that long or short positions are configured to trigger Once Per Bar Close
Ladders can also be triggered using alerts. To trigger a ladder order, set the Tradingview Alert Condition to DMT 369 Dragonfly and select the appropriate Long or Short ADD option that is to be triggered by the relevant values defined in the indicator’s configuration.
It is recommended that ladder orders are configured to trigger Once Per Bar,
To trigger a take profit order, set the Tradingview Alert Condition to DMT 369 Dragonfly and select the Long or Short TP option that is to be triggered by the relevant values defined in the indicator’s configuration.
Take profit orders can be configured as Once Per Bar Close or Once Per Minute.
If you wish to trigger a take profit signal immediately when the indicator’s defined take profit value is achieved, then use the Once Per Bar option.
Selecting Once Per Bar Close to generate a take profit signal is a gamble as the candle may close far away from the defined profit target – positive or negative.
While stops can be used, they are not applicable to the recommended ladder strategy.
Ladder Strategy
The DMT Autobot Dragonfly indicator always turns an underwater position into a win by utilizing a ladder strategy.
By using the recommended defaults, the indicator will trigger ladder orders at 3%, 6% & 9% using increasing order sizes,
Order sizes increase exponentially to ensure a good average price is maintained. If you are not using DMT Autobot Dragonfly signals to trigger ladder or take profit orders, please ensure your trading bot is configured to recalculate the new ladder entry and profit target based on the new average position entry price as each ladder is filled.
If you are using DMT Autobot Dragonfly on a leveraged asset, please ensure the leverage position is configured suitably so that your position is not liquidated if the price rapidly moves against you.
If u are looking for more information or access to the script please private msg me in trading view chat thx for support

Market EmotionsThis is a simple and fun indicator I built out of boredom one night. It's great for a quick laugh, but other than that, it's useless. It simply displays emotes for various thresholds of change in price between the open and close of a candle. For example, unicorn candles are any candles that gain 25% or more from opening price to closing price.

Price/Volume Value HistogramAn interesting implementation of mine to measure an asset changes based on asset price velocity and volume velocity. The indicator acts as asset value calculator. Long and Short.
==Points System Rules==
UPTRENDING
If Current Close is higher than previous Close and Current Volume is bigger than previous Volume: Adds Close Points and Volume Points
Otherwise check
If Current Close is higher than previous Close: Adds Only Close Points
DOWNTRENDING
If Current Close is lower than previous Close and Current Volume is bigger than previous Volume: Reduces Close Points and Volume Points
Otherwise check
If Current Close is lower than previous Close: Reduces Only Close Points
==Plotting==
Result of the values are summed up to a histogram.
Obviously on increasing prices and volume the histogram will be above zero line and on the Bullish side (green color), otherwise, on the Bearish side (red color).
You can't cheat the price movement, it's just what it is.
Optional to smooth it by EMA (set to true by default).
Like if you Like and Enjoy!
Follow for upcoming indicators.
Renko MTF - Traditional and ATRSomehow there aren't too many renko bars that have the traditional setting built-in so I put one up. This one has the option to choose between Traditional and ATR, the size number corresponds to the option that was chosen. And just in case if anyone wanted, I put up a multi-time frame option to choose the time frame the bars take place. D is for day, W is for week, flat numbers are in minutes, and leaving it blank looks at the current time frame the chart is in. The calculation comes from how Tradingview handles renko bars.
Renko bars don't paint a color unless the market moves a certain amount based on its settings. When the market moves up it turns green, if it moves down it turns red, simple color changes alone can say a lot. They're a good way to try to find trends somewhat objectively and seem to be a good way to eliminate time and can replace other time-based indicators that can whipsaw or lag. The bars have a tendency to repeat themselves so it's a good way to find trends. There aren't too many settings for the box size, most people either just choose 5, 10, 14, etc where as other indicators have many options that differ on different markets. The numbers can be chosen easily enough to pick a sweet spot with just a single input where other indicators such as MACD have multiple inputs to pick the right number that can make it difficult to choose from(although it won't be as precise as a MACD would sometimes but can be worth the objectiveness and consistency and same setting repeatability in different markets in my opinion). Some example strategies could be to use them as an alternative trailing stop, finding trends, a simple color change for entry and exit on top of other strategies, etc. It can do the job of many in an all in one price action type indicator(although not better all the time, it can come close enough). Despite all this, it does seem to depend on which time-frame it's being looked at, how TV does the calculation for it, and how one can use this with the lack of practical information on it out there.

ATR TRex [ipooya]To appreciate dear Mr.Khakestar efforts I have converted his mt4 ATR formula to pine script. All credits go to him.
you can view the ATR result of each candle in the past:
The first black number is the ATR of the M1 chart.
The second black number is the ATR of the M5chart.
The third black number is the ATR of the M15 chart.
The fourth black number is the ATR of the H1 chart.
The fifth black number is the ATR of the H4 chart.
The sixth black number is the ATR of the Daily chart.
The seventh black number is the ATR of the Weekly chart.
**and the second number of every line is live ATR ( current ATR candle)
What makes this ATR formula so different?
This formula invented by Mr.Khakestar and it shows the power of the price to move in each cycle of the chart. We can use it in RTM strategy and Price Action trading. To learn how to use it you need to learn TRex strategy (Presented by Mr.Khakestart for free in Persian).

Backwards price projection - few bars ahead reverse chartEver wondered what the chart would look like if it's flipped upside down and flipped horizontally into the future? The idea is that when there is a trend, a repeating pattern tends to occur. Going backwards and projecting that movement into the future can supposedly show what the future price will be.
Somehow I haven't found anyone try it like this and I am currently trying to find a way to use a reversed moving average or plot of some kind to project further ahead. TV at the moment does not allow offsets on candle plot(as far as I know) and I am only allowed a certain number of plots to go on the chart, so I put as many price moves ahead as I could to project the future price. It's a bit sloppy with all those forced plots but it gets the job done. I'll see if I can improve it with a moving average or something and possibly make a strategy out of it in the future.

Moving Average of Upper and Lower Wicks with optional smoothingIn the book, The New Technical Trader by Tushar Chande and Stanley Kroll there is a part that talks about candlestick analysis and how the wicks play a role on how the price will behave. When wick lengths increase then there could be uncertainty. Weakening of support and resistance levels can also be seen by the size of the candlestick wicks or shadows. Shoutouts to Mango2Juice from Tradingview and the The Academy of Forex for helping me out in making this and providing the moving averages function.
When combined with other indicators or strategies, I find that this increases their accuracy when used correctly. For those that believe in price action, this might be worth a try. The book has only a brief section on candlestick wicks but it is one of the most interesting ideas I found. The book likes to include a simple moving average in its indicators with a certain length to provide a smoothing type of effect or a sort of extra indicator for the other to be above to give off quicker signals at the cost of accuracy. For this indicator it acts as a smoothing type effect which I put in because it is hard to see the slope and direction of where the moving averages of the wicks are going. The type of moving averages to use and the correct lengths are questionable and are not explained well in the book. If anyone can figure out a good use for this or know better settings or tips, please let me know.

Trailing EngulferTrailing Engulfer is a price action strategy that uses trailing orders that makes use of any timeframe although shorter timeframes are typically used with price action trading. due to it being price action related, there are some differences needed when trading with different assets. This strategy is recommended to be used for stocks and futures only although it can be used on others. There are two specific inputs that pertain to futures: trailing trigger and trailing offset. Futures price changes in ticks and tick values are supposed to be used here, whereas the percentage fields are primarily for stocks.
Inputs:
Futures: Trailing Trigger - used for futures only and the value represents the number of ticks you wish for a trailing order to enter. For example: if set to 4 ticks, the trailing stop will not be created until after 4 ticks of profit has been reached.
Futures: Trailing Offset - used for futures only and the value represents the number of ticks you wish the stop to trail the price. For example: if set trigger is set to 4 and offset is set to 3, then the trailing stop order will be created once a profit of 4 ticks has been reached and the trailing stop will be 3 ticks against you.
Max Loss (%) - used for stocks only and the value represents the maximum loss you are willing to take in case the trailing stop hasn't yet been made. For example: you wish the trailing stop to be created once it has made 1% profit. If it never reaches that, it will close at this Max Loss value.
Trailing Trigger (%) - used for stocks only. It works similar to the futures trigger other than the fact that it uses % rather than ticks.
Trailing Offset (%) - used for stocks only. It works similar to the futures trigger offset other than the fact that it uses % rather than ticks.
Futures also have a "Max Loss" but it is not user defined. For futures, the max loss is not based on a tick loss but rather entirely on the asset's price action.
Futures also makes use of shorting.

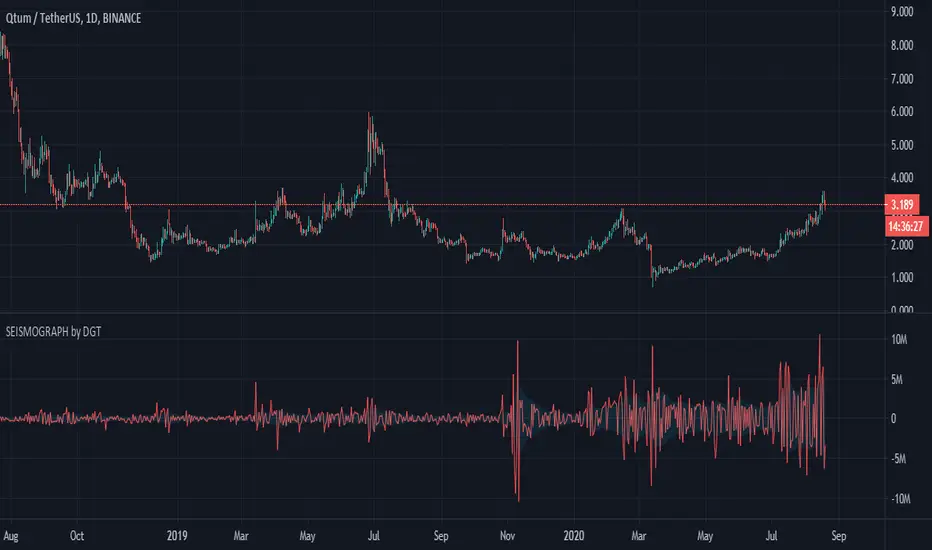
Earthquake Effect by DGTInstitutional investors have a profound impact on financial instruments prices because of the large volume, and their trading activities can greatly impact the price of financial instruments. They sometimes may split trades over time in order to not make a material impact and of course not to decrease liquidity to the point where there may be no one to take the other side of the trade.
Institutional investors (Smart Money) may create an Elephant Effect on the prices of financial instruments, and this study aims to display by emphasizing high volume changes
In the memory of the North Anatolian Earthquake that struck on August 17, 1999, that we remember with pain today, and similarities of plotting outcomes to seismograph plotting I preferred to name this study as Earthquake Effect (SEISMOGRAPH)
Disclaimer:
Trading success is all about following your trading strategy and the indicators should fit within your trading strategy, and not to be traded upon solely
The script is for informational and educational purposes only. Use of the script does not constitute professional and/or financial advice. You alone have the sole responsibility of evaluating the script output and risks associated with the use of the script. In exchange for using the script, you agree not to hold dgtrd TradingView user liable for any possible claim for damages arising from any decision you make based on use of the script
Dominator Ladder StrategyThe Dominator is a technical indicator. Based on algorithm calculations, this indicator extrapolates the previous price for the next bar.
Here is how Dominator is calculated:
1. The study estimates the price projected for the next bar. The estimated price is based on the algorithm method.
2. The study extrapolates this value to find a projected price change for the next bar.
The resulting extrapolated value is shown as a histogram on a lower subgraph. By default, sections of the histogram where the extrapolated value is increasing are shown in green; sections corresponding to the decreasing value are shown in red.
Note: Value projection is purely mathematical as all calculations are based on algorithm averaging of previous values.
Note: lower subgraph it's just for you to understand and view the waves during the Strategy process Study it's not included in this strategy.
Overlay True
The strategy includes 3 different adjustable levels for the ladder , plus automatic adjustable stop loss and takes profit calculated from your average entry price after each ladder adds.
Adjustable BAcktest Window.
1 long signals
3 ladder long add signals
1 short signals
3 ladder short add signals
1 dynamic stop calculated from your average entry price
1 dynamic take profit calculated from your average entry price

Strategy based on the principles of Price ActionIt is considered the percentage of candles with low and high closure for a certain period. Then, a moving average is built from these values. When the moving average of the ratio of tall candles to low candles is greater than the ratio of low candles to high, then long (that is, when the green line crosses the red). And vice versa - a condition for short. It also works on crypto with other settings. Idea for improvement: you can make partial exit by taking, at certain profit levels, the chart will be more stable. Result with a commission of 0.004% You can create an optimizer, and use this strategy on any liquid asset. (Sorry for google translator)

Forecast Oscillator & Point of ForceThis is a scaled version of the Forecast Oscillator, paired with a Point of Force Indicator, my modification of an indicator, whose original name and developer happened to be missing on my notes, so my regards to the author).
Point of force is a spot from where price action will dynamically evolve in the same direction or soon reverse and pursue that reversed path. It may be an indication of a turning point or entry point to consider going long/short and should be use together with a background oscillator showing a prevailing local trend.

DH: True-Price DOTS for Heikin AshiTrue-Price DOTS for Heikin Ashi (open/close/current)
USE:
Must Set Tradingview Candle Type to Heikin Ashi.
Works on all Timeframes and symbols.
BENEFITS:
Helps keep you aware of the actual price action as you trade and historically by adding subtle DOTS and step-lines over your Heikin Ashi candles. With this indicator, you can benefit from the price averaging and smoothing effects of Heikin Ashi while benefiting from the accuracy of traditional candles and true active price levels. Helps maximize your buy and sell entries and exits.
HOW IT WORKS:
Adds true-price DOTS (showing current-price & close)
Adds STEP-LINE (showing true open) price level to Heikin Ashi candles.
DOTS will move & update on active candle with current price movement (as candle forms) . This is beneficial for accurate entry and exits during candle development period.
Option (on/off) to add current True-Price LINE (blue line) in input settings (recommended) .
NOTE:
You may need to right-click candles and arrange "visual order" so that DOTS are on top layer of chart. Otherwise some DOTS might hide behind candles.
ENJOY!
Dan Hollings
Master Crypto Grid Trader
Host of the "High Leverage Lounge"
Please Explore My Other Indicators, Scripts, Grids and Educational Ideas.
@DanHollings on Tradingview

NinaThis is for education purpose.
Nina provides opportunity to detect various peculiarities and patterns in price dynamics which are invisible to the naked eye.
It can be simultaneously used with xSuperTrend indicator. When both gives same signal, opportunity may be taken.

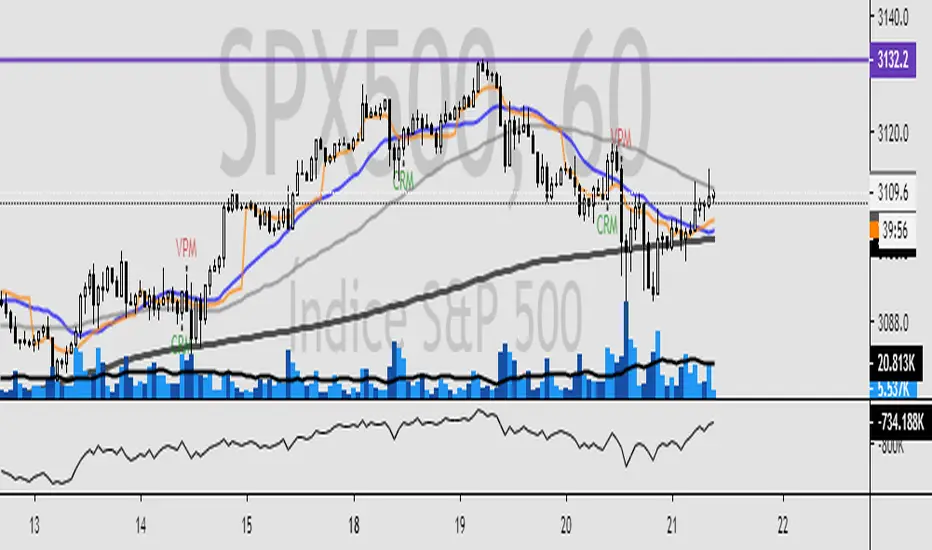
Trading Trend IndicatorEsse indicador plota na tela do ativo avaliado, pontos de compra e venda baseado em regras de tendência e confirmação por volume. Caso o ativo entre em tendência, o script plota na tela os dizeres "CPM" = Comprar na perda da máxima, ou seja comprar assim que o preço perder a máxima no próximo candle, e "VPM" = Vender na perda da mínima, assim que o preço perder a mínima no próximo candle. O indicador também avalia o volume, se o volume for 3x superior a média de 21 períodos, plota-se na tela "Vol. 3x" e se a barra de volume for 3x maior que a barra anterior, plota-se "3x" sobre o gráfico de volume.
Caso tenham interesse, solicitem o teste gratuito de 7 dias.
Description in english
This indicator plots on the screen of the evaluated asset, points of purchase and sale based on trend rules and confirmation by volume. If the asset is in trend, the script will display the words "CPM" = Buy at the loss of the maximum, ie to buy as soon as the price loses the maximum in the next candle, and "VPM" = Sell at the minimum loss, so that the price to lose the minimum in the next candle. The indicator also evaluates the volume, if the volume is 3x higher than the average of 21 periods, it is plotted in the "Vol 3x" screen and if the volume bar is 3x larger than the previous bar, it is plotted "3x" on the volume chart.
If you are interested, request a free 7-day trial.


High/Low Breaker v2Specify Candles back to determine if high/low has been broken. Can choose to either calculate with source of high/low or close.


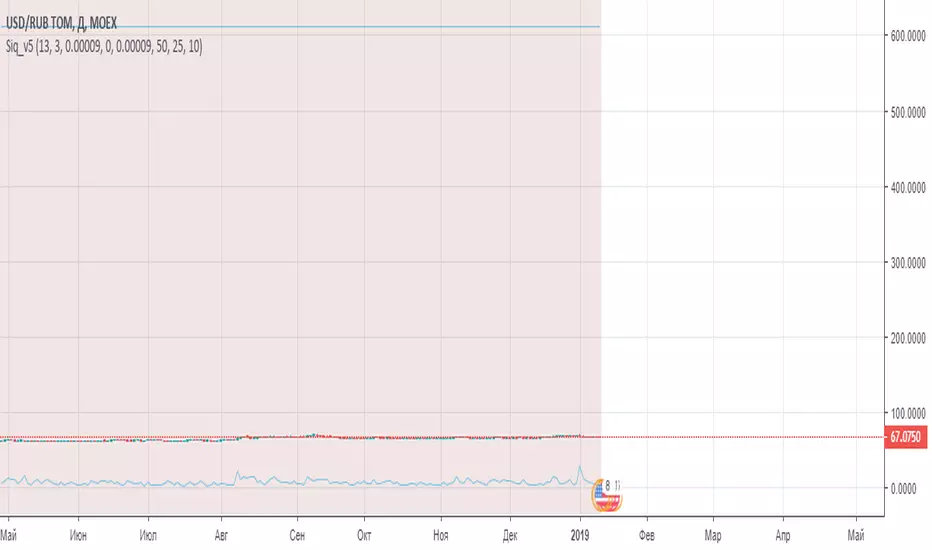
Siq_v5The DecisionPoint Price Momentum Oscillator ( PMO ) is an oscillator based on a Rate of Change calculation that is smoothed twice with custom exponential moving averages. Because the PMO is normalized, it can also be used as a relative strength tool.
PMO can be used in many ways:
- PMO can be used to determine the OB/OS state. While the +2.5 to -2.5 is the usual range for broad stock market indexes, each price index will have its own “signature” range. You may have to tune this for your instrument.
- PMO triggers buy/sell on signal crossovers and ZERO crossovers.
- Common patterns like BullKiss, BearKiss are useful to track. See the link below for more info.
- Divergences.
- Histo-only mode that can be used similar to MACD-Histo.
I have exposed all params as configurable. Have fun tuning :) Don't forget to share what you found for your instrument.