Probabilistic Analysis Table - The Quant ScienceProbabilistic Analysis Table - The Quant Science ™ is the quantitative table measuring the probability of price changes and quantifies the ratio of sessions for three different assets.
This table measures the ratios of bull and bear events and measures the probability of each event through data generated automatically by the algorithm.
The data are calculated for three different assets:
1. Main asset: set on the chart.
2. Second asset: set by user interface.
3. Third asset: set by the user interface.
The timeframe is set by the chart and is the same for all three assets. You can change the timeframes directly from the chart.
The user can add tickers and adjust the analysis period directly from the user interface. The user can edit the percentage changes and the values to be analyzed for each asset, directly from the user interface.
TABLE DESCRIPTION
1. Total global trade session: are the total number of bars for each asset.
2. Total positive trade session: are the number of positive bars for each asset.
3. Probability positive trade session: is the ratio of total sessions to positive sessions.
4. Total negative trade session: are the number of negative bars for each asset.
5. Probability negative trade session: is the ratio of total sessions to negative sessions.
6. Positive trade session 0.50%: are the number of positive bars greater than 0.50% for each asset.
7. Probability positive trade session 0.50%: is the ratio of total sessions to positive sessions with increases greater than 0.50% (this value is set by default, you can change it from the user interface).
8. Negative trade session -0.50%: are the number of negative bars smaller than -0.50% for each asset.
9. Probability negative trade session -0.50%: is the ratio of total sessions to negative sessions with declines less than -0.50% (this value is set by default, you can change it from the user interface).
10. Positive trade session 1%: are the number of positive bars greater than 1% for each asset.
11. Probability positive trade session 1%: is the ratio of total sessions to positive sessions with increases greater than 1% (this value is set by default, you can change it from the user interface).
12. Negative trade session -1%: are the number of negative bars less than -1% for each asset.
13. Probability negative trade session -1%: is the ratio of total sessions to negative sessions with declines less than -1% (this value is set by default, you can change it from the user interface).
This table was created for traders and quantitative investors who need to quickly analyze session ratios and probabilities.
Analysis

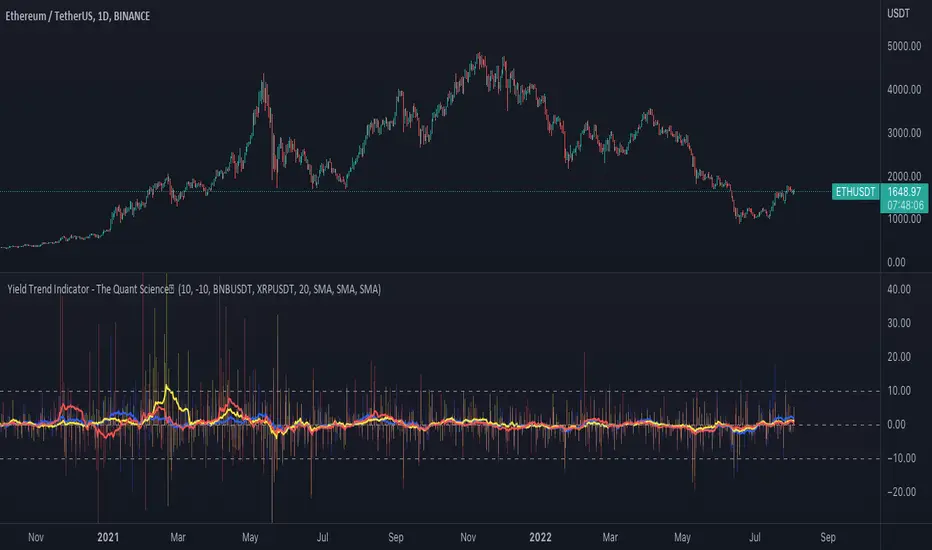
Yield Trend Indicator - The Quant ScienceYield Trend Indicator - The Quant Science™ is a quantitative indicator representing percentage yields and average percentage yields of three different assets.
Percentage yields are fundamental data for all quantitative analysts. This indicator was created to offer immediate calculations and represent them through an indicator consisting of lines and columns. The columns represent the percentage yield of the current timeframe, for each asset. The lines represent the average percentage yield, of the current timeframe, for each asset.
The user easily adds tickers from the user interface and the algorithm will automatically create the quantitative data of the chosen assets.
The blue refers to the main asset, the main set on the chart.
The yellow refers to the second asset, added by the user interface.
The red refers to the third asset, added by the user interface.
The timeframe is for all assets the one set to the chart, if you use a chart with timeframe D, all data is processed on this timeframe. You can use this indicator on all timeframes without any restrictions.
The user can change the type of formula for calculating the average yield easily via the user interface. This software includes the following formulas:
1. SMA (Simple Moving Average)
2. EMA (Exponential Moving Average)
3. WMA (Weighted Moving Average)
4. VWMA (Volume Weighted Moving Average)
The user can customize the indicator easily through the user interface, changing colours and many other parameters to represent the data on the chart.
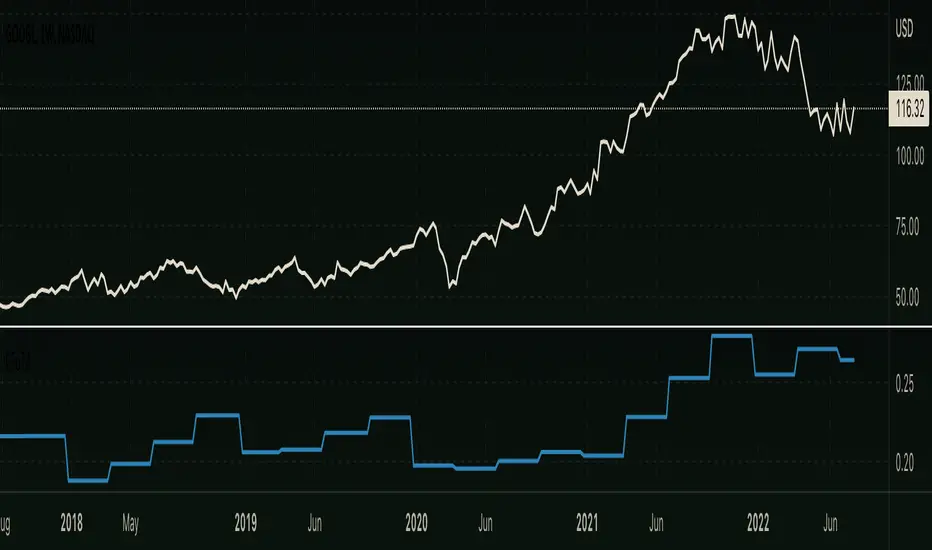
Inflation Adjusted Performance: Ticker/M2 money supplyPlots current ticker / M2 money supply, to give an idea of 'inflation adjusted performance'.
~In the above, see the last decade of bullish equities is not nearly as impressive as it seems when adjusted to account for the FED's money printing.
~Works on all timeframes/ assets; though M2 money supply is daily data release, so not meaningful to plot this on timeframe lower than daily.
~To display on same pane; comment-out line 6 and un-comment line 7; then save, remove and re-add indicator.
~Scale on the right is meaningless; this indicator is just to show/compare the shape of the charts.

Operating Cash Flow on Total Assets RatioThis indicator divides the company's Operating Cash Flow (TTM) by the company's Total Assets (FY). This ratio gives potential investors the amount of operating cash flow generated from every dollar of asset owned and is a measure of financial efficiency.
Strategy BackTest Display Statistics - TraderHalaiThis script was born out of my quest to be able to display strategy back test statistics on charts to allow for easier backtesting on devices that do not natively support backtest engine (such as mobile phones, when I am backtesting from away from my computer). There are already a few good ones on TradingView, but most / many are too complicated for my needs.
Found an excellent display backtest engine by 'The Art of Trading'. This script is a snippet of his hard work, with some very minor tweaks and changes. Much respect to the original author.
Full credit to the original author of this script. It can be found here: www.tradingview.com
I decided to modify the script by simplifying it down and make it easier to integrate into existing strategies, using simple copy and paste, by relying on existing tradingview strategy backtester inputs. I have also added 3 additional performance metrics:
- Max Run Up
- Average Win per trade
- Average Loss per trade
As this is a work in progress, I will look to add in more performance metrics in future, as I further develop this script.
Feel free to use this display panel in your scripts and strategies.
Thanks and enjoy :)

+ Multi-timeframe Multiple Moving Average LinesThis is a pretty simple script that plots lines for various moving averages (what I think are the most commonly used across all markets) of varying lengths of timeframes of the user's choosing. Timeframes range from 5 minutes up to one month, so regardless if you're a scalper or a swing trader there should be something here for you.
There are 8 lines (that can be turned on/off individually), which may seem like a lot, but if you use two averages and want to display four different timeframes for each, you can do that. The nice thing is that because the lines start plotting from the current bar they won't clutter up the screen. And obviously having moving averages from different timeframes on your chart makes price action more difficult to read (I mean sure, you can make them invisible, but who wants to do that all the time).
For each line there are two labels. One with the moving average type, and the other with its specific timeframe. I can't include the moving average length because it's not a string input. If anyone has a workaround for this, let me know, otherwise I would simply recommend setting different colors depending on the length, or if you only use one or two lengths and one or two moving averages this shouldn't be an issue. I had to use two labels because for the label text I couldn't include more than one string input, this is why there is an input for the 'moving average type label distance.'' You will want to adjust this depending on if you are trading crypto, futures, or forex because in some cases there may still be label overlap.
Pretty much everything else is self-explanatory.
I've added alerts. I might need to modify them if I can, because it would be nice for them to state the name and timeframe of the moving average. But I think this will do for now.
Enjoy!

Scot Signal IndicatorThe Scot Signal Indicator is intended as a Scalping Resource. It was designed to work best on the ❗❗ 5 MINUTE CHART with Bitcoin ❗❗ / USD & USDT pairs.
🟡🔼🔽 Yellow Triangles : these are pre-signals. If the triangle is Pointing Down, then look for a possible Short to come, and vice-versa for Upward facing triangles will go Long.
* Be careful, this is a Canary in the Coal Mine, but not the full signal. Going purely on the triangle as a signal could lead to fake-outs more frequently.
🟩 🟥 Green & Red Boxes : these are "Long" & "Short" signals where the indicator feels the time is safe to enter a trade.
❗ EXITING THE TRADE ❗ : this is a scalping indicator, specifically meant for entering trades, NOT EXITING them. An ideal scalp is $100 - $200 Bitcoin move. Though, we run bots using this indicator, taking scalps as little
as $60, performing up to 8 trades a day.

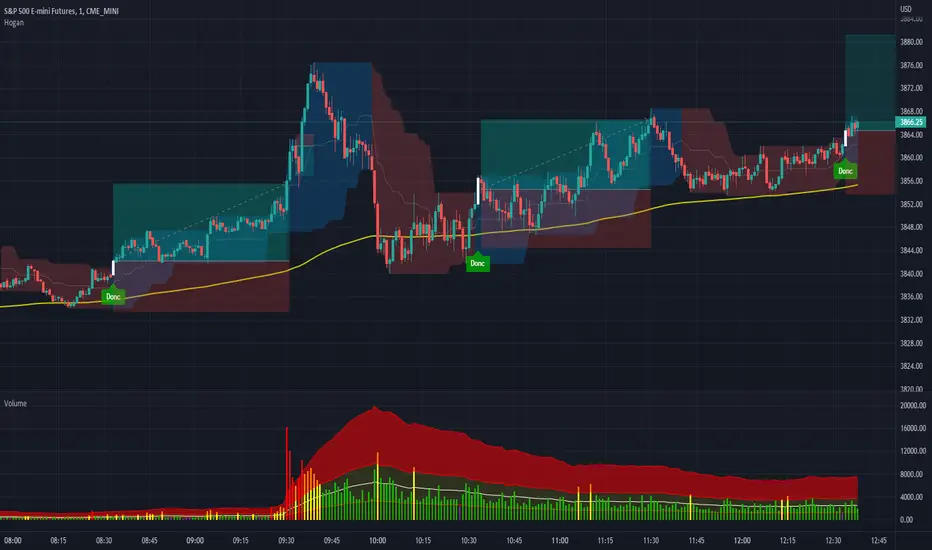
Volume Spread for VSA CustomHey everyone, I have been using volume a lot more lately as price action can sometimes get manipulated but volume shows us the truth!
Anyways, I have enjoyed the Volume Spread for VSA indicator but wished I had the code to change a few settings. This volume indicator includes spread analysis with the ability to customize input values and I'm making it open source so you can do with it as you please.
I have made notes all throughout the code to give suggestions on a few changes or why I have written it in such a way. I have also tried to section everything off to make it easier to see where each piece of the code is used. Overall I think it is a good example of how to code cleanly and how to add useful notes when you are learning Pine for yourself :D
The indicator on the price chart is my Donchian Channel indicator, which you can also find on my profile. This is the one I use every day.
Artharjan Market AnalysisHi,
I have created Artharjan Market Analysis dashboard to help traders to take complete view of the stocks of a particular sector or a benchmark index and track them simultaneously.
With this indicator dashboard, traders will be able to track 13 scripts simultaneously. This dashboard has following features and will help gain loads of valuable information during intraday as well as positional trading.
Information provided:
1] Traders will be able to track 13 scripts of their choice and get real time Buy/Sell Signals
2] Traders will be able to chose the timeframe of their choice by changing the setting called "Timeframe" OR keep the timeframe as that on the chart by keeping the Timeframe = "Chart".
3] Traders will be able to adjust the thickness of the Moving Averages Plotted on the Chart
4] Traders will be able to select the Table position and Table Text Size.
5] For volume analysis select a separate Lookback period for Daily/Weekly/Monthly timeframes and a separate Lookback period for Intraday timeframe. You may keep both same as per your choice.
6] Plot smoothed RSI (WMA of closing price used as an input for RSI) . Default smoothing used is 5. But if you dont want to use smoothing then set it to 1 and RAW RSI will be plotted.
7] For plotting RSI select a separate Lookback period for Daily/Weekly/Monthly timeframes and a separate Lookback period for Intraday timeframe. You may keep both same as per your choice.
8] For RSI set the Overbought and Oversold Levels of your choice.
9] Similarly user will be able to set its own timeframe for calculating Elders Force Index and Commodity Channel Index, and also set the Overbought and Oversold Levels of your choice.
10] Traders will have a choice to monitor Stock Price with reference to 3 Super Trend indicators based on 3 different parameters of their choice.
11] To calculate the Relative Strength and Moving Average High/Low Bands I have used the lookback period of 55 and used RMA instead of SMA or EMAs since I found that RMAs are more reliable than SMA or EMAs.
12] To measure the relative strength of a Stock w.r.t. a Benchmark Index or a Sectoral Index, user will have to select the RS - Comparative Symbol. This Comparative Symbol (Script) will be used to measure the relative strength of all the 13 scripts.
13] Kindly note that since this Dashboard will monitor 13 scripts simultaneously it will occupy huge space on the chart, hence I have made a provision to select the number of scripts to be shown on the dashboard minimum is 1 and max is 13.
14] With this indicator you will be able to monitor the price action and following indicators.
a) Last Traded Price
b) Price Change (Between Current candle and previous candle of the selected timeframe)
c) Price Change Percentage (Between Current candle and previous candle of the selected timeframe)
d) Volume Change (Between Current candle and previous candle of the selected timeframe)
e) Volume vs. SMA(Volume) with different color shaded ranging from -ve values to 100%, 100% to 200%, 200% to 500% and more than 500%
f) If Price is above VWAP then its a Buy else its a Sell signal
g) Signals based on RSI values and its corresponding relation with Overbought and Oversold Levels -such as Bullish, Bearish, Long Unwinding, Short Covering, Long Buildup, Short Buildup, Neutral levels
h) 3 Supertrend Indicators
i) Central Pivot Range (Calculated on a Daily Timeframe) - If LTP > CPR = Bullish, LTV < CPR = Bearish else Neutral
j) Elders Force Index - If EFI > 0 Buy if EFI < 0 Sell
k) Signals based on CCI values and its corresponding relation with Overbought and Oversold Levels -such as Bullish, Bearish, Long Unwinding, Short Covering, Long Buildup, Short Buildup, Neutral levels
l) Moving Average Envelop of 55 RMA calculated on Highs and Lows. If Low > Upperband = Bullish, if High < Lowerband = Bearish else Neutral
m) Relative Strength (RS). If RS of a Script in comparison to the Comparative Symbol is positive then it will shown in Green else it will be shown in Red color.
Kindly note that for Index scripts have got no volume so all indicators (Volume, SMA(Volume), VWAP and EFI) which require Volume as an Input parameter will be shown in Gray color because there is no volume data available to calculate these Indicator values and determine whether the Index is in Bullish Territory or in Bearish territory.
I hope you would enjoy using this indicator and it will act as a light house in your trading journey.
Warm regards
Rahul Desai
@Artharjan

Artharjan Volume AnalysisHi,
I have created Artharjan Volume Analysis indicator dashboard which gives following information about the volume to the traders.
It has two rows. The first row containing volume information is for the Daily Timeframe and the second row containing volume information for any other timeframe of your choice (Basically Chart timeframe)
It gives following information about volume to the traders.
1] Current Volume in Lakhs (Not in Millions) since this script was made keeping in mind Volumes of the Scripts traded in Indian Stock Exchanges. 1 Lakh = 1,00,000
2] Change from its previous Volume. If the change is positive it will be highlighted in Green else in Red.
3] 25 period SMA of the Volume (This period is a Long Term Moving Average and its a customizable parameter which can be changed in Indicator Settings)
4] Current Volume as a percentage of Long term SMA( Volume). If the percentage is positive it will be highlighted in Green else in Red.
5] High Volume during the Lookback period
6] Low Volume during the Lookback period
7] Is current Volume equal to Min Level or Max Level? Or its between Min Max Levels.
8] Is the current Volume rising over past 5 candles or is it falling over past 5 candles or its Swinging? (Short Term Period which is a customizable parameter and it can be changed in the Indicator Settings)
9] Current Volume as a percentage of Short term SMA( Volume). If the percentage is positive it will be highlighted in Green else in Red.
The 1st row will be shown only when the Chart Timeframe is a Daily Timeframe.
The 1st and the 2nd row will be shown only when the Chart Timeframe is not a Daily Timeframe.
With this information regarding volume, traders can identify whether the current volume is at its Highest Levels or at its Lowest Levels, can identify whether volume is rising or volume is falling in accordance to the price action and then take trading decisions.
I hope you would enjoy using this indicator in your day to day trading journey.
Regards
Rahul Desai
@Artharjan.

BTC Active Address Momentum (On-chain)This indicator shows the difference between the % change in BTC price and the % change in BTC’s active addresses (BTC’s utility value).
- Dark red: Extreme overbought conditions
BTC price is increasing too fast and outgrows the increase in its utility value
(RSI of % change difference > 70)
- Light red: Overbought conditions
BTC price is increasing too fast and outgrows the increase in its utility value
(RSI of % change difference > 60)
- Dark green: Extreme oversold conditions
BTC price is dropping too fast and outruns the decrease in its utility value
(RSI of % change difference < 30)
- Light green: Oversold conditions
BTC price is dropping too fast and outruns the decrease in its utility value
(RSI of % change difference < 40)
*Not financial advice.

BTC Active Address Trend (On-chain)This indicator compares the % change in BTC price and the % change in BTC’s active addresses (BTC’s utility value).
1. % changes in BTC price & active addresses
- Orange line: BTC’s price change (%)
- Gray line: BTC’s active address change (%)
- Red/Yellow/Green lines: Bollinger bands for change in active address
2. Trend:
- Green circles: Bullish Sentiment Trend
Market sentiment is bullish and BTC price outgrows the increase in its utility value (overpricing)
- Red circles: Bearish Sentiment Trend
Market sentiment is bearish and BTC price drops more than the decrease in its utility value (underpricing)
3. Potential Re-Entries:
- Green/Red triangles: potential bullish/bearish entries
When % change of BTC price gets similar to that of active addresses
*Not financial advice.


Trend IdentifierTrend Identifier for 1D BTC.USD
It smoothens a closely following moving average into a polynomial like plot.
And assumes 4 stage cycles based on the first and second derivatives.
Green: Bull / Exponential Rise
Yellow: Distribution
Red: Bear / Exponential Drop
Blue: Accumulation
Red --> Blue --> Green: indicates the start of a bull market
Green --> Yellow --> Red: indicates the start of a bear market
Green --> Yellow: Start of a distribution phase, take profits
Red --> Blue: Start of a accumulation phase, DCA

Bitcoin OnChain & Other MetricsHi all,
In these troubled times, going back to fundamentals can sometimes be a good idea 😊
I put this one up using data retrieved from “Nasdaq Data Link” and their “Blockchain.com” database.
Here is a good place to analyses some Bitcoin data “outside” its price action with 25 different data sets.
Just go to the settings menu and display the ones you are interested in.
If you want me to add more metrics, feel free to DM or comment below!
Hope you enjoy 😉

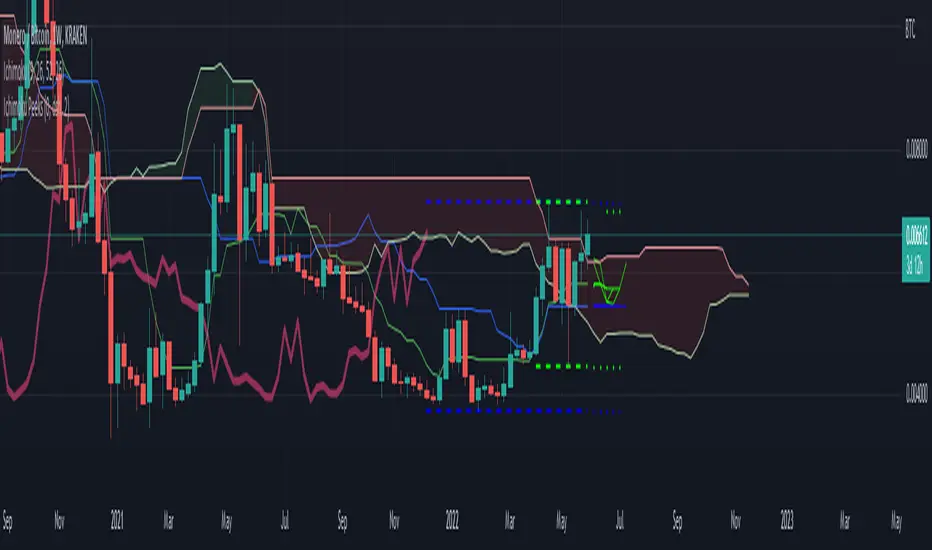
Ichimoku PeeksThis indicator uses the Ichimoku Tenkan / Kijun trend line formulas to predict what those values will be in the future if current price action does not violate the period highs and lows.
Because of the way Ichimoku formulates the trend, it contains (but does not visualize) this predictive information in a way that moving averages do not.
Sharp chart readers can infer upcoming changes by counting back candles, but the process can be automated, as I've shown here.
This description does not seem to be editable so implementation details and usage will be covered in code commentary.
MACD Scalper AnalysisThis is a scalper analysis movement designed around MACD and 200 EMA
The rules are simple:
For long we check if the close of the candle is above the ema200 and we have a crossover between macd and signal
Once this happens we analyse the next candle, if its close higher than open , we can consider it a win and if its close lower than open we consider a lose.
For short we check if the close of the candle is below the ema200 and we have a crossunder between macd and signal
Once this happens we analyse the next candle, if its close higher than open , we can consider it a loss and if its close lower than open we consider a win.
Once we have all of this we analyse the average percentage movement and establish if the specific asset or timeframe is worthy for us.
At the same time it can give a good idea if we can go with a divergence strategy, like for example we have a short entry, but we will actually go long and viceversa.
If you have any questions let me know !

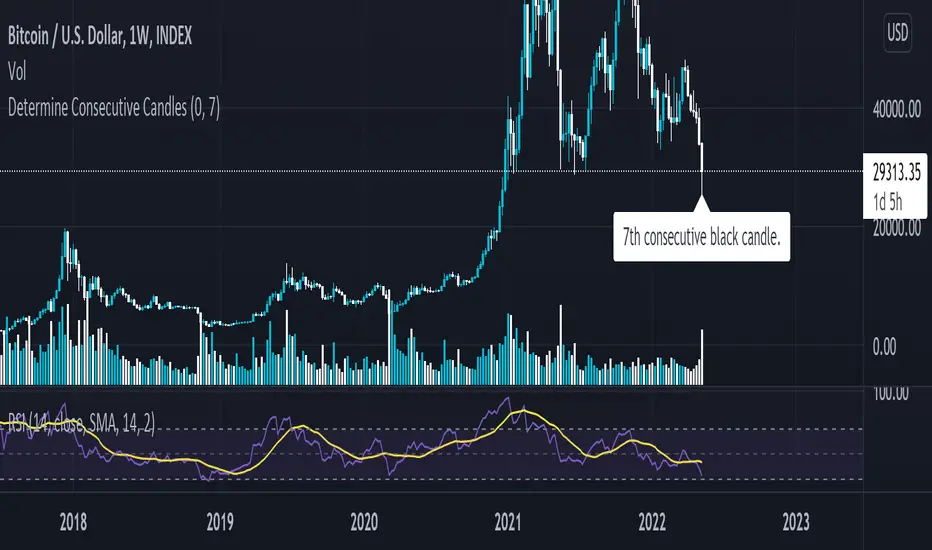
Determine Consecutive Candles█ OVERVIEW
This is a simple script that will plot labels over or under candles to show where there had been consecutive candles that closed in a similar fashion. This script was inspired by a Tweet about Bitcoin experiencing its first 7th-consecutive weekly black candle and I sought out to test that.
█ INPUTS
There are three inputs for this script.
"offset" ( integer ) - (Can be 0 or 1) Allows the user to apply this script at the currently closing candle or the most recently closed candle.
"Number of Candles" ( integer ) - (From 3 to 100*) Allows the user to select how many candles to back test for consecutive-ness.
"Black or White" ( boolean ) - Allows the user to select what kinds of candles to look for in this script. (true - Black , false - White ).
*Publishing open-sourced, this selection was arbitrary and can be modified at will.
█ USAGE
Because I had created this in a little over an hour, this is just a simple experiment that I wanted to share with others. Its applications are unknown to me, but I am interested in hearing how others may find what this script does useful.
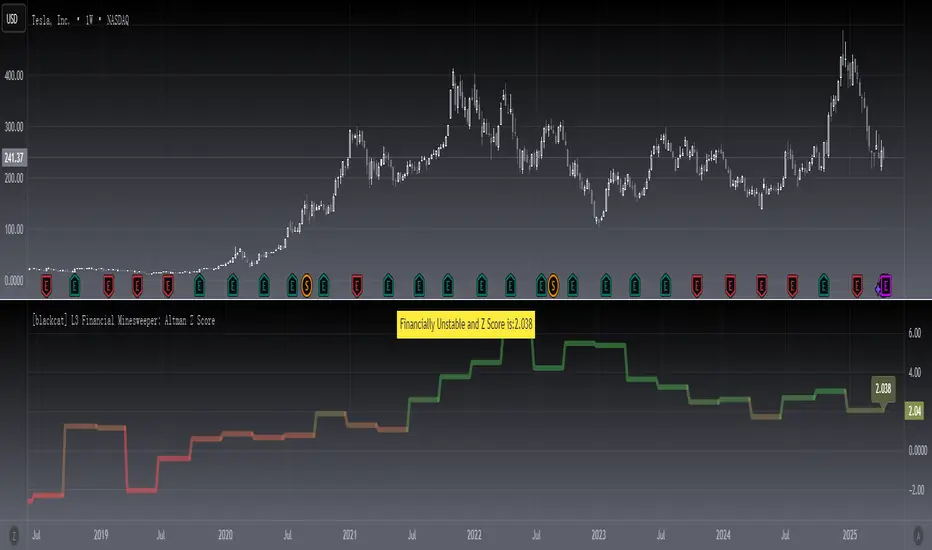
[blackcat] L3 Financial Minesweeper: Altman Z ScoreLevel: 3
Background
The Altman Z-score is the output of a credit-strength test that gauges a publicly traded manufacturing company's likelihood of bankruptcy. The Altman Z-score is a formula for determining whether a company, notably in the manufacturing space, is headed for bankruptcy.
Function
The possibility of financial failure or bankruptcy of the enterprise is analyzed and predicted through the comprehensive score. The lower the Z value, the more likely the enterprise will go bankrupt. By calculating the Z value of an enterprise for several consecutive years, we can find out whether the enterprise has signs of financial crisis. Generally speaking, when the Z value is greater than 2.675, it indicates that the financial situation of the enterprise is good, and the possibility of bankruptcy is small; When the value is less than 1.81, it indicates that the enterprise is in a potential bankruptcy crisis; when the Z value is between 1.81 and 2.675, it is called a "gray area, indicating that the financial situation of the enterprise is extremely unstable.
Remarks
STOCKs ONLY which require financial data.
X1~X5 coefficients can be customized for different stock markets.
Compared to TradingView official Altman Z-Score Indicator.
Feedbacks are appreciated.
Financial Fundamental Analysis (FFA)- Finansal Temel Analiz (TA)The main purpose of the Fundamental Analysis (TA) indicator; It is to determine whether the rising or falling movements in prices are supported by basic indicators. TA can be used in equity markets. With the financial data transferred to the platform by the companies, the development rates, intrinsic values, true values and expensiveness-cheapness situations of the stocks are estimated. In addition to technical data, it provides an impression of the long-term performance of the stock.
Growth Rate (Blue line): It is a percentage data calculated by focusing on companies' periodic net margin, operating margin and return on equity. It is expected to be higher than 0.2. It symbolizes the possibility of holding and returning cash. It is one of the indicators that the development of the company will be negative or positive in the following periods.
Earnings Per Share (Purple line): It is an important indicator of the sustainability of the company. The periodic increase is expected to be above the inflation figures.
Stock true price (Gray line): Data calculated based on the growth rate. Known book value is recalculated by reflecting the effect of growth rate on earnings per share. In a sense, revaluation is done.
Intrinsic value 1 (red line): It is determined by reevaluating the current price with the growth rate. Whether the value here is too high or too low than the stock price is related to the interest of the sector in which the stock is located.
Intrinsic value 2 (green line): The 50-day average price is determined by reassessing with the growth rate. Whether the value here is too high or too low than the stock price is related to the interest of the sector in which the stock is located.
The desired performance is to remain above 0.2, periodic earnings per share to increase above the inflation rate, and to have a regular increase graph without fluctuations in the stock true price. The fact that intrinsic value 1 crosses intrinsic value 2 is also an increase indicator and acts as an oscillator.
Sudden increases in the stock true price indicate that the stock price will increase in the coming periods. However, the current price of the stock should also be examined with technical indicators.
Temel Analiz (TA) indikatörünün temel amacı; fiyatlardaki yükseliş ya da düşüş hareketlerinin temel göstergelerle desteklenip desteklenmediğinin tespit edilmesidir. TA, hisse pay piyasalarında kullanılabilmektedir. Şirketler tarafından platforma aktarılan finansal veriler ile hisselerin gelişim oranları, içsel değerleri, gerçek ederi ve pahalılık-ucuzluk durumları tahmin edilmektedir. Teknik verilere ek olarak hissenin uzun vadede gösterdiği performansa ilişkin izlenim sunmaktadır.
Büyüme Oranı (Mavi çizgi): şirketlerin dönemsel net marjı, faaliyet marjı ve özkaynak karlılığı üzerine odaklanarak hesaplanmış yüzdesel bir veridir. 0.2’den yüksek olması beklenir. Nakit bulundurma ve döndürme imkânını simgelemektedir. Sonraki dönemlerde şirketin gelişiminin negatif ya da pozitif olacağının göstergelerinden biridir.
Hisse Başı Kazanç (Mor çizgi): Şirketin sürdürülebilirliği hakkında önemli bir göstergedir. Dönemsel artışın enflasyon rakamları üzerinde olması beklenir.
Hisse eder fiyatı (Gri çizgi): Gelişim oranına bağlı olarak hesaplanan veridir. Bilinen defter değeri, gelişim oranının hisse başı kazanç üzerine etkisi yansıtılarak tekrar hesaplanmaktadır. Bir anlamda yeniden değerleme işlemi yapılmaktadır.
İçsel değer 1 (kırmızı çizgi): Mevcut fiyatın gelişim oranı ile tekrar değerleme yöntemiyle belirlenmesidir. Buradaki değerin hisse eder fiyatından aşırı yüksek ya da aşırı düşük olması hissenin bulunduğu sektörün çektiği ilgi ile alakalıdır.
İçsel değer 2 (yeşil çizgi): 50 günlük ortalama fiyatın gelişim oranı ile tekrar değerleme yöntemiyle belirlenmesidir. Buradaki değerin hisse eder fiyatından aşırı yüksek ya da aşırı düşük olması hissenin bulunduğu sektörün çektiği ilgi ile alakalıdır.
Gelişim oranının 0.2 üzerinde kalması, dönemsel hisse başı kazancın enflasyon oranı üzerinde artış göstermesi, hisse eder fiyatın dalgalanmalar göstermeden düzenli bir artış grafiğine sahip olması istenen performanstır. İçsel değer 1‘in içsel değer 2’yi yukarı kesmesi aynı zamanda bir artış göstergesi olup osilatör görevi görmektedir.
Hisse eder fiyatındaki ani yükselişler gelecek dönemlerde hisse fiyatının da artacağını göstergesi olmaktadır. Ancak hissenin mevcut fiyatı aynı zamanda teknik göstergelerle de incelenmelidir.

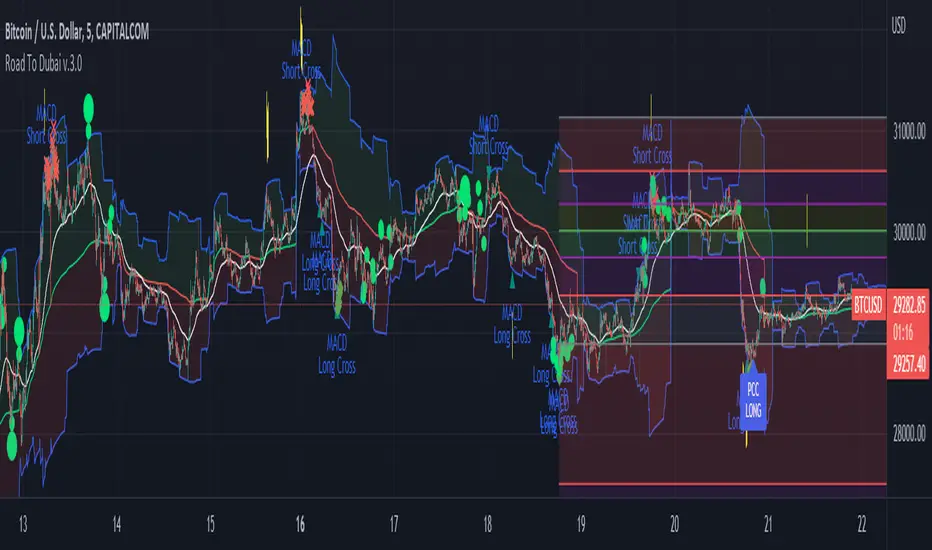
Road To Dubai v.2.99.4ROAD TO DUBAI 2.99.4
Usueful for daily trading over all type of asset, from Stock to Crypto, Forex and Commodities. It works best with 5min to 1hr graphs, if you are a intraday trader.
This is not a simple mashup of indicators, because you can add them as your own.
This script is more like a tool to understand price action based on indicators position. Thanks to cross call based on MACD, RSI with EMA applied and few index realtime mapping, this tool will let you reduce time effort for graph analysis.
As extra feature it will let you to try different strategies all fully customizable.
I've tried my best to keep it readble, and easy to use.
STANDARD FEATURES
VWAP : Green/Red line. It will reset everyday at 00.00.
EMA80 : White Line
BLUELINES : Positive and negative overextend value from VWap. This is based on a range of bar and it will extend on the opposite side the lower or higher candle. Useful for understading where price can arrive, expecially if a spike will appear.
Those indicators are quite useful for understading trends, price positions and maximum price range.
RSI EMA10 OVERBOUGHT / OVERSOLD
Yellow arrow marks where RSI arrived at his Top or Bottom. If on different timeframes (5min, 30min and 60min) something similar happen area is filled with Red or Green.
This is base on EMA10 applied to RSI (I usually refer at it as Yellow Line on my indicator HighFreq Trader)
To find good values please try High Freq Trader 1.3
RSI EMA80 CALL
Red Cross or Green Square advice for a really potential inversion of trend. When a Silver bar appear, this means the same call was triggered on different Timeframe in the sametime.
This is based on EMA80 applied to RSI (I usually refer at it as Blue Line on my indicator HighFreq Trader).
To find good values please try High Freq Trader 1.3
MACD CALL
Based on MACD with standard settings. When triggered, a lime Triangle appears. Differents size based on timeframe (5min smaller, 60min bigger). If the same call is triggered on the same place a Lime Bar appear on the opposite side of trend (this is a graphical contents, bacause with all enabled, standard use, can be difficult to read signals).
In Menu Settings you will be able to set your best parameter for your asset.
MACD FIBONACCI EXTRA FEATURE
If you want you can enable a Fibonacci draw based on MACD. This works at his best (on my opinion) with 30min MACD
EXAMPLE
NATURAL GAS
In this chart 30min you can see all calls triggered for a Short. Yellow RSI Arrow, Red Cross, Macd Triangle and Colored Red, Lime and Silver Bars are all calling for Short.
In this way you can see in notime if this can be a perfect moment for take position
ORDER PLANNER
This feature will help you to understand a better way to place order, where Stop Loss and Take Profit could be place. It can be manual or Automatic (based on price position if above or below VWap)
VIX VXN DXY CALLS
If VIX, VXN is triggered a small Green Dot will appear. If both are in the same time a bigger Dot appear. Very useful to find trend inversion.
If DXY is triggered a Red Dot will appear (only on Daily Chart). Very Useful to understand trend inversion on whole market.
VOLUMES REMINDERS
Find if there was an High Volume traded (HV) or Low Volume Traded (LV) in the near past. Useful to understand if some tricky situation could happen (like a sudden sell, an accumulation or distribution)
Volatility Calculator for Daily Top and Bottom RangeWith the usage of ATR, applied on the close of the daily candle, I am calculated the volatility channels for the TOP and BOTTOM
Based on this logic, we can estimate, with a huge confidence factor, where the prices are going to be compressed for the trading day.
Having said that, lets take a look at the data gathered among the most important financial markets:
SPX
TOP CROSSES : 2116
BOT CROSSES : 1954
Total Daily Candles : 18908
Occurance ratio = 0.215
NDX
TOP CROSSES : 1212
BOT CROSSES : 1183
Total Daily Candles : 9386
Occurance ratio = 0.255
DIA
TOP CROSSES : 759
BOT CROSSES : 769
Total Daily Candles : 6109
Occurance ratio = 0.25
DXY
TOP CROSSES : 1597
BOT CROSSES : 1598
Total Daily Candles : 13156
Occurance ratio = 0.243
DAX
TOP CROSSES : 1878
BOT CROSSES : 1848
Total Daily Candles : 13155
Occurance ratio = 0.283
BTC USD
TOP CROSSES : 416
BOT CROSSES : 417
Total Daily Candles : 4290
Occurance ratio = 0.194
ETH USD
TOP CROSSES : 247
BOT CROSSES : 268
Total Daily Candles : 2452
Occurance ratio = 0.21
EUR USD
TOP CROSSES : 820
BOT CROSSES : 805
Total Daily Candles : 7489
Occurance ratio = 0.217
GOLD
TOP CROSSES : 1722
BOT CROSSES : 1569
Total Daily Candles : 13747
Occurance ratio = 0.239
USOIL
TOP CROSSES : 1077
BOT CROSSES : 1089
Total Daily Candles : 10231
Occurance ratio = 0.212
US 10Y
TOP CROSSES : 1302
BOT CROSSES : 1365
Total Daily Candles : 9075
Occurance ratio = 0.294
Based on this, we can assume with a very high confidence ( 70-80%) that the market is going to stay, within the range created from the BOT and TOP ATR points.

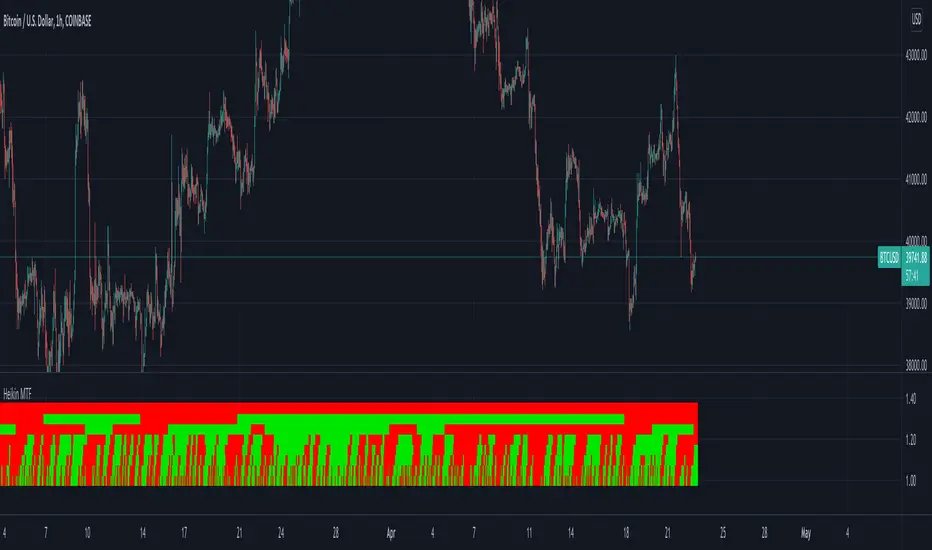
Heikin Multi Time Frame// How it Works \\
This script calculates the open and close prices of Heikin Ashi candles across multiple timeframes,
If the candle formed on that timeframe is green it will display in the table a green square, If the candle is red, the square will display red.
// Settings \\
You can change the colours of the plots
You can also Change any of the timeframes which the Heikin Ashi candles are being calculated on
// Use Case \\
Heikin Ashi candles are often used to give a smoother trend direction and help cancel out some of the noice/consolidation.
It can also be use as trend detection for multiple timeframes at once
/ / Suggestions \\
Happy for anyone to make any suggestions on changes which could improve the script,
// Terms \\
Feel free to use the script, If you do use the scrip please just tag me as I am interested to see how people are using it. Good Luck!