CSP Institutional Filter PRO This indicator evaluates whether a ticker qualifies for a high-probability Cash-Secured Put (CSP) based on an institutional options-selling framework. It checks RSI, momentum, support levels, ATR-based risk, IVR, DTE, and earnings timing to determine if the setup meets either the Standard CSP Module (30–45 DTE) or the Pre-Earnings CSP Module (7–21 days before earnings). The script visually marks valid setups, highlights risk zones, and provides an on-chart diagnostic summary.
带和通道

Ichimoku Green BG by Pranojit DeyThis indicator shows ichimoku bulliush trend background so that the option buyers can understand bullish trend easily.

PIVOT AND ICHIMOKU BACKGROUND BY PRANOJIT DEYIt shows pivot bias in relation to day open line and it also shows ichimoku bullish trend background. good for option buyers to understand market bias.

Key Levels by Romulus V2This is the updated key levels script I added dynamic levels that change throughout the day opening range high and low and customizable settings to adjust.

Keltner Channels - signal providerThis enhanced channel for pro traders visually indicates enhanced entry or exit signal based on the position of the underlying within the channel. Remember: EVERY TREND HAS ITS RETRACEMENTS - with this indicator you will avoid entering in full uptrend (bearing more downside risk than upside) or exiting (shorting) at max downtrend.
To be used together with the trend on higher timeframes (especially for the interpretation of the baseline)
Upper part = potential sell signal (especially in overall downtrends)
Lower part = potential buy signal (especially in overall uptrends)
Basis = potential buy signal (especially in strong uptrends)
= potential sell signal (especially in overall downtrends)

outin/ocn ahihiDonchian (volatility breakout)
BBMA (trend confirmation)
Ichimoku concept (cloud + alignment)
Multi-timeframe confluence
= SUPER HYBRID SYSTEM 🔥🐉💎

Dual Donchian Channels- LockwoodDescription
This indicator plots two Donchian Channels on the same chart, each using a different user-defined lookback period. A Donchian Channel shows the highest high and lowest low over a selected number of bars, helping identify breakouts, volatility, and trend conditions.
Features
Two independent Donchian Channels
Customizable lookback periods and colors
Upper, middle, and lower lines for each channel
Channels automatically adjust and stay anchored to price levels when the chart is scaled or moved
Useful for identifying volatility contractions, trend breakouts, and support/resistance zones

Long-Term Strategy: 1-Year Breakout + 6-Month ExitDescripción (Description): (Copia y pega todo lo que está dentro del recuadro de abajo)
Description
This is a long-term trend-following strategy designed to capture major market moves while filtering out short-term noise. It is based on the classic principle of "buying strength" (Breakouts) and allowing profits to run, while cutting losses when the medium-term trend reverses.
How it Works (Logic)
1. Entry Condition (Long Only): The strategy looks for a significant display of strength. It enters a Long position only when two conditions are met simultaneously:
Price Breakout: The closing price exceeds the highest high of the last 252 trading days (approximately 1 year). This ensures we are entering during a strong momentum phase.
Trend Filter: The SuperTrend indicator (Settings: ATR 10, Factor 3.0) must be bullish. This acts as a confirmation filter to avoid false breakouts in choppy markets.
2. Exit Condition: The strategy uses a trailing stop based on price action, not a fixed percentage.
It closes the position when the price closes below the lowest low of the last 126 trading days (approximately 6 months).
This wide exit allows the trade to "breathe" during normal market corrections without exiting the position prematurely.
Settings & Risk Management
Capital Usage: The script is configured to use 10% of equity per trade to reflect realistic risk management (compounding).
Commissions: Included at 0.1% to simulate real trading costs.
Slippage: Included (3 ticks) to account for market execution variability.
Best Use: This strategy is intended for higher timeframes (Daily or Weekly) on trending assets like Indices, Crypto, or Commodities.

Volume Weighted Average Price - 6 band by buckstrdrstandard VWAP improved to allow 6 bands as standard

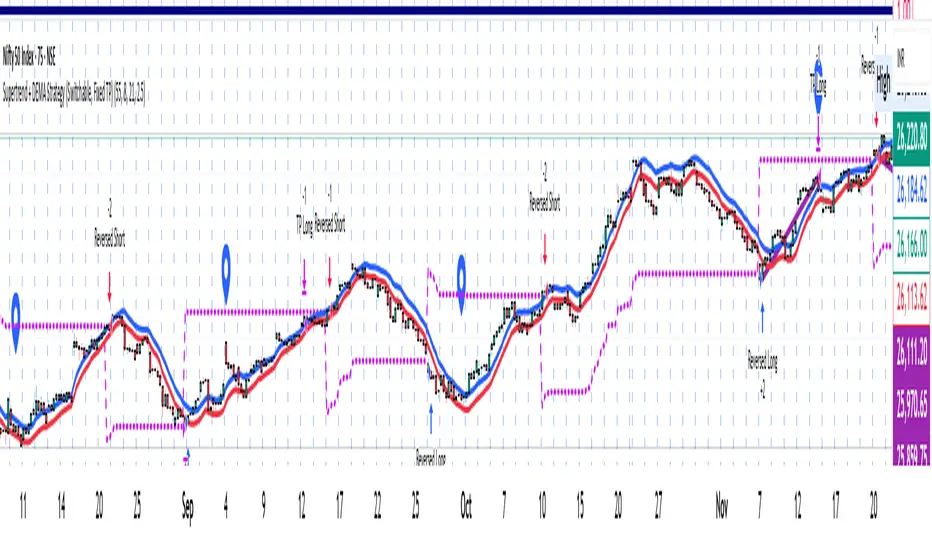
Supertrend + DEMA Strategy ( customised & Switchable, Fixed TP)Supertrend line – a moving line that follows the price and shows whether the market is trending up or down.
If the price goes above this line, it usually means the market is going up.
If the price goes below, it usually means the market is going down.
DEMA (Double Exponential Moving Average) – another line that smooths out price movements to spot trends more clearly.
It calculates an average of prices but reacts faster than a normal moving average.
Support Resistance📌 1. Indicator Name
Premium Auto Support & Resistance
📌 2. One-Line Description
An automated S/R system that generates support and resistance zones based on swing highs and lows, displaying them in a premium visual style directly on the chart.
📌 3. Overall Summary (7+ lines)
This indicator automatically detects price levels where the market has repeatedly reacted and generates support and resistance zones.
Instead of simple horizontal lines, it visualizes reaction ranges as zones, helping traders clearly understand the actual price areas where activity occurs.
It uses swing points (high/low pivots) as the fundamental basis and continuously updates only the most meaningful recent S/R levels.
A smoothing process is applied, reducing noise and creating more natural, reliable S/R zones.
Support and resistance are displayed as filled transparency-based zones, enabling intuitive identification of zone strength and market position.
When price touches one of these zones, a small signal appears to highlight potential reversal points.
All elements are plotted directly over the candles with overlay=true, making it an instantly usable and visually premium tool.
📌 4. Advantages (6 items)
① Automatic Swing-Based S/R Detection
Automatically analyzes key pivot points and extracts only the most meaningful support and resistance levels.
② Support/Resistance Zone Structure
Provides intuitive reaction ranges instead of single lines, making it far more practical for real trading.
③ Smooth Premium-Style Lines
S/R lines are smoothed to remove noise, maintaining a natural and refined premium visual appearance.
④ Automatic Candle-Touch Alerts
Displays signals whenever price touches support or resistance, helping you quickly identify potential reversal areas.
⑤ Overlay-Based Immediate Clarity
Drawn directly onto the chart without occupying indicator windows, keeping visual focus on price action.
⑥ Simple Yet Powerful Framework
A pivot + smoothing + zone combination that strengthens automatic S/R detection while remaining easy for beginners to use.

Filter Trend1. Indicator Name
Premium EMA Ribbon Filter (Pro Version)
(Advanced Trend & Momentum Filtering System Based on EMA Ribbons)
2. One-Line Introduction
A professional trend-analysis indicator that blends an advanced noise-filtering algorithm with an EMA ribbon system to extract only the pure bullish/bearish trend while smoothing out market noise.
3. Overall Description (7+ lines)
The Premium EMA Ribbon Filter is more than just a set of EMAs.
It analyzes the structure of a fast, medium, and slow EMA ribbon—along with the spacing and alignment between them—to determine whether the market is in a bullish trend, bearish trend, or a neutral/noise-heavy zone.
The core of this indicator is its noise-reduction algorithm and trend-strength calculation system.
Instead of relying on simple EMA cross signals, it evaluates how consistently the ribbon maintains bullish/bearish alignment over a specified period and highlights only strong trends with color coding, while weak or noisy areas are displayed in gray.
This helps traders avoid confusing or false signals and clearly focus only on the “meaningful zones.”
A Triple-Smoothing System is applied to create smoother, more refined ribbon movements, forming a stable “premium trend curve” that is less affected by short-term volatility.
As a result, this indicator works effectively for scalping, swing trading, and long-term trend following—staying true to the principle of removing noise and highlighting only the core market flow.
4. Short Advantages (6 items)
① Complete Noise Filtering
Using EMA ribbon comparison + tolerance logic, false reversals are largely eliminated, leaving only stable trend phases.
② Highly Readable Color System
Bullish trends are mint, bearish trends are red, and neutral/noise zones are gray—instantly visualizing market conditions.
③ Trend Strength Visualization
Not only trend direction but also trend strength is displayed via dynamic color transparency.
④ Smooth, Premium-Style Ribbon Design
Triple-smoothing creates a refined, luxury-level smoothness in movement.
⑤ Works Across All Timeframes
From 1-minute scalping to daily/weekly macro trend analysis.
⑥ Excellent Real-Trading Compatibility
Works extremely well when combined with ATR, SuperTrend, and volume-based indicators.
Indicator Manual (Required Section)
📌 Understanding the Core Concept
The indicator uses three EMAs (e.g., 20/50/100) arranged as a ribbon to analyze the structural alignment of the trend.
When the EMAs are cleanly aligned Top → Middle → Bottom, the market is in a bullish trend.
When aligned Bottom → Middle → Top, the market is in a bearish trend.
The indicator further evaluates the ribbon spread (gap) and the consistency of alignment to compute trend strength.
Noisy market conditions are shaded gray to clearly indicate “uncertain/indecisive” zones.
⚙️ Settings Description
Option Description
Fast EMA Most sensitive EMA; detects early trend signals
Mid EMA Stabilizes the primary trend direction
Slow EMA Defines the broader, long-term trend flow
Trend Lookback The period used to analyze trend strength
Noise Tolerance (%) Higher values = stronger noise removal
Smoothing Steps Controls how smooth the ribbon becomes
📈 Example Recognition
A bullish continuation/entry scenario forms when:
EMAs align in the order Fast → Mid → Slow (top side)
Ribbon color shifts into mint (strong bullish trend)
The ribbon begins to expand while price stays above the ribbon
📉 Example Recognition
A bearish continuation/entry occurs when:
EMAs align Fast → Mid → Slow (bottom side)
Ribbon color remains red
After contracting, the ribbon expands again during renewed downside strength
🧪 Recommended Usage
Combine with volume-based indicators (OBV, Volume Profile) → enhanced strong-trend detection
Use with SuperTrend or ATR Stop → clearer stop-loss placement
Combine with RSI/Stoch → avoid counter-trend entries in overheated conditions
Higher leverage traders should use higher tolerance settings
🔒 Cautions
EMA ribbons are trend-following tools; signals may weaken in ranging/sideways markets.
Never rely solely on this indicator—always confirm with volume, price patterns, or structure.
Very low Lookback values may cause excessive re-entry signals.
In high-volatility environments, ribbon spacing can contract/expand rapidly—use with caution.

Trigonum ChannelThis custom indicator was created in order to analyse market movements basing on several basic methods of technical analysis

QLC v8.4 – GIBAUUM BEAST + ANTI-FAKEOUTQLC v8.4 – GIBAUUM BEAST + ANTI-FAKEOUT
QLC v8.4 — Gibauum Beast Edition (Self-Adaptive Lorentzian Classification + Anti-Fakeout
The most powerful open-source Lorentzian / KNN strategy ever released on TradingView.
Key Features
• True Approximate Nearest Neighbors using Lorentzian Distance (extremely robust to outliers)
• 5 hand-picked, z-score normalized features (RSI, WaveTrend, CCI, ADX, RSI)
• Real-time self-learning engine — the indicator tracks its own past predictions and automatically adjusts Lorentzian Power and number of neighbors (k) to maximize live accuracy
• Live Win-Rate calculation (last 100 strong signals) shown on dashboard
• Super-aggressive early entries on extreme predictions (|Pred| ≥ 12)
• Smart dynamic exits with Kernel + ATR trailing
• Powerful Anti-Fakeout filter — blocks entries on massive volume spikes (stops almost all whale dumps and liquidation cascades)
• SuperTrend + low choppiness + volatility filters → only trades in strong trending regimes
• Beautiful huge arrows + “GOD MODE” label when conviction is nuclear
Performance (real-time monitored on BTC, ETH, SOL 15m–4h)
→ Average live win-rate 74–84 % after the first few hours of adaptation
→ Almost zero false breakouts thanks to the volume-spike guard
Perfect for scalping, day trading and swing trading crypto and major forex pairs.
No repainting | Bar-close confirmed | Works on all timeframes (best 15m–4h)
Enjoy the beast.

Previous Day • Week • Month High/Low (Customizable)Simple Previous Day, Week and Month Levels. Customisable as well.

SPY - VPIN [VWAP] - 195min/DailyVolume Synchronized Probability of INformed Trading (VPIN) modified with VWAP and extended to be applicable to higher timeframes (195min/daily).
The buy/sell signal theoretically based on the informed decisions of smart money. For individual stocks, there is too much noise as a large fund liquidating can create false signals on the longer timeframe.
Recommend to use on SPY to follow the movement of macro-based institutional funds. A sell signal here could mean, and this "could" is doing a lot of heavy lifting, a consensus among big players of impending systematic risk, and vice versa for buy signal. Institutions could be selling for whatever reason, and they usually sell over large periods. Also remember that this doesn't include dark pool data so it is half-baked.
Signal basically showing when smart money smarts to buy during crash, or starts to sell during melt-up phase.
This is not a complete buy/sell signal, it ONLY tries to show signals from the movement of large players so no red signal does not mean there isn't systematic risk and no green signal does not mean there is systematic risk. Combine this with other indicators.
***Remember that institutions also could be retarded, and their "informed" decision might just be them acting like a retard***
Best used on SPY on 195min timeframe. Use this signal on SPY on 195min timeframe to buy/sell high beta stocks indirectly.

4H RSI Buy/Sell BotBelow is a clean TradingView Pine Script v5 bot that analyzes the 4-hour timeframe and triggers alerts based on RSI (even though you mentioned RCI—if you actually need RCI, tell me and I’ll rewrite it)

Binary Options v4.0This script fixes the situation of consecutive losses from single-direction trades through window logic

MRC Supply & Demand Zones by rnd🚀 MRC Supply & Demand Zones: Professional Reversal & Liquidity Detection
MRC Supply & Demand Zones is a premium hybrid trading tool combining two of the most powerful concepts in technical analysis: Mean Reversion and Volume Profile.
This indicator doesn’t just show arrows — it provides deep market context by defining dynamic volatility channels and hidden supply & demand zones based on real volume data from lower timeframes.
🔥 Key Features
1. MRC (Mean Reversion Channel)
At the core lies the SuperSmoother MA (SSMA) — a next-generation moving average that eliminates market noise significantly more effectively than standard SMAs or EMAs, while maintaining minimal lag.
Logic: Price always tends to return to its mean. The indicator constructs dynamic channels (Inner and Outer) around the SSMA based on volatility (True Range).
Signals:
Long (Buy): Price extends beyond the lower outer boundary (oversold) and closes back above it.
Short (Sell): Price extends beyond the upper outer boundary (overbought) and closes back below it.
2. Supply & Demand Zones
This is not just drawing levels based on simple highs and lows. The indicator utilizes Lower Timeframe (LTF) Data to construct a detailed volume profile inside the candles.
How it works: The algorithm scans history, identifies volume imbalances, and highlights zones where major players have shown significant interest.
Visualization: Automatically draws red (Supply) and blue (Demand) rectangles that act as price magnets and strong support/resistance levels.
⚙️ Settings Guide
🔹 Block: MRC Settings (Channel Settings)
Control signal sensitivity and channel width here.
Min Range %:
What: Sets the minimum channel width as a percentage of the current price.
Why: Prevents the channel from squeezing into a "thin line" during flat markets, filtering out false signals during low volatility.
Outer Multiplier:
Default: 1.9
Role: Defines the boundaries for "extreme" overbought/oversold conditions. Higher values result in fewer, but more accurate entry signals.
Inner Multiplier:
Default: 1.0
Role: Defines the boundaries of "normal" price oscillation. Often used as the first target for taking profits (Take Profit).
SSMA Length:
Default: 200
Role: The period of the main trend line. 200 is ideal for defining the long-term trend and the global "center" of price.
Source:
Default: hlc3 (High+Low+Close / 3).
Role: The price data used for calculations.
🔹 Block: Supply & Demand Zones
Controls the liquidity search algorithm.
Supply & Demand Zones (On/Off): Toggle the display of the rectangular zones.
Threshold %: Defines how "significant" the volume must be. Adjusts the filtering of weak zones.
Supply/Demand Zones Color: Select the color and opacity for seller and buyer zones.
Profile Lookback Range:
Fixed Range: Analyzes a fixed number of recent bars.
Visible Range: Analyzes only the bars currently visible on the screen.
Lookback Length: The depth of history (number of bars) for volume analysis (works in Fixed Range mode).
Profile Number of Rows: Profile resolution. Higher numbers result in more detailed and narrower zones.
🔔 Alert System
You will never miss an entry. The indicator includes built-in conditions for creating alerts:
Long Signal: Triggers on a green triangle (upward reversal from the lower boundary).
Short Signal: Triggers on a red triangle (downward reversal from the upper boundary).
💡 Why use this indicator?
This is a ready-made "all-in-one" trading strategy. You get the trend (SSMA), volatility (MRC), and liquidity levels (S&D) in one compact script. It is perfect for scalping and day trading on any asset (Crypto, Forex, Stocks).

MACD Divergence SystemMACD Divergence SystemMACD Divergence SystemMACD Divergence SystemMACD Divergence System


Monitor Posición Bollinger Multi-TFThis indicator provides a comprehensive dashboard that allows you to monitor the price position relative to Bollinger Bands across 7 different timeframes simultaneously, without the need to switch charts.
It uses the %B (Percent B) logic to normalize the price position, giving you an instant "Heatmap" view of the market state (Overbought/Oversold) from the 1-minute chart up to the Weekly chart.
Key Features:
Multi-Timeframe Monitoring: Watch 1m, 5m, 15m, 1h, 4h, Daily, and Weekly timeframes in a single panel.
Dynamic Color Coding:
Dark Red: Price breaking above the Upper Band (>100%).
Light Red: Price near the Upper Band (Resistance zone).
Gray: Price in the neutral middle zone.
Light Green: Price near the Lower Band (Support zone).
Dark Green: Price breaking below the Lower Band (<0%).
Trend Arrows: Indicates momentum (▲ or ▼) based on the previous candle's position.
Current Timeframe Highlight: Automatically highlights the row corresponding to your current chart view in orange.
Fully Customizable: Adjust Bollinger settings (Length, Mult), choose your preferred timeframes, and change the table position/size.
Movable Panel: Includes X/Y offset settings to prevent the table from blocking price action or menu buttons.
How to Use:
Add the indicator to your chart.
Use the dashboard to spot confluence across timeframes.
Example: If 15m, 1H, and 4H are all showing Red, the asset is likely overextended to the upside.
Example: If the lower timeframes are turning Green while the higher timeframes remain Gray/Bullish, it might indicate a pullback opportunity.
Settings:
Bollinger Config: Length (20) and Multiplier (2.0) by default.
Timeframes: Select the 7 specific TFs you want to track.
Visuals: Change table position, text size, and offset coordinates.
This tool is essential for scalpers and day traders who need situational awareness across multiple fractals instantly.
