HG Scalpius - Previous Bar HighlightHG Scalpius - Previous Bar Highlight
This indicator highlights the 20th bar from the current bar and has the below applications for trading the HG Scalpius system:
- Determining if trend mode off switch is triggered, failing to set a new higher (lower) close in the trend with 20 bars
- Determining the highest (lowest) bar in the previous range to decide if a trade is high & tight
bars_back = input(defval=20, minval=0, title="Bars Back")
bgcolor(#9C27B0, offset=-bars_back, show_last=1)
If you come across or think of any other useful scripts for the HG Scalpius system please comment below!
Happy trading!
K线分析

How To Limit n Round Trips Per Day [Alerts]Example how to limit the number of round trips per day. If entry condition is never met logic will force a round trip at end of day. Set chart to a timeframe that is lower than 1 Day period.
NOTICE: This is an example script and not meant to be used as an actual strategy. By using this script or any portion thereof, you acknowledge that you have read and understood that this is for research purposes only and I am not responsible for any financial losses you may incur by using this script!

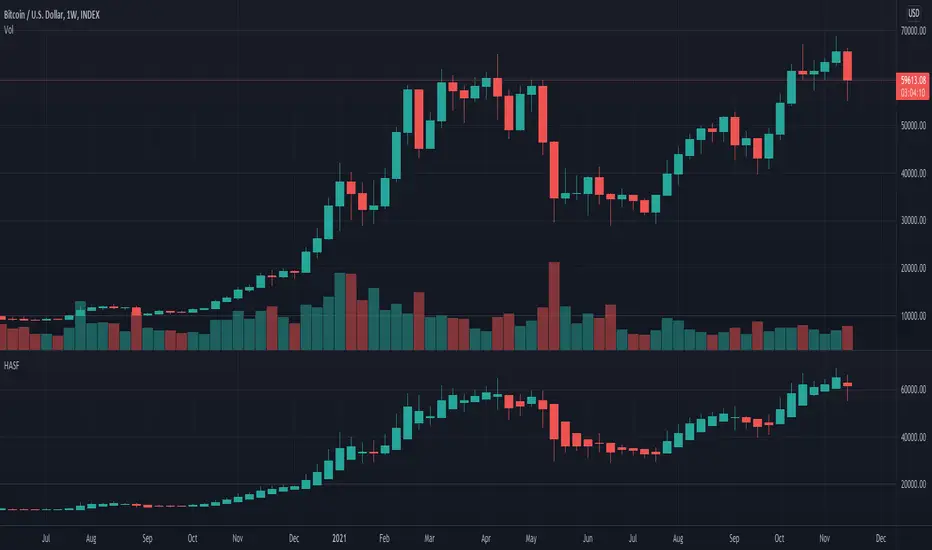
Off-chart 21 MA, Bollinger Bands and Heikin Ashi CandlesThis off-chart indicator provides three basic and useful tools for trend trading in Bitcoin and probably other markets. Heikin Ashi candles being utilized with classic candle patterns at the same time could be considered as a conservative and safe confirmation approach for entring your position.

HG Scalpius H & SS ScanHG Scalpius H & SS Scan
This indicator highlights hammer candles and shooting star candles based on the below definitions:
Hammer = lower wick >= 2* real body and closes in top half of range
Shooting Star = upper wick >= 2*real body and closes in bottom half of range
hammer = (min(open,close)-low)>= (2*abs(open-close)) and close > (((high-low)/2)+low)
shootingStar = (high-max(open,close))>= (2*abs(open-close)) and close < (((high-low)/2)+low)

Tweezer Scanner v1Some code for detecting tweezer candles, which are reversal patterns. You'll need to tweak the settings to be either less strict (more detections) or more strict (less detections). I found that if you follow the documentation for tweezers exactly, you will get very few detections. It is possible that this candlestick has become overused, so the original pattern itself has been lost to the noise of the market.
Settings:
1. Tweezer Max Body Height (Pips) - How tall can the body of the tweezer be, in pips (increase this pips to increase detections)
2. Tweezer Body Similarity (>%) - How similar should the body heights be, higher percentage is more similar (reduce this % to increase detections)
3. Tweezer Tail Similarity (>%) - How similar should the tail heights be, higher percentage is more similar (reduce this % to increase detections)
4. Tweezer Tail Proportion (<%) - How short should the opposite tail heights be, lower percentage is shorter and more similar to the documentation (increase this % to increase detections)

Marubozu Scanner v1Some code for detecting the very rare occurrences of the Marubozu candle. This candle occurs when the High = Close, and Low = Open, or vice versa. They are continuation candles, so if you see a bullish Marubozu during an uptrend its possible that the uptrend will continue.

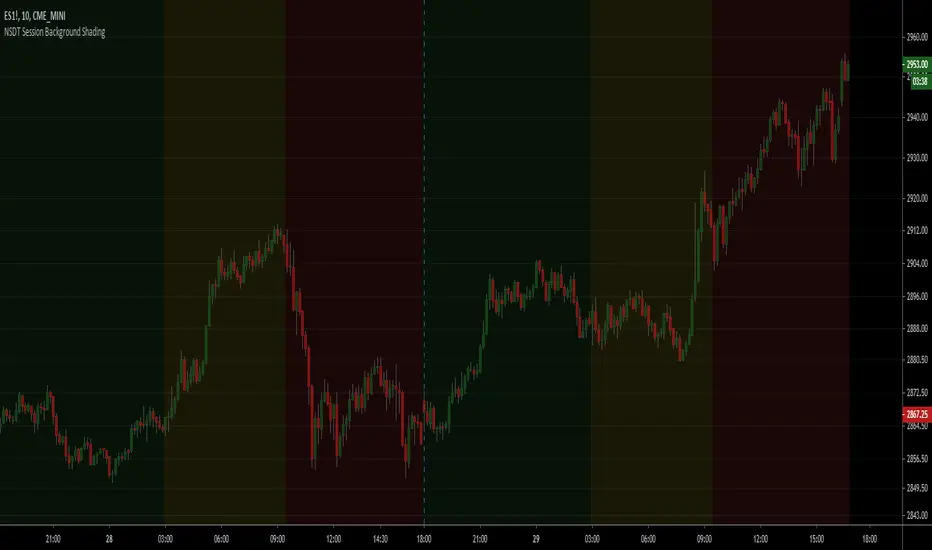
NSDT Session Background ShadingA simple script to add background colors to specific timeframes. Great for trading futures so you can separate sessions for easier viewing. Use for stocks to separate pre, open, and post market times.
There are three timeframes that can be set and all colors can be modified.
Doji Scanner v1A scanner for detecting Doji Candles.
Adjust the maximum allowable height of a Doji Candle's body, depending on the currency pair or asset.

Heikin-Ashi Source FunctionCustom source function for toggling traditional Candle sources or Heikin-Ashi sources on a traditional Candles chart.
Thanks to PineCoders for rounding method: www.pinecoders.com
Thanks to @LucF and @RicardoSantos for their advice and enlightenment as always.
NOTICE: This is an example script and not meant to be used as an actual strategy. By using this script or any portion thereof, you acknowledge that you have read and understood that this is for research purposes only and I am not responsible for any financial losses you may incur by using this script!

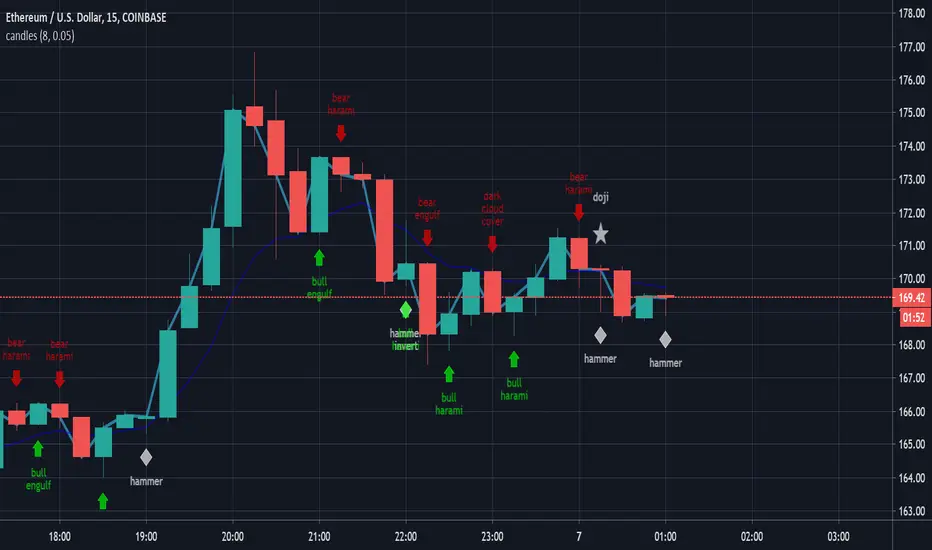
candlestick patternsCleaning up and updating vcsWo8mh-Candlestick-Patterns-Identified-updated-3-11-15 .
As I learn more candlestick patterns I'll add them in.
Please post requests and any potential implementations I could port to pine script.
I'm applying autopep8 as best I can for readability.
Previous Week high & lowIt indicates the previous week high and low.
When overlaid on the daily chart, it give buy and sell signals (in the understanding you have made a trade setup). Buy when the price crosses the previous week high, sell when it crosses the previous week low.

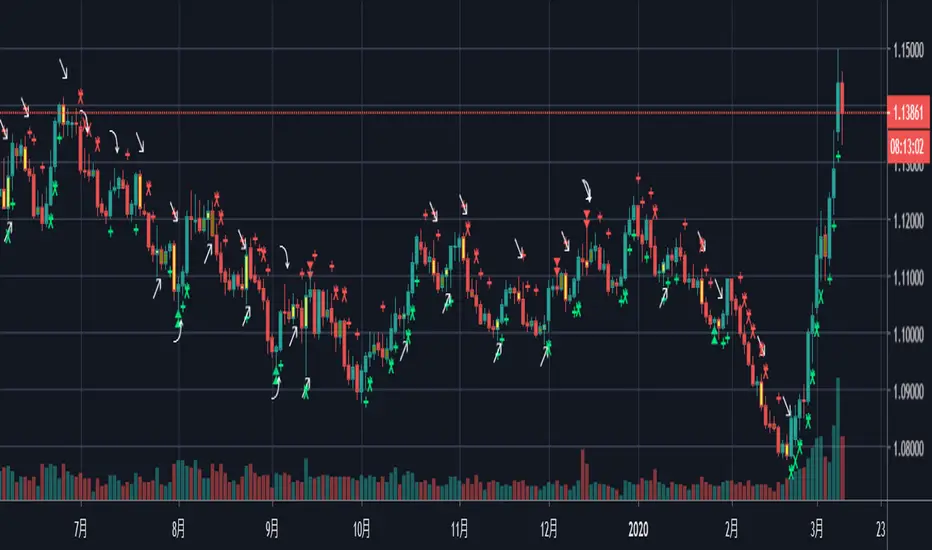
Vanilla ABCD PatternPatterns makes parts of the many predictive tools available to technical analysts, the most simples ones can be easily detected by using scripts. The proposed tool detect the simple (vanilla) form of the ABCD pattern, a pattern aiming to detect potential price swings. The script can use an additional confirmation condition that aim to filter potential false signals.
ABCD PATTERN
The ABCD pattern is not meant to be detected by analyzing individuals closing price observations but by analyzing longer term movements, this is done by using tools such as zig-zag. Like any pattern the ABCD one comes in different flavors, the simplest being based on the following structures:
Once price reach D we can expect a reversal. The classical pattern has the following conditions : BC = 0.618*AB and CD = 1.618*AB , as you can see this condition is based on 0.618 which is a ratio in the Fibonacci sequence. Other conditions are for AB to equal to CD or for CD to be 161.8% longer than AB. Why these conditions ? Cause Fibonacci of course .
The ABCD pattern that the proposed tool aim to detect is not based on the zig-zag but only on individual price observations and don't make use of any of the previously described conditions, thus becoming more like a candle pattern.
When the label is blue it means that the tool has detected a bullish ABCD pattern, while a red label means that the tool has detected a bearish ABCD pattern.
We can't expect patterns based on the analysis of 1,2,3 or 4 closing price observations to predict the reversal of mid/long term movements, this can be seen on the above chart, but we can see some signals predicting short term movements.
Since the pattern is based on a noisy variation, using smoother input can result in less signals.
Above the tool on BTCUSD using closing price as input. Below the tool using ohlc4 as input:
TOOL OPTIONS
Being to early can be as devastating as being to late, therefore a confirmation point can be beneficial, the tool allow you to wait for confirmation thus having a potentially better timing. Below is a chart of AMD with no confirmation:
As we can see there are many signals with some of them occurring to early, we can fix this by checking the confirmation option:
The confirmation is simply based on the candle color, for example if a bearish ABCD pattern has been detected in the past and the closing price is greater than the opening price then the tool return a buy signal. The same apply with a bearish ABCD pattern.
The "last bar repaint" option is true by default, this in order to show the bar where the D point of the pattern has been detected, since the closing price of the last bar is constantly changing the signals on the last bar can be constantly appearing/disappearing, unchecking the option will fix this but will no longer the bar where the D point of the pattern has been detected.
SUMMARY
The pattern is simple and can sometimes be accurate when predicting the direction of future short terms movements. The tool was a request, as it seems i don't post many pattern detectors, well thats true, and the reason is that for me patterns are not super significant, and their detection can be extremely subjective, this is why simple patterns are certainly the only ones worth a look.
Don't expect me to post many pattern related indicators in the future ^^'

Total Bars [xdecow]This simple indicator shows the total number of bars on the graph.
It serves to see which broker has a longer history or if the chart has enough candles to perform backtests.

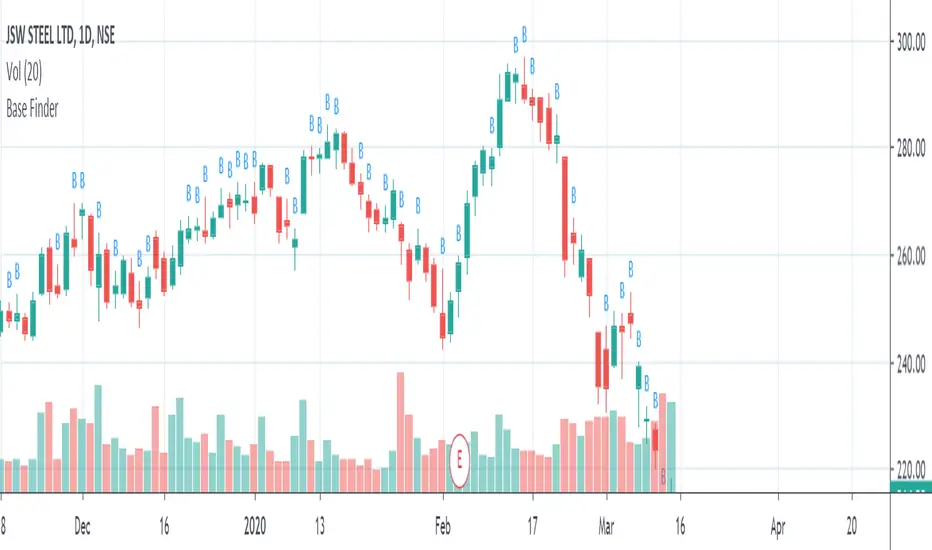
Base FinderIt will mark candle as base if body of the candle is less than or equal to 50% of the range.
.BXBT IndexThe current .BXBT index weighted as close as possible to BitMEX's with updates as BitMEX refreshes their index.
Difference between this and the script titled '2020 March 27 .BXBT Index': this one will receive updates because it doesn't have a date in its title.
Methodology
www.bitmex.com
"BitMEX Index Weights, assuming no constituent exchanges have been excluded due to Index Protection Rules, last updated 27 December 2019 at 12:00:05 UTC."
Binance: -
Bitstamp: 10.61%
Bittrex: 2.53%
Coinbase: 52.30%
Gemini: 6.89%
Huobi: -
Itbit: 4.21%
Kraken: 23.46%
Poloniex: -
ItBit's weight is combined with Gemini's due to ItBit not being on TradingView as of now. BITTREX:BTCUSD substituted with BITTREX:BTCUSDT*POLONIEX:USDTUSD to backfill because Bittrex only recently (late 2018) started to offer a fiat BTC/USD pair. Not that it matters since the index used in 2018 didn't include Bittrex if I remember correctly.
What is actually used for 27/12/2019 to 27/03/2020:
Binance: -
Bitstamp: 10.61%
Bittrex: 2.53%
Coinbase: 52.30%
Gemini: 11.10%
Huobi: -
Itbit: -
Kraken: 23.46%
Poloniex: -
Options:
Toggle candlesticks or close line
Change price source to be used for indicators
To be added: Change quarter to show indexes for different times, with labels that apply to the appropriate index used
Reasons to use this vs. the index itself: (not many)
It is helpful as a reference for other indicators or creation of an index.

2020 March 27 .BXBT IndexAs described here:
www.bitmex.com
blog.bitmex.com
With itBit's weight given to \Gemini because it currently is not on TradingView and they're both small NY based exchanges.
BITSTAMP: 24.86%
BITTREX: 2.53%
COINBASE: 44.98%
GEMINI: 7.41%
KRAKEN: 20.22%
BITSTAMP:BTCUSD^0.2486*BITTREX:BTCUSD^0.0253*COINBASE:BTCUSD^0.4498*GEMINI:BTCUSD^0.0741*KRAKEN:XBTUSD^0.2022
Intended for use with volume based indicators because BitMEX's indices do not include volume data.

Price_ActionCandlestick analysis
Here is a summary of candlestick analysis that seems useful.
pin bar
inside bar
outside bar
thrust bar
reversal bar
runway bar
morning star
evening star
hammer
inverted hammer
thank you for reading.
Percent Change MtFThis plots the selected resolution's percent change from open to close. Easy way to check the previous period's range with less noise. Note the latest period is calculating on a bar that hasn't closed so it won't update unless you refresh/change timeframes to prevent incorrect reporting.

[RESEARCH] Point-and-Figure (P&F) Chart Identifier(Republishing of the hidden script)
A heuristic approach to identify P&F chart type. Catches all variations.
Works correctly with other chart types:
Classic Candles
Heikin-Ashi
Line Break
Kagi
ATR Renko
Traditional Renko
Range Bars

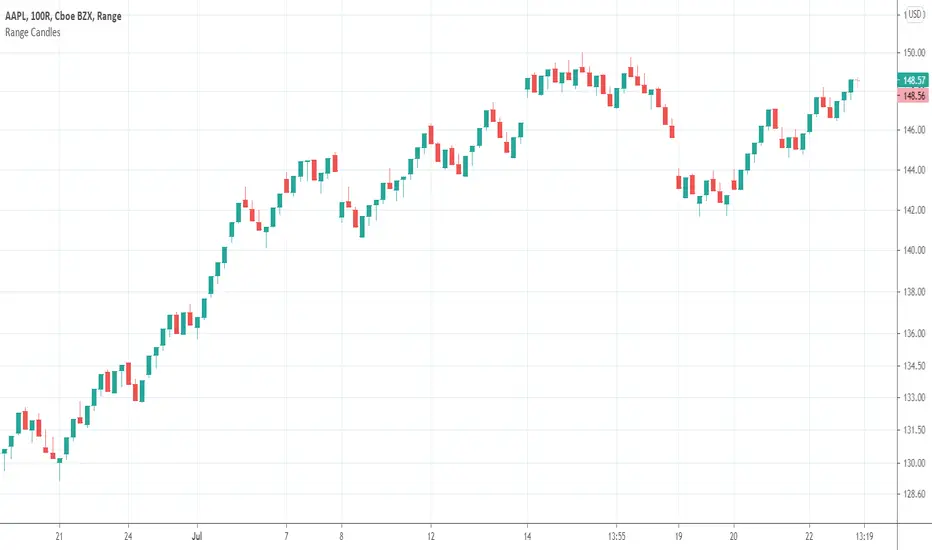
Range CandlesAn easy-peasy way to replace OHLC bars with candles on Range Bars chart. For further improvement you could also make "Up Bars" and "Down Bars" colors transparent (open Range Bars chart settings, do the change and save as default).
Compare
Gap Finder v1.0 by Nimit ChomnawangThis indicator shows locations of price gaps (or candle stick discontinuities). It prints out the labels "Gap" under the price bars where gaps occur. Asterisk " * " is used to pin point the bars with gaps.
