Pin Bar CandlesPin Bar Candles can be used for identifying reversal points with the help of support and resistance
K线分析

FTX Index Advance Decline LineAs of publishing, all the tickers from FTX with the word "index" in it, plus bitcoin.
This is your regular ADL except instead of hundreds in the basket you've got them condensed into 7 (for now) and in open/close candle form instead of a line.
I'm a bit disappointed because I thought I'd lever more utility from indexes. It may just need some tweaking.
Doesn't it look like Renko?
Some notes:
Reason why it expands:
Total number of constituents is a static 7, to fix that use time to change the total variable based on dates of introduction.
Reallly looks like Renko:
Renko with ATR, length 14, hourly chart.


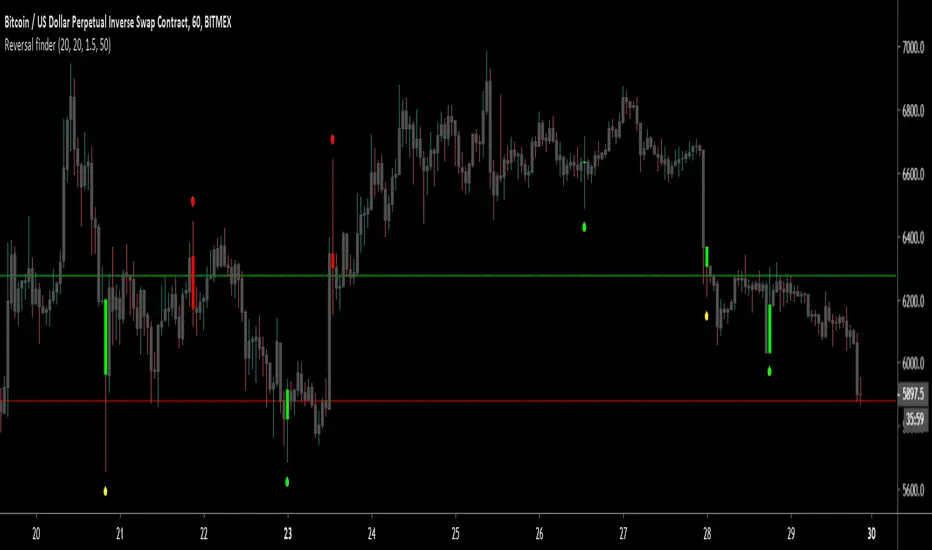
Reversal finderThis script is used to visually highlight candles which may signal a reversal following a false break of a support or resistance level.
Inputs are:
Lookback period: look for the highest high and the lowest low of the prior x bars.
SMA length: used for a simple moving average of the range (high minus low) of the prior x bars.
Range multiple: used to filter out signals for any bars with a range smaller than the average range of the preceding bars (determined by SMA length above) e.g. a range multiple of 2 will only show signals for bars with a range twice of that of the average range of the preceding bars.
Range threshold: used to filter signals for bars both the open and close of the bar are at the extreme end of the bar e.g. a threshold setting of 33% will only show buy signals for bars which open and close within the upper 1/3rd of the bar’s high/low range (vice versa for sell signals). This helps highlight, for example, bars with a high which exceeds resistance in a current range but which close back inside the range.
Highlight signal bars?: This will highlight bars with a buy signal in green, sell signal bars in red, and all other bars in grey. The script was designed for use with a dark background, so you will need to play around with the bar colours in the style settings to suit your preferences.
Settings used in the example chart are not the default – they are lookback: 5, SMA length: 20, range multiple: 1.2, range threshold: 33%.
Enjoy!
BERLIN CandlesA problem with Heikin Ashi is that while it gives you a great overview of overall direction, it is rarely possible to use it as a replacement for normal japanese
candlesticks. The reason for this is that actual price data is lost, since the candles are more akin to a moving average than a different way to see price action. Also, with Heikin Ashi, most of the actual price action is lost, because the candles can be bigger than the high and low of the underlying japanese candlestick.
With BERLIN Candles I have tried to fix that problem. By using a smoothed out version of the previous Heikin Ashi candle close as the current BERLIN Candle open, the high and low of the actual japanese candlestick for the high and low of the BERLIN Candle, and the current Heikin Ashi close as the BERLIN Candle close, while setting hard limits for BERLIN Candle open and close values so that they can never exceed the high and low of the underlying japanese candlestick.
One problem still persists though. The actual current price data is lost. However, the BERLIN Candles have solved this by adding a fifth part to the candles. The close of the underlying japanese candlesticks are indicated with a plus-sign. This way, actual price data is never lost, while keeping all of the other benefits of this type of candles.
A few added bonuses:
The addition of the 14 period ATR at the latest candle
The baseline from Ichimoku is included as an option
The 14 period ATR value of each candle can be seen in the indicator data as
the orange value

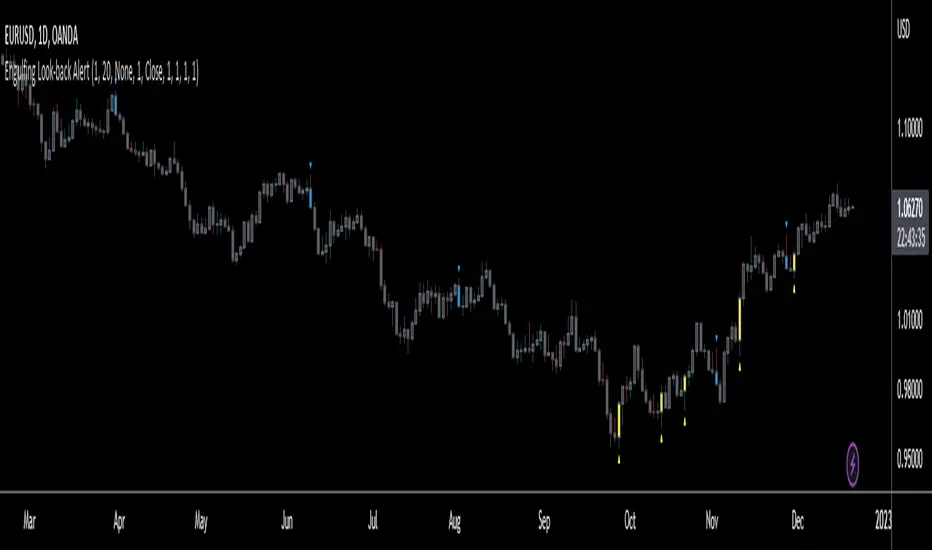
Engulfing Look-back AlertThis script is an extension of the classical engulf pattern with added rules and user defined features.
Engulfing Candle Definition:
- Bullish Engulfing: Trade BELOW the prior candle's LOW and CLOSE ABOVE the prior candle's HIGH. Previous candle can be an up (bullish) or a down (bearish) candle
- Bearish Engulfing: Trade ABOVE the prior candle’s HIGH and CLOSE BELOW the prior candle’s LOW. Previous candle can be an up (bullish) or a down (bearish) candle
Features:
- Set the look-back period for engulfing candle high and low -> default = 1; e.g. Did the bullish eng candle trade below the lows of the last 3 candles and trade above the highs of the last 4 candles? Set the input values accordingly
- Choose time frame(s) engulfing candle is to be displayed on -> default = M/W/D/4H/1H/15M
- Ability to enable Alerts (includes time frame alert was triggered on): IMPORTANT - when setting alerts ensure to choose "ONCE PER BAR"; otherwise alerts will NOT trigger as intended
prntscr.com
NSDT Chart Background ColorThe chart background settings from Tradingview only allow you to select a color from the built-in color grid, which is limited. This feature adds the ability to change the chart background color "shading" which allows you many more color options to fit your needs.

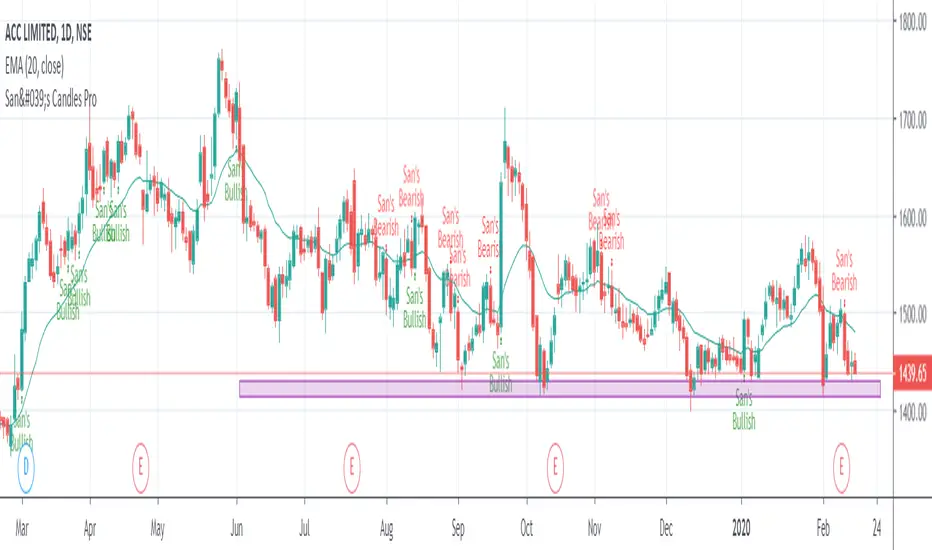
San's Candles ProThe San Trader Candles for bullish and bearish market
- Buy on breaking High of "San's Bullish Candle"
- Sell on breaking Low of "San's Bearish Candle"
Preferred Time Frame: Daily and Weekly
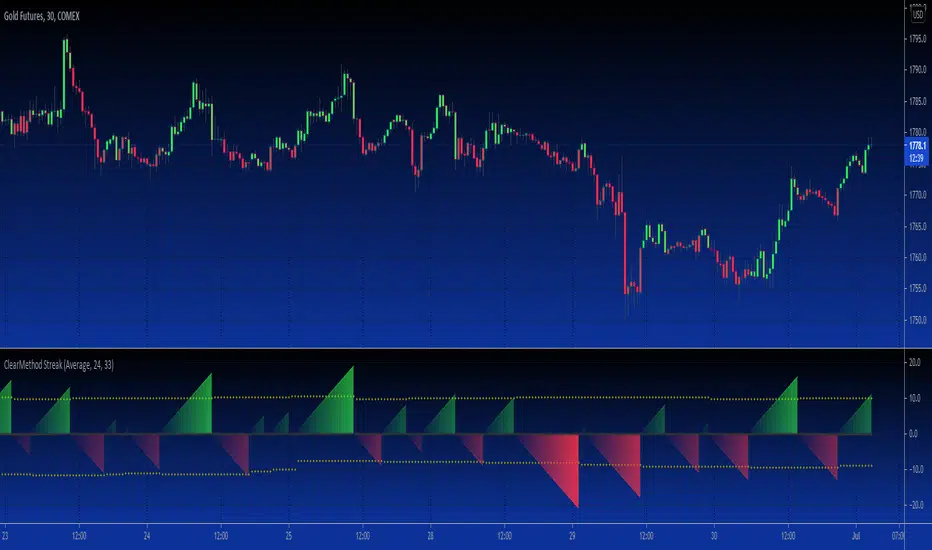
B3 Clear Method Streak CountAbout Clear Method -- to repeat my prior post on the bar painter script:
This indicator is translated out of Technical Analysis of Stocks & Commodities , September 2010, (I take zero design credit). The script simply looks for the price action to break or "clear" the most recent action, and only changes the paintbar color if the action indeed clears the previous candles. Simple to use, just add to your chart from your favorites and change the colors in the UI. It does the rest.
This version can replace my previous Clear Method Bar Painter as it also paints the bars.
What is different is this share is a lower study that counts the streak of the bars shown via histogram.
The way to use the streak is to notice the previous streaks and get a sense of how long the current trend is lasting versus prior trends of the same direction.
@Tradestation recently posted their "price streak" study, and this one is quite similar in nature.
Enjoy, the code open to view,
_B3
d^.^b
Bull/Bear Engulf High Low LookupAllows to specify the high and low look-back period for both Bullish and Bearish engulfing candles. In essence, it is an extension of the classical engulf pattern. By default lookback period is set to 3.
Can be used on any time-frame and any instrument. Previous candle is irrelevent.
An engulfing candle is defined as follows:
Bullish: Must trade BELOW prior candle LOW and close ABOVE prior candle HIGH
Bullish: Must trade ABOVE prior candle HIGH and close BELOW prior candle LOW

It's Sunday and 2300UTCCME bitcoin trading opens at 5p.m. CT (UTC-6) on Sunday. This translates to 2300 UTC.
www.cmegroup.com
Orange: CME open hour candle's range is smaller than the previous hourly candle
Fuchsia: CME open hour candle's range is larger than the previous hourly candle
If there is a blue highlight after CME open, that means the candle after the open has a larger range. Otherwise there is no highlight.

Divergence for many indicator v3Hello Everyone. Almost one year later, with Pine version 4, I developed new version of the Divergence for many Indicator.
It analyses divergences for 10 predefined indicators and then draws line on the graph. Red for negatif divergence (means prices may go down or trend reversal), Lime for positive divergences (means prices may go up or trend reversal)
Divergences version 2 has latency because it waits higher time frame completion. in this new version the script uses Pivot Points and on every bar it checks divergence between last Pivot point and current bar and if it finds any then immediately draws line and removes old one. so there is no latency with this version.
There are predefined 10 indicators in the script, you have option to choose which indicators the script would analyse for divergence. (RSI , MACD , MACD Histogram, Stochastic , CCI , Momentum, OBV, Diosc, VWMACD and CMF)
In replay mode you can see how the script puts new divergence line and removes old one. you better see it for yourself by using replay mode.
Hope you Enjoy!

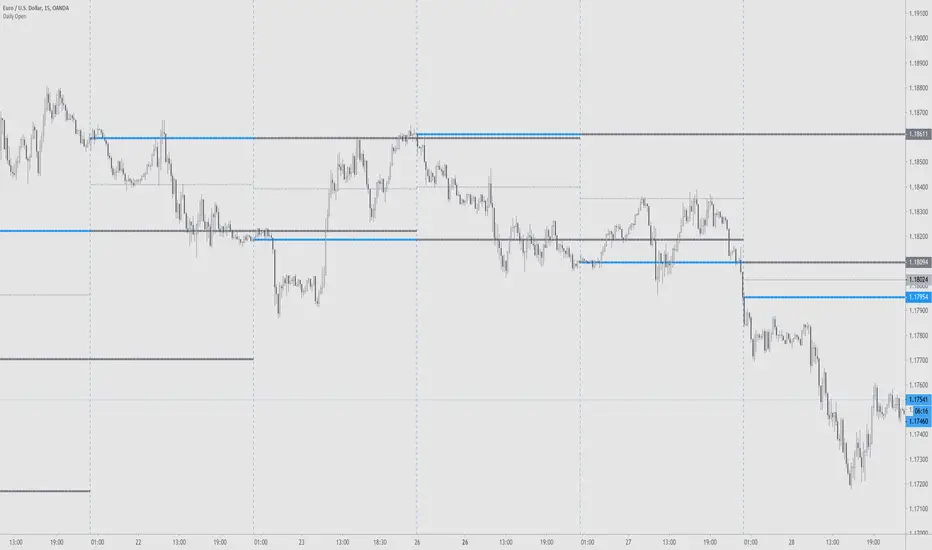
Daily OpenUses provided unix time functions to print daily open (0000 UTC) lines and optionally an additional extension to it from the previous day.
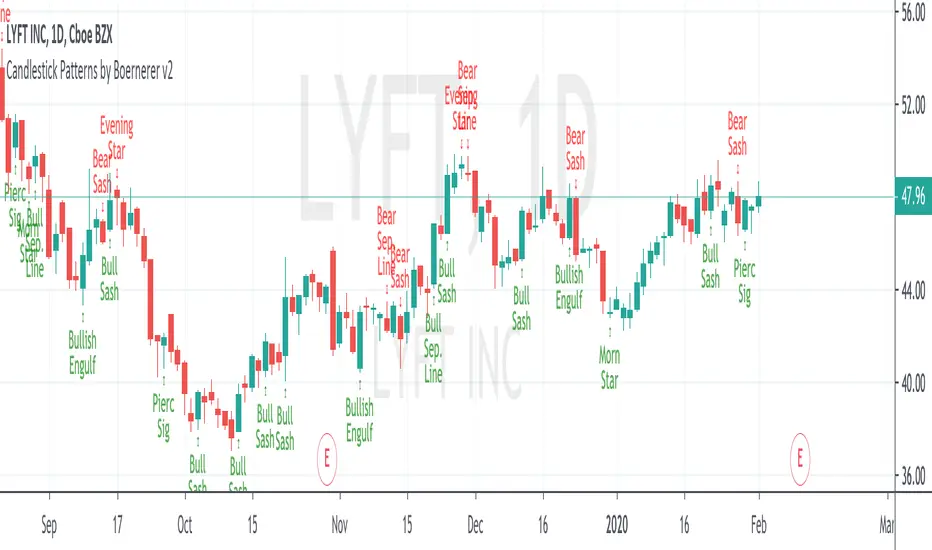
Candlestick Patterns by Boernerer v2New version 2 of my modifications of the original candlestick pattern script by Robert Waddell.
- Added window (= gaps) detection
- Added Bear/Bull Sash
- Added Bear/Bull Counter Attack
- Added Bear/Bull Seperating Line
- Modified candlestick ID code
- Added Lookback period instead of SMA (TLine) for trend detection
4h and 1h High/LowThis is a simple script to easily view the High and Low of previous 4h and 1h candles on lower timeframes.

Candlestick Patterns + windows Mod by BoernererMy modifications for the candlestick pattern script by Robert Waddell.
Changelog
- Added window (= gaps) detection
- Added Bear/Bull Sash
- Modified candlestick ID code
- Candlesticks will only be displayed if above or below TLine
Originally created by Robert Waddell with special thanks to repo32 for his candlestick ID code, DavidR for EMA code and Chris Moody for barcolor code.
Enjoy and would love if you improve it further!

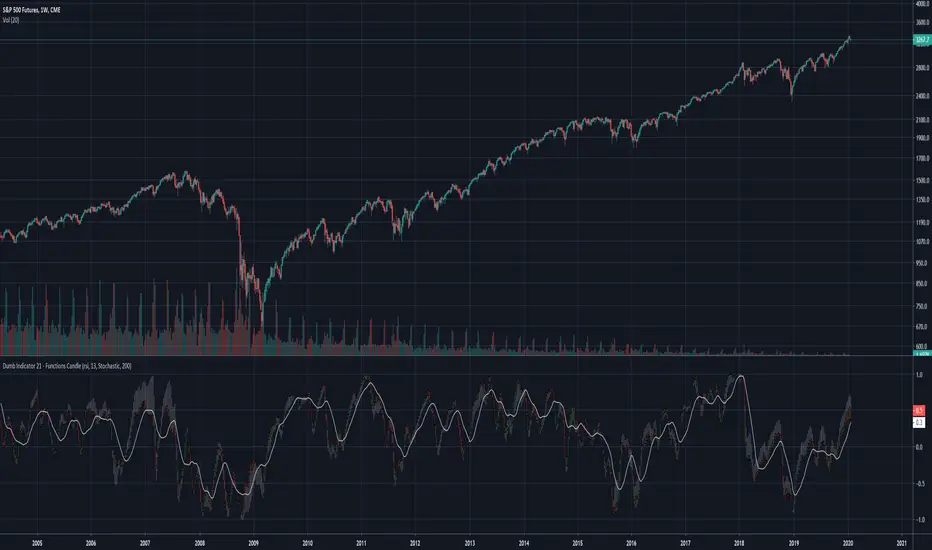
Dumb Indicator 21 - Function's Candlestick Bar's StyleThe idea is help traders to see the patterns and levels from a different point o view.
This script create candlestick using the opening, high, low and close price as source on your favorite function.
It's very simple to use:
Select a function in the drop box list, the number of bars length, check or uncheck the boxes to treat source as logarithm, smooth, and if you want to plot the SMA from the results.
To make a deeper analysis, you can select to plot the candles in Stochastic or in Percent Rank way.
The Stochastic and Percent Rank plot will show how far the price is close to highest or lowest value of the source from the last "Stochastic Length" number of bars.
Some functions with different names can plot the same results.
This indicator works on every kind of market, but you will need to find the best function and length to use.
Please, if you find anything good with this, share to everyone.
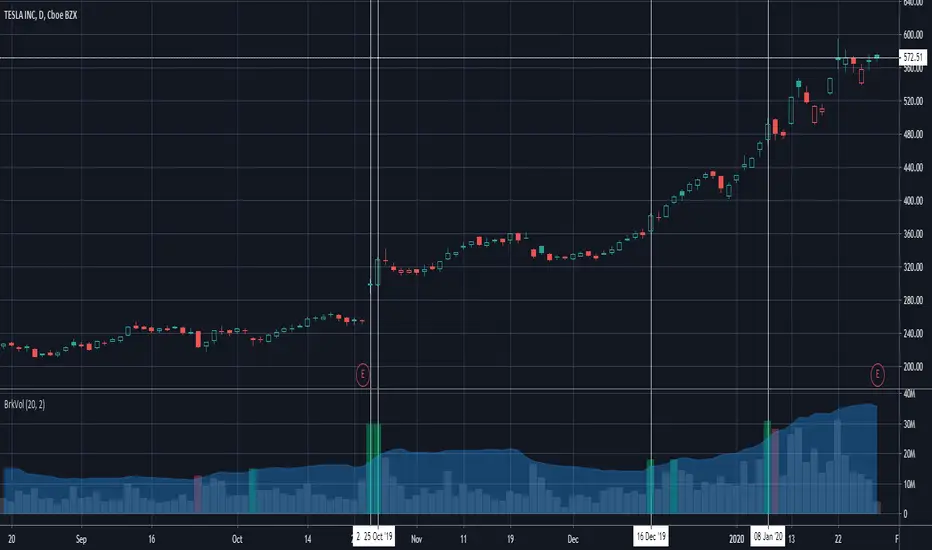
Breakout Volume Can Help Confirm Other SignalsVolume can help confirm signals we might discover using other methods of technical analysis.
This indicator tracks volume intelligently. Its logic spots above-average turnover and then tests against the price change. BrkVol highlights sessions with heavy volume and directional moves. This can help take out the noise and help confirm the trend.
Tesla is a classic example of this, with the stock rallying after showing heavy-volume gains on October 24- 25, December 16 and January 8.
MultiTimeFrame Fractals D W M [xdecow]This indicator shows fractals in different timeframes. With the possibility of coloring the bars with any combination of current, daily, weekly and monthly timeframes.
The return points are calculated as follows:
high > last 3 highs and close above highest low
low < last 3 lows and closes below lowest high
The direction of higher timeframes fractals tend to be more durable and reliable. This indicator helps to find the fractal alignment of different timeframes, so that you can look for trade opportunities in the same direction as the higher timeframes and improve your chances.

Simple Moving Average - ATR Trailing StopThe old adage goes "Cut losers fast and let the winners run"
With this in mind, this will plot a dynamic trailing stop by subtracting any multiplier of the Average True Range (ATR) from the SMA of your choice.

Candlesticks ANN for Stock Markets TF : 1WHello, this script consists of training candlesticks with Artificial Neural Networks (ANN).
In addition to the first series, candlesticks' bodies and wicks were also introduced as training inputs.
The inputs are individually trained to find the relationship between the subsequent historical value of all candlestick values 1.(High,Low,Close,Open)
The outputs are adapted to the current values with a simple forecast code.
Once the OHLC value is found, the exponential moving averages of 5 and 20 periods are used.
Reminder : OHLC = (Open + High + Close + Low ) / 4
First version :
Script is designed for S&P 500 Indices,Funds,ETFs, especially S&P 500 Stocks,and for all liquid Stocks all around the World.
NOTE: This script is only suitable for 1W time-frame for Stocks.
The average training error rates are less than 5 per thousand for each candlestick variable. (Average Error < 0.005 )
I've just finished it and haven't tested it in detail.
So let's use it carefully as a supporter.
Best regards !

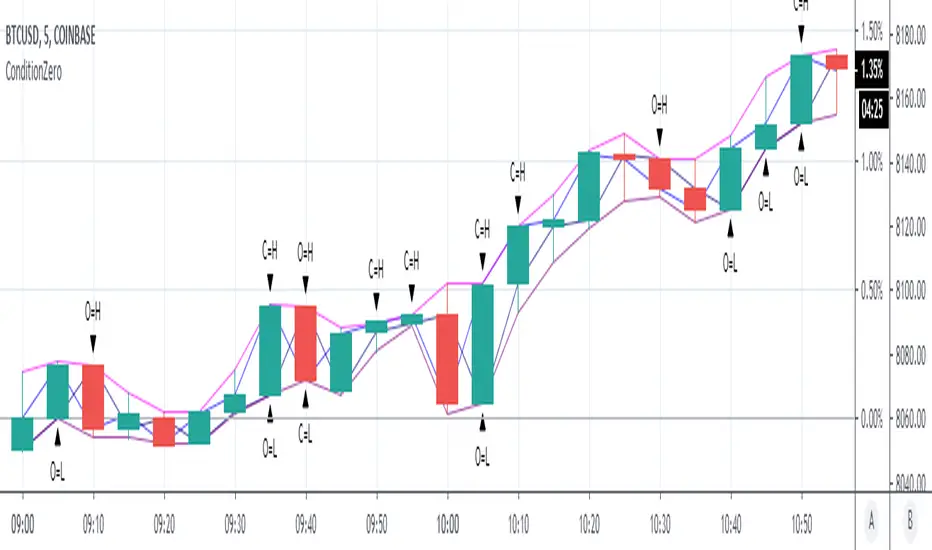
ConditionZeroThis study is a proof of concept analysis of situations that can lead to divide with zero or divide by zero conditions. Such situations can lead to mathematical errors, and can increase the potential for false alerts.
One common formula that is prone to this situation is:
pct=(high-close)/(high-low)
This is used to calculate percentage change of a candlestick.
Common outcomes are 0/0, 0/x, x/0, where x is a non zero value.
Visualizing this situation allows for more robust script development and deployment.
There are no user configurations.
Deadband cross detection for BTC (XBT)Description: meant to be used with BTCUSD (or XBTUSD ) on 3 mins to 1h candles charts.
Idea is to provide a tool to detect break-out's from a dead band around an EMA, and to detect back-in's to the dead band.
Detection is fundamentally based on how much %, at least, a certain candle body has ruptured the dead band (adjustable).
Long and short flags are placed on the chart, as well as the deadband. Can be used to generate alers.
With minimal modifications, can be convert to a Strategy script.
Following are ideas to play around if you want. Room for improvements:
- convert constants into inputs, and diversify thresholds assimetrically
- play around with wether or not using pyramiding (here pyramiding is blocked)
- look at several bars in a sequence, not only current
