Candlestick analysis

Levels S/R Boxes + Gaps + SL/TPWhat It Does:
Automatically identifies and displays:
🟦 Support/Resistance zones (horizontal boxes)
🟨 Price gaps (unfilled gaps from market open/close)
🎯 Stop Loss levels (where to protect trades)
💰 Take Profit levels (where to exit trades)
Purpose: Shows you exactly where price is likely to bounce, reverse, or break through.
Best Practices:
✅ Trade at the boxes - Don't chase price
✅ Use SL/TP lines - Automatic risk management
✅ Wait for confirmation - Candle pattern + S/R level
✅ Gaps get filled - Trade towards yellow boxes
✅ Solid lines = stronger - Prefer 3+ touch levels
❌ Don't ignore SL - Always protect yourself
❌ Don't trade middle - Wait for S/R zones
❌ Don't fight strong levels - Respect solid boxes
Settings (Quick Reference):
S/R Strength: 10 (default) - Lower = more levels, Higher = fewer stronger levels
Max Levels: 5 (default) - Number of S/R boxes to show
Show Gaps: ON - Display yellow gap boxes
Show SL/TP: ON - Display entry/exit suggestions


EMA Slope in Degrees (9 & 15) — correctedthis gives angle os slope of 9 and 15 ema uses mayank raj strategy


Jiangnan_BTC_Compare将个别虚拟币走势与BTC的走势进行比较。打开个别币的K线,添加在下方的panel里添加本指标即可。Compare the price movement of individual cryptocurrencies with that of BTC.
Open the candlestick chart of the selected coin and simply add this indicator in the lower panel.

Zonas de Liquidez Pro + Puntos de GiroRequirements for marking 💧:✅ High crosses the zone✅ Close returns inside (false breakout / fakeout)✅ Volume is 20% greater than the average✅ Occurs within the last 10 bars(Note: This last requirement is stated in the text but not explicitly in the code snippet provided)📚 Psychology Behind the SweepWho lost money?Traders with stops placed too tightlyBuyers who entered "on the breakout"Bots with automatic orders placed aboveWho made money?Smart Money / InstitutionsThey sold at a high priceThey hunted for liquidity before moving the priceThey know where retail stops are located🎯 How to Use the Drops in Your TradingGolden Rule:💧 near a strong zone + Multiple rejections = PROBABLE REVERSALStrategy:See 💧 at resistance → Look for SHORTSee 💧 at support → Look for LONGPrice returns to the swept zone → High-probability setupStop beyond the sweep high/low → ProtectionPractical Example:If you see 💧 LIQ at $111,263 (resistance)→ Wait for bearish rejection→ Entry: Sell at $110,800→ Stop: $111,500 (above the sweep high)→ Target: Next support level⚠️ Common Mistakes❌ Mistake 1: Trading the breakoutPrice breaks $111k → "It's going to the moon!" → Buy💧 LIQ appears → It was a trap → Drop → Loss✅ Correct Approach:Price breaks $111k → Check if there is 💧 LIQ💧 appears → "It's a trap" → Wait for rejection → Sell❌ Mistake 2: Ignoring the volumeNot all sweeps are equal.Sweeps with high volume are more reliable.No volume = it could be noise.🎓 Ultra-Fast SummaryElementMeaning💧 LIQLiquidity sweep detectedAt ResistanceBullish trap → Prepare for a shortAt SupportBearish trap → Prepare for a longWith High VolumeMore reliable signalNear Strong Zone High probability of reversal🔥 The Magic of Your IndicatorScenarioWithout this IndicatorWith this IndicatorAction"The price broke $111k, I'm buying!""There is 💧 LIQ + zone + rejections → It's a trap."ResultYou loseYou avoid a loss or gain on the short

Highlight 6-7 PM (IST) candle + mark H/L (Hourly)📌 Highlight 6–7 PM Candle (IST) + High/Low Lines (No Labels)
This indicator automatically detects the 6:00–7:00 PM candle (IST) on the hourly timeframe and visually marks it on the chart.
It highlights the candle and draws horizontal High and Low levels without any labels—making the chart clean and easy to read.
✅ Features
Highlights the 6–7 PM hourly candle (timezone adjustable: IST/UTC/Exchange).
Draws high & low horizontal lines from the target candle.
Option to extend the lines for a selected number of bars.
Optional restriction to only show on 1-hour timeframe.
Clean design — no labels, no clutter.
🛠️ Inputs
Timezone (default: Asia/Kolkata)
Target Hour (default: 18 = 6 PM)
Highlight Color
High/Low Line Colors
Line Extension Length
Enable/Disable Hourly-only Mode
🎯 Use Case
Useful for traders who track post-market candles, volatility behavior, range levels, or want to build intraday strategies based on evening session highs/lows.

2-Close + Bar 5 Reversal (Scan Ready)Bulkowski's Bullish 2-Step Reversal
Bar 1 Any price bar.
Bar 2 Price makes a low below bar 1 with a lower close, too.
Bar 3 Price has a low below bar 2 but a close above bar 1 (which will also be above bar 2's close). Bars 1 to 3 form a 2-close reversal pattern.
Bar 4 Makes a close below bar 3's close.
Bar 5 Has a low below bar 4 but closes above bars 3 and 4.
Breakout Breaks out upward 79% of the time in stocks.
From his page: thepatternsite.com

Morning ORB FVG Trigger✅ Overview
Morning ORB FVG Trigger is a complete intraday trading framework built around:
A Morning Opening Range Breakout (ORB)
The first Fair Value Gap (FVG) after that breakout
Strict risk management and position sizing
Optional HTF trend filter (Daily / Weekly / Monthly)
Optional Daily ATR filter to avoid extreme days
The script is designed for futures / indices / FX on intraday charts up to 15 minutes and for traders who want a clean, mechanical entry framework with clear risk.
🧠 Core idea
Define a morning opening range (e.g. 09:30–09:45).
Wait for a clean breakout above/below that range.
After the breakout, wait for the first FVG in breakout direction,
confirmed by the next candle (no immediate full reclaim).
Use a chosen stop logic + R:R factor to build risk/reward boxes.
Calculate position size based on your account risk.
(Optional) Only take trades:
In the direction of the HTF EMA trend (D/W/M).
On days where the morning range is within a band of the Daily ATR.
You can also disable all signals/boxes and use the script just as a visual ORB tool.
⏰ 1. ORB / Morning Range
Inputs (Main section)
Morning Range Session
Time window of the opening range in exchange time
Example: 09:30–09:45 for a 15-minute ORB.
You can type custom ranges (e.g. 09:30–09:35 for a 5-minute ORB).
Risk/Reward (TP factor)
Multiplier for the take-profit distance relative to the stop.
2.0 = TP is 2× the stop distance
1.5 = TP is 1.5× the stop distance
Show ORB range
If enabled, draws:
ORB high/low lines
ORB labels (e.g. 15min ORB high / low)
Optional midline
Extend ORB lines to the right (bars)
How many bars to extend the ORB high/low horizontally beyond the ORB itself.
Trade box width (bars)
Horizontal width (in bars) of:
Red risk box (entry–stop)
Green reward box (entry–TP)
Implementation details
The ORB is always calculated on 1-minute data internally, so it stays precise even on 5m/15m charts.
The script only works on intraday timeframes up to 15 minutes.
📦 2. FVG Block
Group: “FVG”
Threshold %
Minimum size of an FVG in % of price.
0 = every FVG
Higher values = only larger gaps
Auto threshold (from volatility)
If enabled, the minimum FVG size is derived from historical volatility
instead of a fixed percentage.
Allow breakout FVG partly inside ORB
Off (default): the FVG must lie fully outside the ORB.
On: the breakout FVG itself may still overlap the ORB a bit,
as long as it is the first one attached to the breakout move.
Enable FVG entry signals, boxes & alerts
On: full system – FVG detection, entry labels, risk/TP boxes, alerts.
Off: no entries, no risk/TP boxes, no alerts.
You only get the ORB and (optionally) the HTF dashboard, so you can trade your own setups.
Entry mode
Entry mode (Mid / Edge / NextOpen)
Mid – Entry at the midpoint of the FVG.
Edge – Long at the upper FVG edge, short at the lower FVG edge.
NextOpen – No limit order in the gap. Entry is placed at the next bar open after FVG confirmation.
Edge offset (ticks)
Additional offset for Edge entries:
Long:
+ticks = a bit above the FVG (more conservative)
-ticks = deeper into the FVG (more aggressive)
Short:
+ticks = a bit below the FVG
-ticks = deeper into the FVG
FVG detection logic
Uses a LuxAlgo-style 3-candle FVG pattern (gap between candle 1 and 3).
Only one FVG is taken: the first valid FVG after the ORB breakout in breakup direction.
The FVG candle is the middle bar; the script:
Detects the FVG on the previous bar.
Waits for the current bar to confirm it:
Bullish: current low must stay above the lower FVG boundary
Bearish: current high must stay below the upper FVG boundary
Only then an entry signal is generated.
🛑 3. Stop Logic
Group: “Stop Logic”
Stop mode (PrevBar / Pivot / FVG Candle)
PrevBar – Stop at the low/high of the candle before the FVG
(tight/aggressive).
FVG Candle – Stop at the low/high of the FVG candle itself
(medium).
Pivot – Stop at the most recent swing high/low
using pivotLeft / pivotRight pivots (more conservative).
Ticks (stop buffer)
Offset (in ticks) from the selected stop level.
> 0 = further away (more room, more risk)
< 0 = closer (tighter stop)
Pivot left / Pivot right
Number of candles left/right to define a swing high/low
when using Pivot stop mode.
Typical intraday values: 2–3.
The script also sanity-checks the stop:
if the calculated stop would be invalid (e.g. above entry in a long), it moves it by a minimal distance (2 ticks) to keep a valid risk.
📈 4. HTF Trend Filter (Daily / Weekly / Monthly)
Group: “HTF Trend Filter”
Enable HTF trend filter
If enabled, trades are only allowed:
Long when at least 2 of D/W/M closes are above their EMA
Short when at least 2 of D/W/M closes are below their EMA
EMA length (D/W/M)
EMA length for all three higher timeframes (Daily, Weekly, Monthly).
This helps focus entries in the direction of the dominant higher-timeframe trend.
📊 5. ATR Filter (Daily)
Group: “ATR Filter (Daily)”
Use daily ATR filter
If enabled, the height of the ORB (ORB high – ORB low) must be within
a band of the Daily ATR to allow any signals.
Daily ATR length
ATR period on the Daily timeframe.
Min ORB size vs ATR
Lower bound:
Example: 0.3 → ORB must be at least 0.3 × Daily ATR
0.0 = no minimum.
Max ORB size vs ATR
Upper bound:
Example: 1.5 → ORB must be ≤ 1.5 × Daily ATR
0.0 = no maximum.
If the ORB is too small (choppy) or too large (exhausted move), no breakout or FVG signal will be generated on that day.
🧭 6. HTF Dashboard & Signal Labels
Group: “HTF Trend Dashboard”
Show HTF dashboard
Draws a small label at the top of the chart showing:
HTF Trend (EMA X)
D: UP/FLAT/DOWN
W: UP/FLAT/DOWN
M: UP/FLAT/DOWN
Dashboard position
Top Right, Top Center, Top Left – places the dashboard at the top.
Over Risk Info – no top dashboard; instead, the HTF trend info is shown as a label near the risk box when a new signal appears.
Lookback (bars) for top anchor
How many bars to use to determine the top price level for dashboard placement.
Show HTF trend above risk box on signal
Only relevant if Dashboard position = Over Risk Info.
When enabled, a small HTF label appears near the risk box for each new trade.
Signal label vertical offset (ticks)
Vertical spacing between risk info label and HTF label.
Minimum spacing HTF/Risk (ticks)
Ensures a minimum vertical distance so the two labels don’t overlap.
HTF signal label X offset (bars)
Horizontal offset (left/right) relative to the risk info label.
⏳ 7. ORB–FVG Filters (Session & Time Window)
Group: “ORB FVG Filter”
Only same session day
If enabled, FVG entries are only allowed on the same calendar day
as the ORB. When the date changes, all state & drawings are reset.
Limit hours after ORB
Enables a time window after the ORB end.
Trading window after ORB (hours)
Length of that window in hours.
Example: 2.0 → FVG signals only in the first 2 hours after ORB end.
💰 8. Risk Management & Position Sizing
Group: “Risk Management”
Calculate position size
If enabled, the script computes suggested mini and micro contract size for you.
Account size
Your trading account size (in account currency).
Risk mode
Percent – risk is a % of account size (Account risk %).
Fixed amount – risk is a fixed dollar amount (Fixed risk ($)).
Account risk %
Risk per trade as a percentage of account size (e.g. 1.0 for 1%).
Fixed risk ($)
Fixed risk per trade in dollars when using Fixed amount mode.
Micro factor (vs mini)
How much a micro contract is worth relative to a mini.
Example:
0.1 → one micro moves 1/10 of one mini.
Risk Info label
For each new trade, a label is shown above the boxes with:
Stop distance in price and $ risk per mini
Max risk allowed for the trade
Suggested mini and micro size
Text like:
Suggested: 2 mini
Suggested: 5 micro
or Suggested: no trade
This makes the script especially useful for prop-firm rules or strict risk discipline.
🎨 9. Visual Style (Boxes, Labels, ORB Lines)
Group: “Box & Label Style (Trade)”
Label font size (Very small, Small, Normal, Large)
Entry label BG / text color
Stop label BG / text color
TP label BG / text color
Risk info BG / text color
Risk box color (entry–stop zone)
Reward box color (entry–TP zone)
Group: “ORB Style”
ORB high line color
ORB low line color
ORB line width
ORB label font size
ORB label background color
ORB label text color
Show ORB midline
ORB midline color / width / style (Solid / Dashed / Dotted)
⚠️ 10. Alerts
Group: “Alerts”
The script defines three alert conditions:
Long entry FVG breakout
Triggered when a new long signal appears.
Short entry FVG breakout
Triggered when a new short signal appears.
FVG entry (long/short)
Generic alert for any new signal (long or short).
To use them:
Add the indicator to the chart.
Open the Alerts dialog → “Condition”.
Select this script and one of the alert conditions.
Set your preferred expiration and notification settings.
Alerts only fire when Enable FVG entry signals, boxes & alerts is on.
🧩 11. How the trading logic flows (summary)
Build ORB on 1-minute data during the selected session.
Optionally reject the day if ORB is outside the ATR bounds.
Wait for a breakout (close above high or below low), respecting HTF trend filter.
After breakout, look for the first valid FVG in that direction:
Outside the ORB (unless breakout FVG allowed inside)
Confirmed by the next candle (no full reclaim)
Once confirmed:
Compute entry, stop, target.
Draw risk/reward boxes and all labels.
Optionally show HTF signal label over the risk info.
Trigger alerts if enabled.
If you disable FVG signals, only steps 1–3 (plus dashboard) are effectively active.
⚠️ 12. Notes & Disclaimer
Script is intended for intraday trading up to 15-minute timeframes.
All signals are mechanical and do not guarantee profitability.
Always backtest and forward-test on your own data before risking real money.
This script is for educational purposes only and is not financial advice.
🚀 Quick-start guide
Add the script to your chart
Use an intraday timeframe ≤ 15 minutes (1m, 3m, 5m, 15m).
Works best on liquid indices, futures, FX and large-cap stocks.
Set the Morning Range
In “Morning Range Session” choose the exchange’s opening window.
Examples
US index futures (CME): 08:30–08:45 or 08:30–08:35
US stocks (NYSE/Nasdaq): 09:30–09:45 or 09:30–09:35
The ORB is always calculated on 1-minute data internally, so the range stays accurate on higher intraday charts.
Keep the default filters at first
HTF Trend Filter: ON
EMA length = 20
This will only allow trades in the direction of the dominant D/W/M trend.
ATR Filter: OFF (optional; you can enable later once you’re comfortable).
Use the full trade system
In the FVG group leave
“Enable FVG entry signals, boxes & alerts” = ON
Entry mode: Mid
Stop mode: FVG Candle or PrevBar
Risk/Reward: 2.0 as a starting point.
Set your risk
Turn on “Calculate position size”.
Enter your Account size and choose either:
Risk mode = Percent (e.g. 1.0 = 1% per trade), or
Risk mode = Fixed amount (e.g. $250 per trade).
The risk info label will show:
Stop distance in price and $/contract
Max allowed risk
Suggested mini and micro contract size.
Enable alerts (optional)
Open the Alerts dialog → Condition: this script.
Choose one of:
Long entry FVG breakout
Short entry FVG breakout
FVG entry (long/short)
Choose “Once per bar” or “Once per bar close”, and your preferred notification type.
Replay & journal
Use the TradingView bar replay tool to step through past days.
Focus on:
How the ORB defines the structure.
How the first confirmed FVG outside the ORB behaves.
Whether the risk/TP levels fit your own style and product.
🎛 Recommended settings & profiles
These are starting points, not rules. Always adapt to the instrument and your own risk tolerance.
1. Conservative / Trend-following
Timeframe: 5m or 15m
Morning Range Session: 15-minute ORB around the cash or futures open
FVG
Threshold %: 0.05–0.1 (filter out very small gaps)
Auto threshold: OFF (keep it simple)
Allow breakout FVG partly inside ORB: OFF
Enable FVG entry signals/boxes/alerts: ON
Entry mode: Mid
Stop Logic
Stop mode: Pivot
Pivot left/right: 2–3
Stop buffer: +1–2 ticks
HTF Trend Filter
Enabled: ON
EMA length: 20
ATR Filter
Enabled: ON
Daily ATR length: 14
Min ORB vs ATR: 0.3–0.4
Max ORB vs ATR: 1.2–1.5
Risk Management
Risk mode: Percent
Account risk: 0.5–1.0%
Idea: Only trade when the higher-timeframe trend supports the move and the opening range is of a “normal” size for the current volatility.
2. Balanced / Intraday directional
Timeframe: 3m or 5m
FVG
Threshold %: 0.02–0.05
Auto threshold: ON (lets the script adapt to volatility)
Allow breakout FVG partly inside ORB: ON
(first breakout FVG may partly sit inside the ORB)
Entry mode: Edge
Edge offset (ticks): 0 or +1
Stop Logic
Stop mode: FVG Candle
Stop buffer: 0–1 ticks
HTF Trend Filter
Enabled: ON
ATR Filter
Enabled: OFF (optional)
Risk Management
Risk mode: Percent
Account risk: 1.0–1.5% (if this fits your plan)
Idea: Slightly more aggressive entries at the gap edge, still aligned with HTF trend, but with more flexibility on ATR.
3. Aggressive / Scalping around the ORB
Timeframe: 1m or 3m
FVG
Threshold %: 0.0–0.02
Auto threshold: ON
Allow breakout FVG partly inside ORB: ON
Entry mode: NextOpen or Edge with a negative offset (deeper into the gap)
Stop Logic
Stop mode: PrevBar
Stop buffer: 0 or -1 tick
HTF Trend Filter
Enabled: OFF (or ON but treat as soft guidance)
ATR Filter
Enabled: OFF
Risk Management
Risk mode: Percent
Account risk: lower, e.g. 0.25–0.5% per trade
Idea: More trades and tighter stops. Best for experienced traders who understand the limitations of scalping and whipsaw risk.
Final reminder
All of these are templates, not guarantees:
Always check how the system behaves on your market and session.
Start on replay and demo before trading real money.
Adjust filters (HTF, ATR, thresholds) until the signals fit your personal approach.

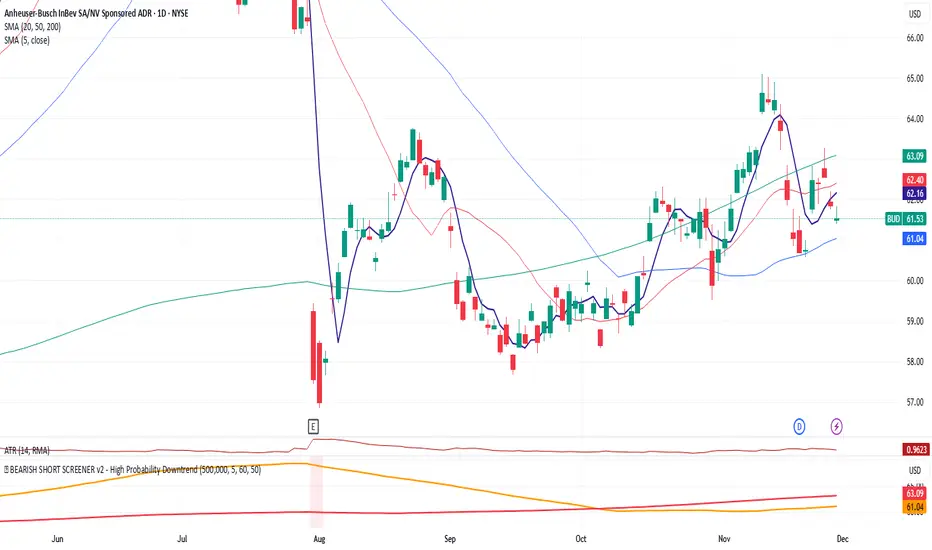
🐻 BEARISH SHORT SCREENER v2 - High Probability DowntrendScreener helps identify stocks below 20, 50, and 200 day moving averages with a strong probability of a continued downtrend.
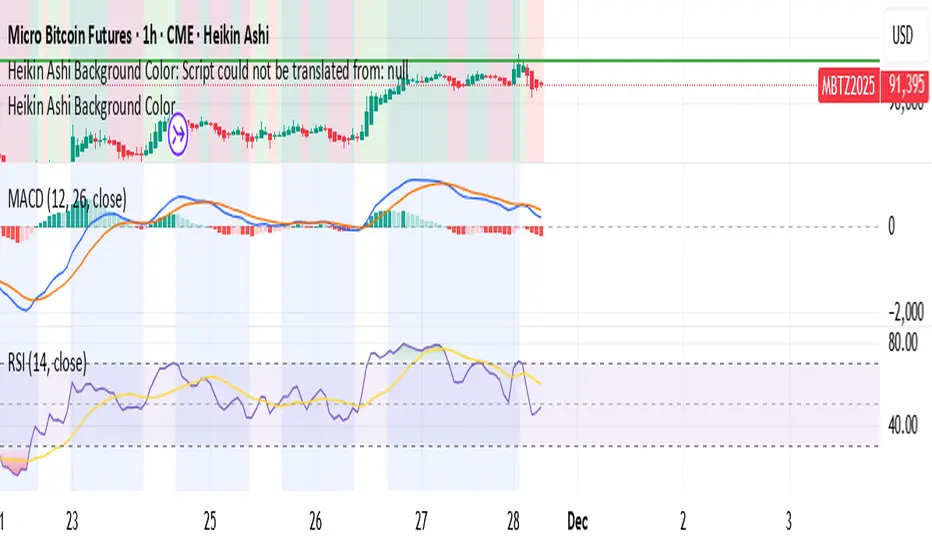
Heikin Ashi Background ColorHighlights the background of traditional candle sticks with the corresponding heiken ashi candle colour in order to avoid switching back and forth between heiken ashi and traditional candle sticks

Heikin Ashi Background Color for candles highlights the back ground candle with the corresponding heiken ashi candle colour
while still showing the exact japanese candle stick price action
Crypto Signals & Overlays –29-11-2025Nebula Crypto Signals & Overlays
Nebula is a multi-timeframe trend and momentum indicator designed for high-cap crypto pairs (BTC, ETH, SOL, DOGE, etc.).
• Uses 21/50/200 EMAs + higher-timeframe EMA for trend filtering
• RSI and Bollinger Bands for momentum and squeeze detection
• Generates BUY/SELL labels on trend-side pullbacks
• ATR line as a dynamic stop/target guide, plus pivot-based support/resistance zones
• Background colors: green = bullish regime, red = bearish regime, yellow = low-volatility squeeze
Not financial advice. Always backtest and use proper risk management before trading live.

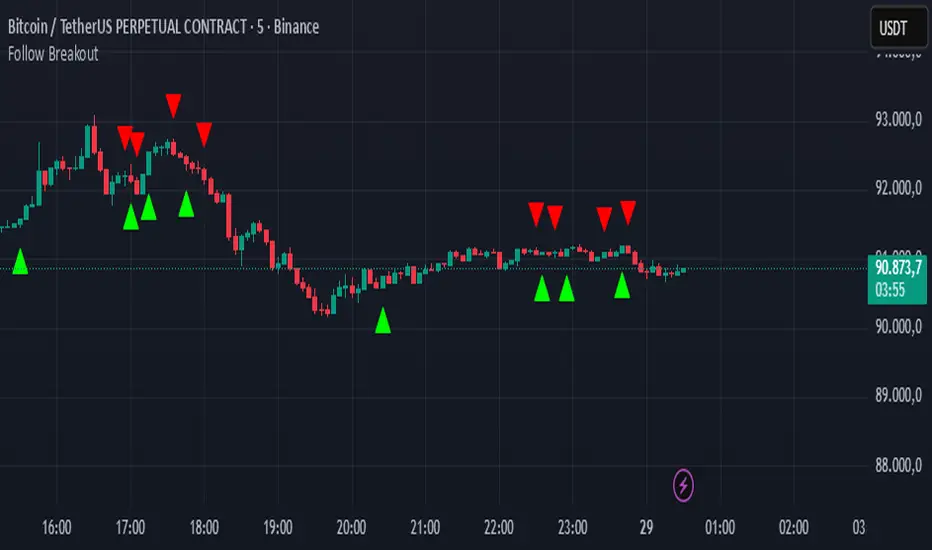
Follow BreakoutThe indicator tracks trend breakouts. It generates multiple signals during sideways trends.
Daily Protocol [#] by @shulktrades@shulktrades aka Shulkins aka shulk
Open Source Script created from the code “ICT Everything” by @coldbrewrosh
*Adjusted Key Times and Standard Deviations to better fit my model*
Daily Protocol Indicator - Description
Overview
The Daily Protocol indicator is a comprehensive trading tool designed to help traders identify and visualize key intraday time-based levels and sessions for forex and other markets. This indicator automatically marks important market opening times, session ranges, and standard deviation projections to assist in technical analysis and trade planning.
Key Features
Time-Based Vertical Lines
Midnight Open (00:00): Marks the start of each trading day
News Open (08:30): Highlights the typical economic news release time
NY AM Open (09:30): Identifies the US equity market opening
Opening Price Lines
Midnight Opening Price: Tracks the price at market day start
News Opening Price (08:30): Shows the price level at news time
NY AM Opening Price (09:30): Displays equity market open price
Afternoon Opening Price (13:30): Optional afternoon session marker
Weekly & Monthly Opening Prices: Higher timeframe reference levels
Session Range Boxes
London Session (LNDN): 02:00-05:00 range with optional standard deviation projections
Asian Session (ASIA): 20:00-00:00 range with optional standard deviation projections
NY AM Session (NYAM): 09:30-10:00 range with optional standard deviation projections
Standard Deviation Projections
Automatically calculates and displays 1-4 standard deviation levels based on session ranges
Configurable directional display (both sides, upside only, or downside only)
Helps identify potential target zones and reversal areas
Additional Features
Day of Week Labels: Clearly marks each trading day
Customizable Timezone: Supports multiple global timezones
Historical Lines Toggle: Option to show/hide past levels for cleaner charts
Terminus Settings: Control how far price lines extend into the future
Color Customization: Full control over all colors, line styles, and widths
Range Statistics Table: Displays current session ranges and pip counts (forex only)
Best Use Cases
Identifying overnight key times and structure before market opens for NY
Planning entries around major session times
Setting targets using standard deviation projections
Understanding market structure through time-based analysis
Backtesting strategies based on session behavior
Timeframe Recommendation
Works best on intraday timeframes (1-60 minutes). The indicator automatically hides on timeframes above 61 minutes to prevent chart clutter.
Customization
Extensive settings allow traders to:
Enable/disable any individual component
Adjust all colors, line styles, and widths
Control label display and formatting
Set timezone preferences
Configure standard deviation calculations
Choose which sessions and times to display
This indicator is ideal for traders who follow time-based trading methodologies and want to incorporate structured intraday analysis into their workflow.

SNP420/INDI/support_resist_future_levelFunctionality – short description
The indicator automatically detects the latest pivot highs/lows and builds the current resistance and support levels from them. New levels start as candidate levels (dotted lines).
Using an ATR-based tolerance, it counts how many times price precisely tests and rejects the level (touch + reversal).
Once the minimum number of touches is reached, the level is marked as validated (solid line). The indicator also detects breakouts of S/R, colors breakout candles, projects a target level after the breakout, and highlights retests of the broken levels with boxes.
autor: SNP_420
project: FNXS
ps: Piece a love

Candle Identification + Cardwell Strength (w/ Slope Velocity)Identifies candle patterns pin bar, inside bar, outside bar, and shaved bars. The script also indicates the strength of the candle formation based upon Cardwell RSI principles, ADX, and price in relation to the VWAP.
The settings are available to the user to adjust for there specific style of trading.

RCV Essentials════════════════════════════════════════════
RCV ESSENTIALS - MULTI-TIMEFRAME & SESSION ANALYSIS TOOL
════════════════════════════════════════════
📊 WHAT THIS INDICATOR DOES
This professional-grade indicator combines two powerful analysis modules:
1. TRADING SESSION TRACKER - Visualizes high/low ranges for major global market sessions (NY Open, London Open, Asian Session, etc.)
2. MULTI-TIMEFRAME CANDLE DISPLAY - Shows up to 8 higher timeframes simultaneously on your chart (15m, 30m, 1H, 4H, 1D, 1W, 1M, 3M)
════════════════════════════════════════════
🎯 KEY FEATURES
════════════════════════════════════════════
TRADING SESSIONS MODULE:
✓ Track up to 6 custom trading sessions simultaneously
✓ Real-time high/low range detection during active sessions
✓ Pre-configured for NYO (7-9am), LNO (2-3am), Asian Session (4:30pm-12am)
✓ 60+ global timezone options
✓ Customizable colors, labels, and transparency
✓ Daily divider lines (optional Sunday skip for traditional markets)
✓ Only displays on ≤30m timeframes for optimal clarity
MULTI-TIMEFRAME CANDLES MODULE:
✓ Display 1-8 higher timeframes with up to 10 candles each
✓ Real-time candle updates (non-repainting)
✓ Fully customizable colors (separate bullish/bearish for body/border/wick)
✓ Adjustable candle width, spacing, and positioning
✓ Smart label system (top/bottom/both, aligned or follow candles)
✓ Automatic timeframe validation (only shows TFs higher than chart)
✓ Memory-optimized with automatic cleanup
════════════════════════════════════════════
🔧 HOW IT WORKS
════════════════════════════════════════════
TECHNICAL IMPLEMENTATION:
Session Tracking Algorithm:
• Detects session start/end using time() function with timezone support
• Continuously monitors and updates high/low during active session
• Finalizes range when session ends using var persistence
• Draws boxes using real-time bar_index positioning
• Maintains session ranges across multiple days for reference
Multi-Timeframe System:
• Uses ta.change(time()) detection to identify new MTF candle formation
• Constructs candles using custom Type definitions (Candle, CandleSet, Config)
• Stores OHLC data in arrays with automatic size management
• Renders using box objects (bodies) and line objects (wicks)
• Updates current candle every tick; historical candles remain static
• Calculates dynamic positioning based on user settings (offset, spacing, width)
Object-Oriented Architecture:
• Custom Type "Candle" - Stores OHLC values, timestamps, visual elements
• Custom Type "CandleSet" - Manages arrays of candles + settings per timeframe
• Custom Type "Config" - Centralizes all display configuration
• Efficient memory management via unshift() for new candles, pop() for old
Performance Optimizations:
• var declarations minimize recalculation overhead
• Conditional execution (sessions only on short timeframes)
• Maximum display limits prevent excessive object creation
• Timeframe validation at barstate.isfirst reduces redundant checks
════════════════════════════════════════════
📈 HOW TO USE
════════════════════════════════════════════
SETUP:
1. Add indicator to chart (works best on 1m-30m timeframes)
2. Open Settings → "Trading Sessions" group
- Enable desired sessions (NYO, LNO, AS, or custom)
- Select your timezone from 60+ options
- Adjust colors and transparency
3. Open Settings → "Multi-TF Candles" group
- Enable timeframes (TF1-TF8)
- Configure each timeframe and display count
- Customize colors and layout
READING THE CHART:
• Session boxes show high/low ranges during active sessions
• MTF candles display to the right of current price
• Labels identify each timeframe (15m, 1H, 4H, etc.)
• Real-time updates on the most recent MTF candle
TRADING APPLICATIONS:
Session Breakout Strategy:
→ Identify session high/low (e.g., Asian session 16:30-00:00)
→ Wait for break above/below range
→ Confirm with higher timeframe candle close
→ Enter in breakout direction, stop at opposite side of range
Multi-Timeframe Confirmation:
→ Spot setup on primary chart (e.g., 5m)
→ Verify 15m, 1H, 4H candles align with trade direction
→ Only take trades where higher TFs confirm
→ Exit when higher TF candles show reversal
Combined Session + MTF:
→ Asian session establishes range overnight
→ London Open breaks Asian high
→ Confirm with bullish 15m + 1H candles
→ Enter long with stop below Asian high
════════════════════════════════════════════
🎨 ORIGINALITY & INNOVATION
════════════════════════════════════════════
What makes this indicator original:
1. INTEGRATED DUAL-MODULE DESIGN
Unlike separate session or MTF indicators, this combines both in a single performance-optimized script, enabling powerful correlation analysis between session behavior and timeframe structure.
2. ADVANCED RENDERING SYSTEM
Uses custom Pine Script v5 Types with dynamic box/line object management instead of basic plot functions. This enables:
• Precise visual control over positioning and spacing
• Real-time updates without repainting
• Efficient memory handling via automatic cleanup
• Support for 8 simultaneous timeframes with independent settings
3. INTELLIGENT SESSION TRACKING
The algorithm continuously recalculates ranges bar-by-bar during active sessions, then preserves the final range. This differs from static zone indicators that simply draw fixed boxes at predefined levels.
4. MODULAR ARCHITECTURE
Custom Type definitions (Candle, CandleSet, Config) create extensible, maintainable code structure while supporting complex multi-timeframe operations with minimal performance impact.
5. PROFESSIONAL FLEXIBILITY
Extensive customization: 6 configurable sessions, 8 timeframe slots, 60+ timezones, granular color/sizing/spacing controls, multiple label positioning modes—adaptable to any market or trading style.
6. SMART VISUAL DESIGN
Automatic timeframe validation, dynamic label alignment options, and intelligent spacing calculations ensure clarity even with multiple timeframes displayed simultaneously.
════════════════════════════════════════════
⚙️ CONFIGURATION OPTIONS
════════════════════════════════════════════
TRADING SESSIONS:
• Session 1-6: On/Off toggles
• Time Ranges: Custom start-end times
• Labels: Custom text for each session
• Colors: Individual color per session
• Timezone: 60+ options (Americas, Europe, Asia, Pacific, Africa)
• Range Transparency: 0-100%
• Outline: Optional border
• Label Display: Show/hide session names
• Daily Divider: Dotted lines at day changes
• Skip Sunday: For traditional markets vs 24/7 crypto
MULTI-TF CANDLES:
• Timeframes 1-8: Enable/disable individually
• Timeframe Selection: Any TF (seconds to months)
• Display Count: 1-10 candles per timeframe
• Bullish Colors: Body/Border/Wick (independent)
• Bearish Colors: Body/Border/Wick (independent)
• Candle Width: 1-10+ bars
• Right Margin: 0-200+ bars from edge
• TF Spacing: Gap between timeframe groups
• Label Color: Any color
• Label Size: Tiny/Small/Normal/Large/Huge
• Label Position: Top/Bottom/Both
• Label Alignment: Follow Candles or Align
════════════════════════════════════════════
📋 TECHNICAL SPECIFICATIONS
════════════════════════════════════════════
• Pine Script Version: v5
• Chart Overlay: True
• Max Boxes: 500
• Max Lines: 500
• Max Labels: 500
• Max Bars Back: 5000
• Update Frequency: Real-time (every tick)
• Timeframe Compatibility: Chart TF must be lower than selected MTFs
• Session Display: Activates only on ≤30 minute timeframes
• Memory Management: Automatic cleanup via array operations

Smart MACD Divergence ScannerOriginal Base Indicator: "CM_MacD_Ult_MTF" by ChrisMoody
This indicator builds upon ChrisMoody's excellent multi-timeframe MACD foundation and transforms it into a professional divergence scanner with advanced quality assessment and filtering capabilities. The original MACD visualization and MTF functionality have been preserved while adding completely new divergence detection, scoring, and filtering systems.
🎯 What Makes This Indicator Unique:
Smart MACD Divergence Scanner is a professional tool for detecting MACD-based divergences with an advanced filtering system and signal quality assessment. Unlike standard divergence indicators, this version includes innovative features:
Adaptive Quality Scoring System — each signal receives a score from 0 to 100 based on multiple factors
Volatility Filter — automatic signal suppression during low market volatility periods
Multi-Timeframe Confirmation — divergence verification on higher timeframe for increased reliability
Divergence Strength Analysis — calculation of percentage difference between price and indicator movement
Information Dashboard — detailed real-time signal statistics
Cooldown System — prevention of multiple consecutive signals
💡 How It Works:
The indicator uses the classic divergence concept — the divergence between price movement and the MACD oscillator. However, instead of simple pivot detection, the algorithm:
Scans the market for local extremes (pivots) on price and MACD histogram
Searches for divergences — when price updates low/high while MACD shows opposite movement
Assesses quality — analyzes divergence strength, volatility, higher timeframe confirmation
Filters noise — eliminates weak signals through threshold system and cooldown
Generates signal — only when all quality criteria are met
🔧 Key Parameters:
MACD Settings: Fast Length (12), Slow Length (26), Signal Length (9)
Divergence Detection: Pivot Lookback (5), Max Lookback Range (60), Min Divergence Strength (15%)
Quality Filters: Min Quality Score (60), Volatility Filter, MTF Confirmation, Signal Cooldown (5)
📊 How to Use:
Add indicator to chart — it will automatically start scanning
Configure filters — start with default settings, then adapt to your trading style
Watch for signals: 🟢 Green "BUY" label = bullish divergence, 🔴 Red "SELL" label = bearish divergence
Check quality score on labels (Q: XX)
Use information panel to monitor statistics and current market conditions
⚙️ Settings Guide:
For swing trading (4H-Daily): Increase Pivot Lookback to 7-10, set Min Quality Score to 70+
For day trading (15m-1H): Keep default settings, enable all filters
For scalping (1m-5m): Decrease Min Quality Score to 50, disable MTF Confirmation
For volatile markets (crypto): Increase Min Divergence Strength to 20-25%, enable Volatility Filter
⚠️ Important Notes:
Divergences are probabilistic signals, not guaranteed reversals
Use additional confirmation (support/resistance levels, volume, price action)
Adjust parameters for specific asset and timeframe
Signals appear with Pivot Lookback bars delay (retrospective confirmation)
On volatile markets, increase Min Quality Score to reduce false signals

Perfect Opens Perfect BoxesThis approach combines two methods of chart denoising:
1. The underlying chart uses the previous close as the open price for the next candle, which makes candlestick patterns easier to read.
2. The overlay reduces the visual noise of a line chart by representing the price range over a given interval as a box; the “wicks” on this chart are purely cosmetic, indicating that closing prices lay outside the range of the previous interval.

ETH MASTER v1ETH MASTER v1 is a comprehensive indicator designed specifically for Ethereum trend tracking, cost analysis, and momentum evaluation.
It combines multiple analytical layers into a clean, easy-to-read system suitable for both beginners and experienced traders.
Features
✔ EMA Trend System
Plots EMA20 and EMA50
Generates Bull Cross and Bear Cross labels when EMA20 crosses above or below EMA50
Helps identify short–mid term trend direction shifts
✔ Average Cost Line
Displays the user-defined average entry price
When price drops below the average cost, a risk warning background is activated
✔ Trend Background Coloring
Green background during bullish conditions
Red background during bearish conditions
Dark-red background when price is below the user’s cost (high-risk zone)
✔ Trend Power (0–100 Score)
A normalized momentum score derived from the distance between EMA20 and EMA50
Higher values = stronger trend
Lower values = weaker momentum or consolidation
✔ Built-in Alert Conditions
Bull Cross Alert: EMA20 crosses above EMA50
Bear Cross Alert: EMA20 crosses below EMA50
Below Cost Alert: Price falls under the average cost
Purpose
ETH MASTER v1 provides a clear, structured view of Ethereum’s market behavior.
It simplifies trend analysis, identifies momentum shifts, and highlights risk zones.
Ideal for long-term ETH tracking, portfolio monitoring, and disciplined trading strategies.
