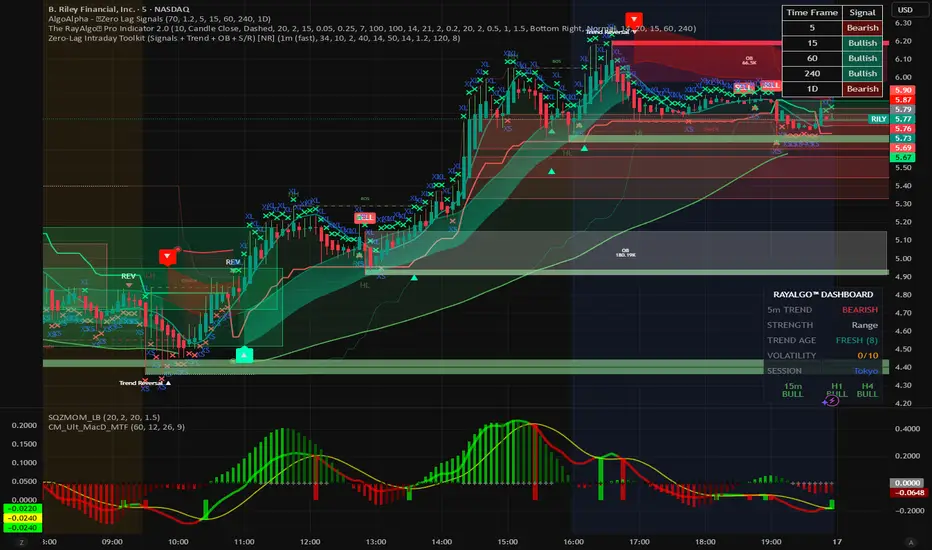
ZERO-LAG Tabrizi Scalping ToolKit This indicator will allow you to scalp on the 1M and 5M chart with zero lag. We will show you trend reversals and also when to buy and sell
Candlestick analysis
ChanLun Structure: K/Fractals/Strokes/Segments/ZhongShuThis script implements the "line and center" concept of CHANLUN.
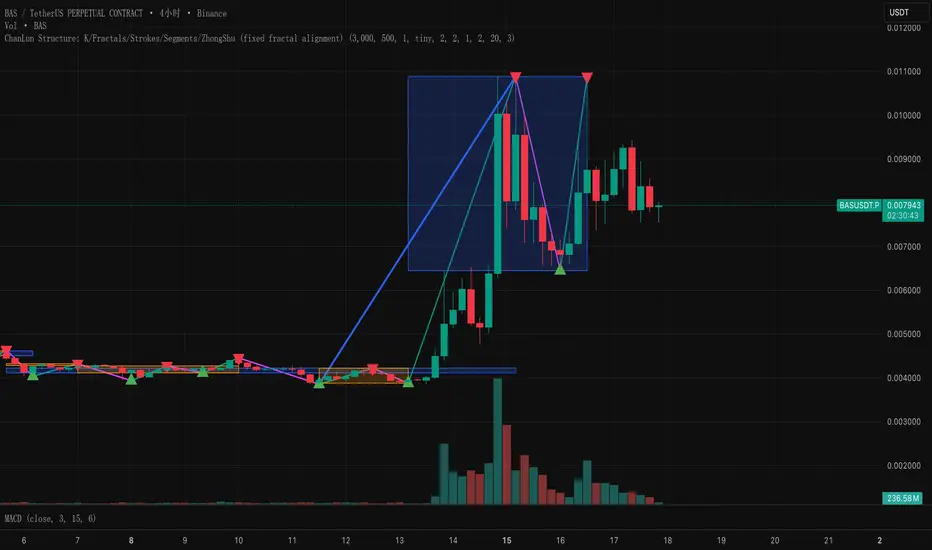
Bar CountCount K bars based on sessions
Support at most 3 sessions
Customize the session's timezone and period
Set steps between each number
Use with the built-in Trading Session indicator is a great convenience

Trend SignalSystem Trend Signal — What It Does
Shows you when your trading system says "be long" vs "stay out" — with a trailing line and buy/sell labels only when the state flips.
The Rules Built In:
BUY state requires ALL of these:
Price above 50-DMA (intermediate trend up)
10-DMA above 20-DMA (short-term trend confirmed)
Sell/Buy Pressure Ratio below 1.5 AND flattening or falling (sellers not aggressive)
RSI above 30 and not making lower lows (momentum OK)
SELL state triggers on ANY of these :
Price drops below 50-DMA (trend broken)
Pressure Ratio spikes above 2.0 (heavy selling)
RSI making lower lows AND below 40 (momentum failing)
What You See:
"Buy" label appears only when state flips from sell → buy
"Sell" label appears only when state flips from buy → sell
No spam. One label per flip.
The Trailing Line:
Uses ATR to set distance from price.
In buy state: line = close - (ATR × 2.0), ratchets up only
In sell state: line = close + (ATR × 2.0), ratchets down only

ICT MTF FVG BPR Toolkit [D4A}The ICT MTF FVG BPR Toolkit encompasses the following 5 components:
- Fair Value Gaps - current timeframe
- Fair Value Gaps - higher timeframe
- BPR - Balanced Price Range
- Long Wicks - which are considered to be gaps by ICT
- Immediate Rebalance - it leaves no gaps, but is as important in assessing current workflow
This is advanced Fair Value Gaps script that uses trading methodology taught by ICT trader. To use it effectively it requires at least some basic knowledge of Smart Money Concepts (SMC) as outlined in ICT's lectures found on YT. I may publish another SMC related scripts in future if this kind of tool is useful to anybody.
The idea behind this work, is to have all the necessary tools related to Fair Value Gaps in one script that is easy to use (requires SMC knowledge), fully customizable and will keep the chart as clutter free as possible. Since, I could not find a ready-made script which would tick all my requirements, I created this new script, partially by borrowing some ideas and code from existing open source projects that I liked. Rather than re-inventing the wheel, I focused on adopting and improving existing solutions and have them work together in one tool that could present the information accurately and in a polished way, where the trader can customize almost everything. Full credit goes to other coders, who tackled this subject before me, but particularly to:
QuantVue
LuxAlgo
pmk07
The script have these unique features:
- Can present FVGs from up to 3 different timeframes at any given interval
- The amount and interval of higher timeframe FVGs is fully customizable
- FVGs can be displayed based on size
- Volume Imbalance can be included as part of FVG (as recommended by ICT)
- Higher timeframe FVGs can have quadrants displayed along with C.E. (based on ATR filter)
- Both current and higher timeframe FVGs can be displayed in different ways depending on price interactions
- BPR which works on current timeframe only
- Long Wick detection logic has been slightly changed from the original LuxAlgo code
- Immediate Rebalance code has been simplified and re-focused on clarity
-----------------
Disclaimer
The information contained in my Scripts/Indicators/Ideas/Algos/Systems does not constitute financial advice or a solicitation to buy or sell any securities of any type. I will not accept liability for any loss or damage, including without limitation any loss of profit, which may arise directly or indirectly from the use of or reliance on such information.
All investments involve risk, and the past performance of a security, industry, sector, market, financial product, trading strategy, backtest, or individual's trading does not guarantee future results or returns. Investors are fully responsible for any investment decisions they make. Such decisions should be based solely on an evaluation of their financial circumstances, investment objectives, risk tolerance, and liquidity needs.
My Scripts/Indicators/Ideas/Algos/Systems are only for educational purposes!

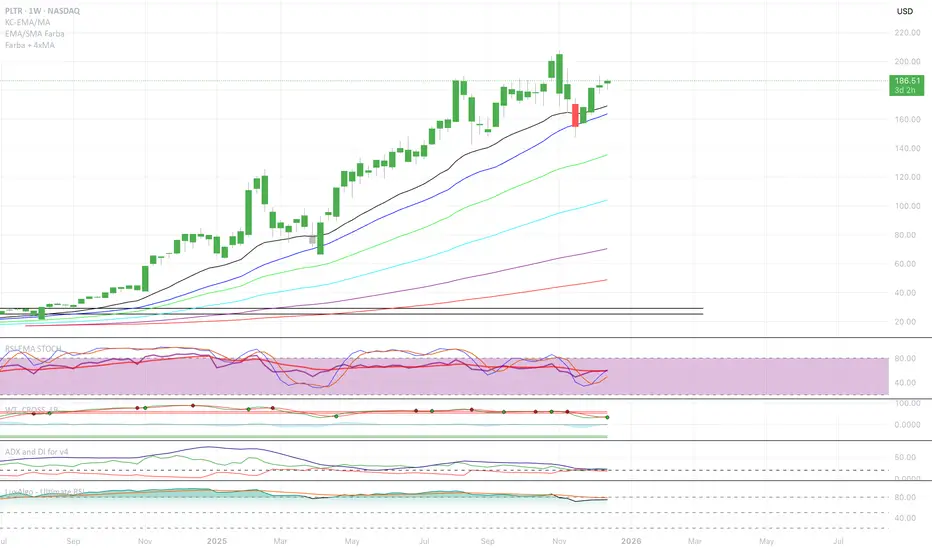
EMA/SMA Full color signal candles💡 What It Does:
The indicator calculates and plots the 21-period Exponential Moving Average (EMA) and the 30-period Simple Moving Average (SMA). It then analyzes the closing price of each candle and colors the entire candlestick (body and border) according to pre-defined trend conditions.
This visualization allows traders to identify strong trend environments versus periods of consolidation or indecision at a glance, removing the need to constantly check the price relationship manually.
🎨 Color Conditions and Meaning:
The indicator uses three distinct color states to signal the market's current momentum:
Color,Condition,Market Interpretation
🟢 GREEN,Closing Price is ABOVE both the 21 EMA AND the 30 SMA.,Strong Bullish Trend: Suggests high momentum and confirmation of an uptrend. Ideal for long bias.
🔴 RED,Closing Price is BELOW both the 21 EMA AND the 30 SMA.,Strong Bearish Trend: Suggests high downward pressure and confirmation of a downtrend. Ideal for short bias.
⚫ GRAY,"Closing Price is in any other state (e.g., between the two MAs, or under one and over the other).","Neutral / Consolidation: Indicates uncertainty, low momentum, or potential trend exhaustion/reversal. Caution is advised."
🔧 Customization Options:The indicator is fully customizable, allowing users to fine-tune the periods to match their preferred trading style (e.g., scalping, swing trading).Dĺžka EMA (Length EMA): Allows you to change the period for the Exponential Moving Average (default is 21).Dĺžka SMA (Length SMA): Allows you to change the period for the Simple Moving Average (default is 30).
I added also Extra 4 EMA lines to have extra edge.
Consolidation Zones Volume Delta | Flux ChartsGENERAL OVERVIEW:
The Consolidation Zones Volume Delta | Flux Charts indicator is designed to identify and visualize consolidation zones on the chart. Rather than only outlining areas of sideways price movement, the indicator analyzes volume activity occurring inside each consolidation zone. This is done by aggregating lower-timeframe volume data into the higher-timeframe consolidation range, allowing users to see how buying and selling activity evolves while price remains in a range.
What is the theory behind the indicator?:
The indicator is built around three core analytical concepts that guide how consolidation zones are detected and evaluated.
1. Consolidation as a structural phase
Periods of consolidation are characterized by reduced directional movement and compressed price ranges. During these phases, price action often alternates within a defined high–low boundary, creating a structure that can be objectively measured and tracked over time.
2. Volume behavior inside consolidation
While price may appear balanced within a consolidation range, volume activity inside that range can vary. The indicator evaluates volume contributions occurring within the vertical boundaries of the consolidation zone by using lower-timeframe data and weighting each candle’s volume based on its overlap with the zone. This produces an internal volume delta profile that reflects how buying and selling volume accumulates throughout the consolidation.
Delta behavior inside a zone may show:
Persistent dominance of buying or selling volume
Alternating shifts between buyers and sellers
Periods of relatively balanced participation
3. Markets consolidate in multiple ways, one detection method is not enough
Markets do not consolidate in a single, uniform way. To account for this, the indicator includes three distinct consolidation detection methods. Each method is calculated objectively, does not repaint, and targets a different type of sideways or low-expansion price behavior:
Candle Compression
ADX Low Trend Strength
Visual Range Boundaries
CONSOLIDATION ZONES VOLUME DELTA FEATURES:
The Consolidation Zones Volume Delta indicator includes 4 main features:
Consolidation Zones
Volume Delta
Standard Deviation Bands
Alerts
CONSOLIDATION ZONES:
🔹What is a Consolidation Zone?
A consolidation zone is a defined price range where market movement becomes compressed and price remains contained within clear upper and lower boundaries for a sustained period of time. During this phase, price does not establish a strong directional trend and instead oscillates within a relatively narrow range.
🔹Consolidation Zone Detection
The indicator automatically detects consolidation zones using three independent, rule-based methods. Each method evaluates a different market condition and can be selected individually depending on how you want consolidation to be defined. Regardless of the method used, all zones are calculated objectively and finalized once confirmed.
◇ Candles (Candle Compression)
The Candles method identifies consolidation by detecting periods of candle compression and reduced range expansion. A candle is considered part of a consolidation sequence when:
The candle body is small relative to its total range
The candle’s high–low range is smaller than the short-term Average True Range (ATR)
ATR is calculated using a 4-period average true range and is used as a volatility reference. If consecutive candles continue to meet these compression conditions, the indicator increments an internal count.
Under the Consolidation Candles section in the settings, you’ll find two controls.
Min. Consolidation Candles setting
This defines how many consecutive compressed candles are required before a consolidation zone is confirmed. Candle compression is determined using candle structure and short-term ATR, ensuring that only periods of reduced range expansion are counted. Once the minimum threshold is reached, the indicator creates a consolidation zone using the highest high and lowest low formed during the compressed sequence.
Mark Consolidation Candles
When enabled, the indicator highlights candles that meet the compression criteria, making it easy to visually identify which candles contributed to the formation of the consolidation zone.
◇ ADX (Low Trend Strength)
The ADX method identifies consolidation based on weak or declining trend strength rather than candle structure. This method uses the Average Directional Index (ADX) to determine when directional movement is reduced.
ADX is calculated using directional movement values that are smoothed over time. When ADX remains below a user-defined threshold, price is treated as being in a low-trend market. While this condition persists, the indicator tracks the highest high and lowest low formed during the low-trend period.
Under the ADX Settings section in the settings, you’ll find the following controls.
ADX Length
Defines the lookback period used to calculate directional movement for ADX.
ADX Smoothing
Controls the smoothing applied to the ADX calculation.
ADX Threshold
Sets the level below which ADX must remain for the market to be considered consolidating.
Consolidation Strength
Defines how many consecutive candles’ ADX must stay below the threshold before a consolidation zone is confirmed. Once this requirement is met, the indicator creates a consolidation zone using the accumulated high and low from the low-trend window.
Mark Candles Below Threshold
When enabled, the indicator highlights candles where ADX remains below the threshold.
◇ Visual Range
The Visual Range method identifies consolidation by detecting clearly defined horizontal price ranges where price remains contained for a sustained period of time. The indicator continuously tracks the rolling highest high and lowest low across recent candles. When price remains inside the same high–low boundaries without breaking above or below the range, an internal counter advances.
Under the Visual Range section in the settings, you’ll find the following control.
Min. Candles in Range
Defines how many consecutive candles must remain fully contained within the same high–low range before a consolidation zone is confirmed. Once this requirement is met, the indicator creates a consolidation zone using the established range boundaries.
🔹Consolidation Zone Settings
◇ Invalidation Method
Users can choose how Consolidation Zones are invalidated, selecting between Close Break or Wick Break.
Close Break: A Consolidation Zone is invalidated when a candle closes above/below the zone.
Wick Break: A Consolidation Zone is invalidated when a candle’s wick goes above/below the zone.
◇ Merge Overlapping Zones
When enabled, overlapping Consolidation Zones are automatically combined into one unified zone.
◇ Show Last
This setting determines how many Consolidation Zones are displayed on your chart. For example, setting this to 5 will display the 5 most recent zones.
VOLUME DELTA:
Delta Volume visualizes how buying and selling volume accumulates inside each consolidation zone. Instead of using the full candle volume, the indicator isolates only the volume that occurs within the vertical boundaries of the zone. This allows you to see whether bullish or bearish volume is dominating while price remains range-bound. The visualization updates in real time while the zone is active and reflects cumulative participation rather than individual candles.
🔹How Volume Delta is Calculated
Delta Volume is calculated using lower-timeframe data and applied to the higher-timeframe consolidation zone.
Each candle’s volume is split into bullish or bearish volume based on candle direction.
Lower-timeframe candles are pulled using the selected delta timeframe.
For each lower-timeframe candle, only the portion of volume that vertically overlaps the consolidation zone is counted.
Volume is weighted by the amount of overlap between the candle’s range and the zone’s range.
Bullish and bearish volume are accumulated over time to form a running, cumulative delta profile for the zone.
🔹Volume Delta Settings
◇ Enable
Turns the Delta Volume visualization on or off. Consolidation zones continue to plot when disabled.
◇ Show Delta %
Displays the percentage breakdown of bullish versus bearish volume inside the consolidation zone. Percentages are derived from cumulative volume totals.
◇ 3D Visual
When enabled, the delta blocks are extended diagonally using a depth offset derived from the instrument’s daily ATR. This creates visible side faces and top faces for the delta blocks, simulating depth without altering any calculations. The 3D effect is purely visual. It does not change how volume is calculated, weighted, or accumulated.
Users can control the intensity of the 3D effect choosing a value between 1 and 5. Increasing this value increases:
The horizontal offset of the delta blocks
The vertical depth projection applied to the volume faces
Higher values produce a more pronounced 3D appearance by pushing the delta visualization further away from the consolidation box. Lower values keep the visualization flatter and closer to the box boundaries. The depth scaling is normalized using ATR, so the effect adapts proportionally to the instrument’s volatility.
◇ Volume Delta Display Style
Controls how bullish and bearish volume are displayed inside the Consolidation Zone:
Horizontal: Volume is split top-to-bottom within the zone
Vertical: Volume is split left-to-right across the zone
◇ Timeframe
Defines the lower timeframe used for Volume Delta calculations. When a timeframe is selected, the indicator pulls lower-timeframe price and volume data and maps it into the higher-timeframe consolidation zone. Each lower-timeframe candle is evaluated individually. Only the portion of its volume that vertically overlaps the consolidation zone is included, and that volume is weighted based on the candle’s overlap with the zone’s price range. If the Timeframe field is left empty, the indicator defaults to using the chart’s current timeframe for delta calculations.
Using a lower timeframe increases the granularity of the delta calculation, allowing volume changes inside the zone to be measured more precisely. Using a higher timeframe produces a smoother, less granular delta profile.
Please Note: Delta rendering is automatically limited to available lower-timeframe data to prevent incomplete or distorted visuals when historical lower-timeframe volume is unavailable due to TradingView data limits.
STANDARD DEVIATION BANDS:
Standard Deviation Bands project measured price distance away from a confirmed consolidation zone using the size of that zone as the reference unit. Rather than calculating volatility from historical price dispersion, the bands are derived directly from the height of the consolidation range itself. Each band represents a fixed multiple of the consolidation zone’s height and is plotted symmetrically above and below the zone.
🔹How the bands are calculated
Once a consolidation zone is finalized, the indicator calculates the zone height as:
Zone Height = Zone High − Zone Low
This value becomes the base measurement for all deviation calculations. For each enabled band:
Upper bands are placed above the consolidation zone’s high
Lower bands are placed below the consolidation zone’s low
The distance of each band from the zone is calculated by multiplying the zone height by the selected band multiplier. These band levels are fixed relative to the consolidation zone and do not recalculate based on future price movement.
🔹Standard Deviation Band Settings
◇ Band 1
Enables the first deviation band above and below the consolidation zone. The Band 1 multiplier defines how far the band is placed from the zone in terms of zone height. For example, a multiplier of 1 plots the band one full zone height above and below the consolidation range.
◇ Band 2
Enables a second deviation band at a greater distance from the consolidation zone. Band 2 uses its own multiplier and is calculated independently of Band 1, allowing multiple expansion levels to be displayed simultaneously.
◇ Fill Bands
When enabled, the area between the consolidation zone and each deviation band is filled with a semi-transparent color. Upper fills apply to bands above the zone, and lower fills apply to bands below the zone. Fills are static and tied directly to the consolidation zone boundaries.
◇ Color Customization
Each deviation band has independent color controls for:
Upper band lines and fills
Lower band lines and fills
This allows users to visually distinguish between bullish and bearish extensions as well as between multiple deviation levels.
ALERTS:
Users can create alerts for the following:
New Consolidation Zone Formed
Consolidation Zone Break
UNIQUENESS:
This indicator combines multiple consolidation detection methods with lower-timeframe volume delta analysis inside each consolidation zone. It visualizes bullish and bearish volume using weighted overlap logic and optional 3D rendering for improved clarity. Users can choose how volume is displayed, apply structure-based deviation bands, and enable alerts for new zones and zone breaks. All features are rule-based, configurable, and designed to work together within a single framework.

Highlighted Range (3 Sessions)3 session customizable range. All one color customizable for simplicity.

Advanced Demand ZoneThis indicator automatically identifies strong demand zones based on swing lows followed by significant bullish reactions. It is designed for 4H timeframe and crypto trading (BTC, ETH, altcoins).
Key Features:
Automatically draws clear demand zones for better visual analysis.
Filters out weak impulses to reduce false zones.
Sends alerts when price enters a demand zone.
Transparent zones that do not clutter your chart.
Fully customizable parameters: swing lookback, impulse threshold, and zone transparency.
This tool helps traders quickly spot high-probability buy areas while allowing manual confirmation with price action, making it perfect for swing and intraday trading.

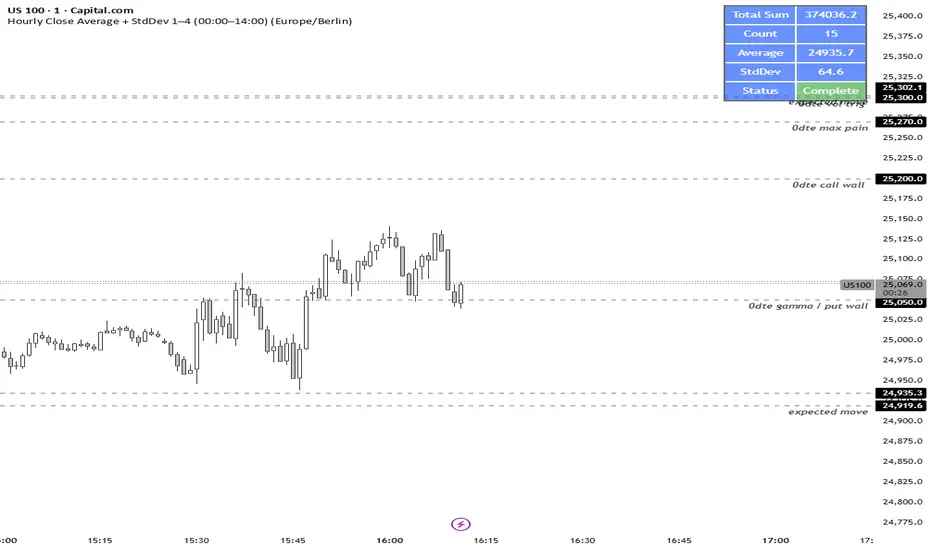
Key Levels: Volume Profile POCProfessional Intraday Key Levels (CST)
This is a comprehensive, institutional-grade Pine Script indicator designed for intraday traders (Futures, Stocks, Options) operating in the Central Time Zone. It automatically plots the most significant support and resistance levels used by algorithms and professional desks.
1. Core Levels Monitored
Daily Levels: Previous Day High (PDH), Low (PDL), Open, Close, and the 50% Midpoint (Equilibrium).
Volume Profile POC: Unlike standard indicators that use a simple average, this calculates the Volume Weighted Average Price (VWAP) of the previous day to determine the true "Fair Value" or Point of Control. Plotted with a thicker, distinct purple line.
Weekly Magnets: Previous Week High (PWH) and Low (PWL), which often act as major targets for breakouts or reversals.
Pre-Market Data: Tracks the High and Low established between 03:00 AM – 08:30 AM CST.
Opening Range (OR): Automatically captures the High and Low of the first 60 minutes of the regular session (08:30 AM – 09:30 AM CST).
2. Smart Visualization Features
Anti-Overlap Labels: If two levels (e.g., Pre-Market High and Previous Day High) are within 0.02% of each other, the script automatically merges them into a single label (e.g., "PDH & Pre-Market High") to prevent chart clutter.
Source Tracing: Trace lines extend backward from the current price level to the exact candle where that High or Low was formed (for Pre-Market and Opening Range levels), giving you instant context on when the level was created.
Clean Readability: Labels are displayed in bold, solid text without price numbers, ensuring a clean chart that focuses on level identification rather than data overload.
3. Technical Precision
Time Zone Locked: Hardcoded to America/Chicago to ensure Pre-Market and Opening Range calculations remain accurate regardless of your local computer settings.
Non-Repainting: Daily and Weekly levels are locked using closed-candle data (lookahead_on), ensuring lines do not shift during the trading day.
Buffer Safe: Optimized drawing logic prevents historical buffer errors, even on lower timeframes (1m/5m).
4. Customization
Toggle Everything: Every single level has an individual "Show/Hide" checkbox in the settings.
Label Sizing: Adjustable text size (Tiny to Huge) and offset positioning.
Compact Mode: Option to switch between full names ("Previous Day High") and abbreviations ("PDH").


GS Volume Truth Serum (With Alerts)this tells you when institutions are behind a move and its not a bull trap

HMA & RSI Delta Hybrid SignalsA lag-free trend follower combining Hull Moving Average (HMA) with RSI Momentum Delta to filter false signals and catch high-probability reversals.
# 🚀 HMA & RSI Delta Hybrid Signals
This indicator represents a hybrid approach to trend trading by combining the smoothness of the **Hull Moving Average (HMA)** with the explosive detection capabilities of **RSI Momentum Delta**.
Unlike standard indicators that rely solely on price crossovers, this tool confirms the trend direction with the *velocity* of the price change (Momentum Delta), reducing false signals in choppy markets.
### 🧠 How It Works?
**1. Trend Detection (HMA):**
The script uses the **Hull Moving Average**, known for being extremely fast and lag-free, to determine the overall market direction.
* **Orange Line:** Represents the HMA Trend. The slope determines if we are in an Uptrend or Downtrend.
**2. Momentum Confirmation (RSI Delta):**
Instead of looking at raw RSI levels (like 70 or 30), this algorithm calculates the **"Delta"** (Absolute change from the previous bar).
* It asks: *"Is the price moving in the trend direction with enough speed?"*
* If the RSI jumps significantly (determined by the `Delta Threshold`), it confirms a strong entry.
### 🎯 Signal Modes (Sensitivity)
You can choose between two modes depending on your trading style:
* **🛡️ Conservative Mode (Default):**
* Strict filtering.
* Requires the Trend to match the HMA direction AND the RSI Delta to exceed the specific threshold (e.g., 0.8).
* *Best for:* Avoiding false signals in sideways markets.
* **⚔️ Aggressive Mode:**
* Faster entries.
* Requires the Trend to match the HMA direction AND any positive momentum change in RSI.
* *Best for:* Scalping or catching the very beginning of a move.
### ✨ Key Features
* **Non-Repainting Signals:** Once a bar closes, the signal is fixed.
* **Non-Repeating:** It will not spam multiple "BUY" signals in a row; it waits for a trend change or reset.
* **Visual Trend:** Background color changes based on the HMA slope (Green for Bullish, Purple for Bearish).
* **Fully Customizable:** Adjust HMA length, RSI period, and Delta sensitivity.
---
**⚠️ DISCLAIMER:** This tool is for educational and analytical purposes only. Always manage your risk.
Plan Your Trade, Trade Your Plan. Levels. - by TenAMTrader📍 Plan Your Trade, Trade Your Plan. Levels. — by TenAMTrader
Successful trading is rarely about predicting — it’s about preparing.
"Plan Your Trade, Trade Your Plan. Levels" is designed to bridge the gap between analysis and execution by forcing clarity before the trade ever happens. Instead of reacting to price in real time, this tool encourages traders to define their plan, map their key levels, and then simply trade what they already decided.
🧠 Why Planning Matters
Most trading mistakes don’t come from bad analysis — they come from abandoning a plan mid-trade. Emotions take over when levels aren’t clearly defined ahead of time.
This indicator is built around a simple philosophy:
Make the plan first. Trade the plan second.
By writing your thesis directly into the indicator and visually anchoring it to price, you remove ambiguity and hesitation when the market starts moving.
📊 What This Indicator Does
Converts your written trade plan or market outlook into clearly plotted price levels
Automatically identifies:
Pivot level (key decision point)
Resistance levels (above pivot)
Support levels (below pivot)
Displays contextual notes directly on the chart so you always remember why a level matters
Keeps your focus on execution, not interpretation
✍️ How to Use It
Paste your daily or weekly plan into the Input your Plan/Levels box
Let the script extract and plot the levels automatically
Observe how price behaves around predefined zones
Execute only what aligns with your original plan
No guesswork. No moving targets.
🎯 Designed For
Traders who value structure and discipline
Futures, index, and equity traders who trade key levels
Traders focused on process over prediction
⚠️ Important Disclaimer
This indicator is provided for educational and informational purposes only and does not constitute financial advice, investment advice, or a recommendation to buy or sell any security, futures contract, or financial instrument.
Trading involves substantial risk and is not suitable for all investors. Past performance is not indicative of future results. All trading decisions, risk management, and position sizing are the sole responsibility of the user.
By using this indicator, you acknowledge that TenAMTrader assumes no liability for any losses, damages, or decisions made based on its use.
Trade prepared. Trade disciplined.
"Plan Your Trade, Trade Your Plan.
— TenAMTrader

PDH/PDL (Personal)This TradingView indicator is a technical analysis tool designed to plot the Previous Day High (PDH) and Previous Day Low (PDL) levels with high accuracy. It is specifically engineered for traders who require market boundaries calculated based on the Indian Standard Time (IST) session, ensuring that day breaks are identified precisely at 12:00 AM IST regardless of the exchange's native timezone.

SCOTTGO - Buy Sell Volume📊 SCOTTGO - Buy Sell Volume Bars - Delta - Up Down Volume Bars
This indicator disaggregates the total volume traded on each bar into estimated Buying Volume and Selling Volume to visualize market pressure and dominance directly in a dedicated sub-pane.
Key Features:
Volume Disaggregation: Uses a standard formula to estimate how much of a bar's total volume was associated with upward (buying) pressure and how much was associated with downward (selling) pressure.
Visual Clarity: Plots the Buy Volume (teal, upward) and Sell Volume (red, downward) as separate columns against a transparent total volume background, allowing for quick assessment of pressure balance.
Real-Time Badge: A dynamic badge is fixed to the corner of the chart (default: Top Right) providing a numeric summary of the latest bar:
Buy %: Percentage of the bar's total volume estimated as Buying Volume.
Sell %: Percentage of the bar's total volume estimated as Selling Volume.
Delta %: The magnitude of the volume difference (Delta) as a percentage of total volume, indicating the strength of the dominant side.
Dominance Indicator: The background color of the badge changes dynamically to immediately signal whether Buying (customizable color, default: Teal) or Selling (customizable color, default: Red) pressure was dominant on the current bar.
Usage:
Traders can use this tool to identify periods of heavy accumulation (high Buy Volume) or distribution (high Sell Volume), providing insight into the conviction behind price movements.

Pivot Points High LowGaneshA Pivot Points High/Low indicator that:
Detects swing highs (ta.pivothigh) and swing lows (ta.pivotlow) using configurable left/right bar lengths.
Draws labels at the confirmed pivot points:
Down labels at pivot highs (potential resistance).
Up labels at pivot lows (potential support).
Lets you customize text color and label fill color separately for highs and lows.
It’s designed for overlay (on-price chart), with max_labels_count=500 to allow many labels.

GMMA fill (v5) + Golden Crossover HighlightsGMMA Fill (v5) + Golden Crossover Highlights
This setup combines the Guppy Multiple Moving Average (GMMA) Fill version 5 with Golden Crossover signals to identify strong trend continuation and potential breakout points. GMMA provides layered moving averages for short- and long-term trend analysis, while the Golden Crossover highlights bullish momentum shifts, making it ideal for spotting entry opportunities in trending markets.

H1 Bias Rhythmic Lite Public V1.0 by SRTH1 Bias Rhythmic Lite Public V1.0 by SRT
Version: 1.0 (Public Lite)
Author: SRT
Platform: TradingView / Pine Script v6
Overlay: Yes (works directly on price chart)
Purpose: Provide H1 directional bias with D1 alignment and basic rhythm signals. Perfect for traders looking for clean bias visualization without clutter.
💡 Key Features
H1 Bias (Primary Engine)
Uses EMA7, EMA40, SMA150, and SMA200 for H1 directional bias.
Clearly identifies bullish, bearish, and neutral conditions.
Stack-based logic ensures consistency and reliability.
D1 Bias Alignment
Pulls higher timeframe (daily) EMA40, SMA150, SMA200.
Confirms H1 bias alignment with daily trend.
Helps filter trades in the direction of the larger trend.
Flush Detection
H1 flushes: Price fully “flushed” beyond EMA7 for bullish/bearish setups.
D+H1 flush: Aligns H1 flush with D1 bias for stronger context.
Visual dots with configurable sizes and colors indicate flush levels.
Price Action Signals
Engulfing (EB) detection with ATR filtering and body % thresholds.
Long Tail Body (LTB) detection with optional body % filter for precise swing points.
Both EB and LTB signals show clear labels above/below the candle for instant recognition.
ATR-Based Dynamic Offsets
Uses ATR (configurable length) to scale labels and flush dot offsets dynamically.
Ensures signals are proportionate to volatility.
Daily Pivot & Session Lines
Daily pivot plotted automatically.
Option to show daily session high-low lines and day labels.
Easily configurable label sizes and colors.
Bias Summary Table
Top-right table shows:
D1 bias
H1 bias
LTB allowed (Yes/No)
Color-coded for easy reference: green = Bull, red = Bear, gray = Neutral.
Alerts
H1 flush and D+H1 flush alerts.
LTB active alerts when bias is aligned.
Perfect for keeping an eye on actionable swings.
⚙️ User Inputs
Moving Average Lengths: EMA7, EMA40, SMA150, SMA200
Show/Hide MAs: Toggle to declutter the chart
ATR Settings: Length and % threshold for EB/LTB sizing
Signal Toggles: Show/Hide EBull, EBear, LTB Bull, LTB Bear, Flush Dots
Daily Pivot & Label Settings: Toggle visibility, label size, line/text colors
✅ Advantages for Users
Lightweight and fast — minimal lag on H1 charts.
Clear visualization of market bias and swing points.
Free access to core H1 Bias Rhythmic methodology.
Serves as a learning tool for traders who want to upgrade later.
⚠️ Limitations
No automatic entries, stops, or take profits (manual trade execution required).
Lite version only offers simplified signals and bias visualization.
Advanced rhythm and multi-timeframe alerts are reserved for the Premium version.
📢 Short Promo for Premium
For traders who want full power, check out H1 Bias Rhythmic Premium V1.0 by SRT — complete multi-phase alerts, advanced LTB & EB filters, EMA/SMA flip confirmations, and professional-level rhythm signals. Upgrade to premium for the full H1 trading experience.

Opposite Candle Zone Identifier (v6) - Extended🔍 Opposite Candle Zone Identifier (Extended)
Opposite Candle Zone Identifier is a price-action based indicator designed to identify potential reversal or absorption zones by detecting candles that move against the surrounding trend.
The indicator highlights a central opposite candle (or group of candles) that is surrounded by candles moving in the opposite direction, both before and after the central candle.
This structure often represents areas where institutional activity, absorption, or supply/demand imbalance may occur.
📌 How the Indicator Works
The indicator analyzes price action using three configurable blocks:
1️⃣ Candles Before (Backward)
A user-defined number of candles before the central candle(s) must follow a consistent trend:
Bullish candles for a bearish zone
Bearish candles for a bullish zone
2️⃣ Central Candle(s)
The core of the pattern:
Default: 1 opposite candle
Can be increased (up to 5) to adapt the indicator to lower timeframes or noisier markets
This central block must move against the previous trend, signaling a potential shift or absorption area.
3️⃣ Candles After (Forward)
A user-defined number of candles after the central candle(s) must resume the original trend, confirming the pattern.
⚠️ The signal is confirmed only after the “after” candles are completed.
This avoids repainting and ensures structural confirmation.
📐 Zone Concept
The highlighted central candle (or candles) can be used to define a price zone:
The high and low of the central candle(s) represent a potential supply or demand zone
These zones can be used for:
Reversal areas
Reaction zones
Entry refinement
Stop placement
⚙️ Inputs & Customization
Number of candles before
Controls how many candles must follow the initial trend.
Number of candles after
Defines how many candles are required for confirmation.
Central candles count
Default is 1, but can be increased (e.g. 2) for:
Lower timeframes
More reliable structure
Reduced noise
ATR-based offset
Labels are positioned using a dynamic ATR offset to improve chart readability across different markets and timeframes.
📈 Bullish & Bearish Zones
🟢 Bullish Zone
Bearish candles before
Bullish central candle(s)
Bearish candles after
Indicates potential demand or accumulation zone
🔴 Bearish Zone
Bullish candles before
Bearish central candle(s)
Bullish candles after
Indicates potential supply or distribution zone
🧠 Best Use Cases
Works best on 15m and higher timeframes
Effective on:
Indices
Forex majors
Liquid cryptocurrencies
Can be combined with:
Trend filters (EMA, VWAP)
Support & resistance
Market structure analysis
⚠️ Notes
This indicator is confirmation-based, not predictive
Signals appear only after pattern completion
It does not repaint
Best used as a confluence tool, not as a standalone trading system
🎯 Summary
Opposite Candle Zone Identifier helps traders:
Detect opposite-direction candles within strong trends
Identify potential supply and demand zones
Adapt the pattern to different timeframes
Improve price-action based decision making

CRT+ Advance Engulfing | @stefandimovCRT+ Lite implements institutional-style Candle Range Theory logic to identify displacement-driven engulfing structures with precision.
The script focuses on wick-based liquidity grabs, strict body closes, and optional higher-timeframe confirmation to highlight structurally valid bullish and bearish reversals.
Includes a Daily-only multi-market scanner and a compact dashboard for fast top-down analysis.
Designed for traders who prioritize structure, execution precision, and HTF alignment.

Manipulation Candle SystemThis indicator is based on One Candle Scalping Strategy by ProRealAlgos
## **Manipulation Candle System – Simple Explanation**
This indicator helps traders identify **potential market manipulation** during the **US stock market session (New York)** and highlights **key reversal signals**.
---
### **1. Daily ATR (Average True Range)**
* Measures the **average price movement** of the day.
* Helps determine if a move is **normal** or **abnormally large**.
* The indicator calculates **daily ATR** automatically.
* If 15 minute opening candle is more than 25% of Daily ATR, we can call it manipulation is happen .
---
### **2. 15-Minute Opening Candle Box**
* Highlights the **first 15-minute candle** of the US session.
* The box **extends for 2 hours** after the market opens.
* **Color indicates market condition**:
* **Red box** → the opening candle range is bigger than 25% of the daily ATR → potential **manipulation**.
* **Blue box** → the opening candle range is normal → **neutral session**.
* Helps traders visually spot when the market might be trying to **trap traders**.
---
### **3. 5-Minute Reversal Detection**
* Looks for **reversal candle patterns** on the 5-minute chart:
* Bullish engulfing or strong bullish pin → **buy reversal**.
* Bearish engulfing or strong bearish pin → **sell reversal**.
* Only checks during the **US session**, after 15 minute opening candle.
* Helps traders **time entries** in the direction of potential market reversals.
---
### **4. Buy / Sell Signals**
* Shows **triangle markers** on the chart:
* **Green triangle below candle** → buy signal.
* **Red triangle above candle** → sell signal.
* The signal text also indicates:
* `"BUY (Trap Reversal)"` → if the reversal occurs during manipulation.
* `"BUY (Normal Reversal)"` → if the reversal occurs during a neutral session.
* `"SELL (Trap Reversal)"` → if a sell reversal occurs during manipulation.
* `"SELL (Normal Reversal)"` → otherwise.
---
### **5. Info Table**
* Appears at the **top-right** of the chart.
* Shows:
1. Daily ATR value.
2. 15-minute opening candle range.
3. Session condition → `"MANIPULATION"` or `"NEUTRAL"`.
4. Current reversal signal text.
---
### **How a New Trader Can Use It**
1. Look at the **color of the opening box**:
* Red → be cautious, price may trap traders.
* Blue → normal market behavior.
2. Watch for **reversal signals** on the 5-minute chart.
3. Use the **info table** to confirm ATR, session bias, and signals.
4. Combine this with **risk management** before entering trades.
