MAD Supertrend [Alpha Extract]A sophisticated SuperTrend implementation that replaces traditional ATR calculations with Mean Absolute Deviation methodology for adaptive volatility measurement and band construction. Utilizing SMA baseline with MAD-based deviation bands and optional adaptive factor adjustments, this indicator delivers institutional-grade trend detection with strength-based filtering and dynamic visual feedback. The system's MAD approach provides superior noise reduction compared to ATR while maintaining responsiveness to genuine volatility changes, combined with momentum-based strength calculations for high-conviction signal generation.
🔶 Advanced MAD-Based Band Construction
Implements Mean Absolute Deviation calculation as volatility proxy, measuring absolute price deviations from mean and smoothing for stable band generation without ATR dependency. The system calculates SMA baseline, computes MAD from configurable lookback period, applies factor multipliers to create upper and lower bands, then implements classic SuperTrend ratcheting logic where bands only adjust when price violates previous levels or calculations warrant updates.
// Core MAD SuperTrend Framework
SMA_Value = ta.sma(src, SMA_Length)
Mean = ta.sma(src, MAD_Length)
Abs_Deviation = abs(src - Mean)
MAD_Value = ta.sma(Abs_Deviation, MAD_Length)
// Band Construction with Ratcheting
Upper_Band = SMA_Value + MAD_Factor * MAD_Value
Lower_Band = SMA_Value - MAD_Factor * MAD_Value
// Ratcheting logic prevents premature band adjustments
🔶 Adaptive Factor Adjustment Engine
Features optional adaptive multiplier system that modulates MAD factor based on normalized MAD magnitude relative to recent extremes, creating bands that automatically expand during high-volatility regimes and contract during consolidation. The system applies min-max normalization to MAD values over configurable lookback, multiplies by adaptation parameter, and adds to base factor for dynamic volatility sensitivity without manual recalibration.
🔶 Momentum-Based Strength Filter
Implements sophisticated strength calculation measuring price momentum relative to baseline divided by volatility-adjusted MAD bands, producing normalized 0-1 strength scores with exponential smoothing. The system calculates distance from SMA baseline, normalizes by MAD-derived band width, and applies configurable minimum threshold requiring sufficient momentum before trend signals activate, filtering weak or choppy market conditions.
🔶 SuperTrend Direction Logic
Utilizes classic SuperTrend methodology adapted for MAD bands where trend direction flips on opposite band violations with state persistence until confirmation. The system tracks whether price closes above upper band (bearish flip to bullish) or below lower band (bullish flip to bearish), maintains directional state until opposing violation occurs, and generates binary +1/-1 trend signals suitable for systematic position management.
🔶 Intelligent Candle Sticking System
Provides advanced line positioning option that anchors SuperTrend line to candle wicks or bodies rather than pure calculation values for enhanced visual clarity. The system supports two modes: Wick (positions at high/low extremes based on trend direction) and Body (constrains line between calculation and candle extremes), creating cleaner chart presentation while maintaining mathematical integrity of underlying signals.
🔶 Dynamic Gradient Visualization Framework
Implements color intensity modulation based on smoothed strength calculations, transitioning from muted to vivid hues as momentum conviction increases. The system applies gradient interpolation using strength ratio, creating visual feedback where strong trending moves display intense colors while weak or consolidating conditions show faded tones across trend line, channel bands, and candle coloring for immediate regime assessment.
🔶 MAD Channel Architecture
Features volatility-adjusted channel bands centered on baseline or candle-stuck line with configurable multiplier for support/resistance visualization. The system calculates upper and lower bounds using MAD values scaled by adaptive factors and channel multipliers, applies dynamic transparency based on trend strength, and creates filled regions that intensify during strong trends and fade during weak conditions.
🔶 Multi-Layer Glow Effect System
Provides sophisticated line rendering with triple-layer plot system creating glow effect through progressively wider and more transparent outer layers. The system plots core trend line at specified width with full color intensity, adds inner glow layer at +2 width with moderate transparency, and outer glow at +4 width with higher transparency, creating visual depth and emphasis without cluttering chart space.
🔶 Strength-Based State Management
Implements intelligent trend state logic requiring both directional signal and minimum strength threshold breach before confirming trend transitions. The system calculates raw SuperTrend direction, evaluates smoothed strength against configurable minimum, generates filtered trend state that can be bullish (+1), bearish (-1), or neutral (0), and maintains state persistence using hold logic that prevents oscillation during ambiguous conditions.
🔶 Comprehensive Alert Integration
Generates trend flip alerts when filtered state transitions from bearish to bullish or bullish to bearish with full confirmation requirements satisfied. The system detects state changes through comparison with previous bar, triggers single alert per transition rather than continuous notifications, and provides customizable message templates for automated trading system integration or manual notification preferences.
🔶 Performance Optimization Architecture
Utilizes efficient calculation methods with null value handling, nz() functions preventing errors during initialization bars, and optimized gradient calculations. The system includes intelligent state persistence minimizing recalculation overhead, streamlined MAD computation avoiding redundant mean calculations, and smooth visual updates maintaining consistent performance across extended historical periods.
This indicator delivers sophisticated SuperTrend analysis through Mean Absolute Deviation methodology providing superior statistical properties compared to traditional ATR-based approaches. MAD calculations offer more robust volatility measurement resistant to extreme outliers while maintaining sensitivity to genuine market regime changes. The system's adaptive factor adjustment, momentum-based strength filtering, and dynamic visual feedback make it essential for traders seeking reliable trend-following signals with reduced false breakouts during choppy conditions. The combination of MAD bands, candle-sticking options, gradient strength visualization, and comprehensive filtering creates institutional-grade trend detection suitable for systematic approaches across cryptocurrency, forex, and equity markets with clear entry/exit signals and comprehensive alert capabilities.
Crossover

Blockcircle Waveform BandsThe Blockcircle Waveform Bands is a comprehensive trend-following indicator built around a layered moving average ribbon system. The core idea is simple: when shorter-term averages stack above longer-term ones in proper sequence, the trend is healthy. When they compress, cross, or invert, something is changing.
This indicator was developed to solve a common problem. Traders often clutter their charts with multiple moving averages, each added separately, each requiring manual tweaking. Waveform Bands consolidates everything into a single, unified view.
You get fast, medium, and slow bands that expand and contract with momentum, change color based on trend direction, and provide clear reference points for entries, exits, and trend assessment.
Also included is a configurable higher-timeframe bias band, which allows you to track the macro trend without switching timeframes. Most useful is following the 21W EMA and 20W SMA crosses.
What Makes This Indicator Different
While moving average ribbons are a well-known concept, this indicator extends beyond simple MA plotting in several meaningful ways that justify its protected source status.
First, the indicator calculates a proprietary confluence score ranging from negative 100 to positive 100. This score is not just counting crossovers. It uses weighted contributions from band alignment, price position across multiple timeframe zones, and momentum confirmation via rate of change integration. The specific weighting logic and calculation method represent original development work not available in standard MA ribbon indicators.
Second, the summary scoring system evaluates trend quality on a 0 to 100 scale using a multi-factor algorithm. Trend state contributes up to 35 points, band alignment contributes up to 30 points, price position contributes up to 20 points, and momentum confirmation contributes up to 15 points. This weighted approach provides objective trend measurement rather than relying solely on visual interpretation.
Third, the signal generation framework offers five distinct signal methods, each with three sensitivity levels, creating fifteen unique configurations. This is a complete signal system with filtering logic, not simply MA crossover alerts. The interaction between signal type, sensitivity, and the optional trend filter creates a flexible framework that traders can calibrate to their specific style.
Fourth, the optional smoothing layer applies additional processing after the base MA calculations are complete. This reduces noise and whipsaws during choppy conditions while maintaining responsiveness during genuine trend moves.
These proprietary elements, particularly the scoring algorithms and signal framework, represent the original work that distinguishes this from standard open-source MA ribbons available elsewhere.
Key Features
Multi-Band Ribbon System: Three distinct bands covering short, medium, and long-term trend structure. The fast band uses configurable MAs with default periods of 8, 13, and 16 for immediate price action. The mid band spans 21 to 42 periods, capturing the intermediate swing structure. The slow band covers 50 to 60 periods, representing the underlying trend foundation. Each band can be independently toggled, colored, and adjusted.
Flexible Moving Average Types: Choose from eight MA calculation methods including EMA, SMA, WMA, VWMA, HMA, DEMA, TEMA, and ZLEMA. Set a default type for all bands or override individually per band. Useful for those who prefer Hull MA smoothness or the responsiveness of DEMA and TEMA.
Major Moving Averages: Built-in 200-period MA for institutional-level support and resistance. Pi cycle MA using 314 periods for longer-term cycle analysis. Fully customizable additional MA with adjustable length, type, and color. Clear visual distinction with configurable line widths.
Higher Timeframe Bias Band: Dual MA system pulled from any higher timeframe you choose. Default configuration mirrors the popular 21-week EMA versus 20-week SMA setup. Both MAs are fully adjustable in length, type, and timeframe. Automatic bullish or bearish fill coloring based on which MA leads. Keeps macro context visible without leaving your current chart.
Dynamic Trend Coloring: All bands automatically shift color based on detected trend state. Bullish alignment shows green spectrum, bearish shows red, neutral shows yellow.
Trend Detection and Scoring: Algorithmic trend state detection based on band alignment and price position. Confluence scoring system weighing multiple factors from negative 100 to positive 100. Band alignment tracking showing whether each band is internally bullish or bearish. Band expansion and contraction monitoring for momentum assessment. Strength percentage calculation for trend conviction measurement.
Signal Generation: Multiple signal type options including band crosses, price crosses, and full alignment signals. Three sensitivity levels to match different trading styles and timeframes. Optional filtering to show only signals confirmed by the slow band.
Dashboard Display: Comprehensive table with summary score, bias direction, and trend status. Compact mode available for reduced screen footprint.
Alerts: Pre-configured alerts for buy and sell signals. Trend change notifications when bias shifts bullish or bearish. Major MA cross alerts for the 200 MA and Pi MA. Band alignment alerts when all bands synchronize. Confluence threshold alerts for strong directional readings.
How To Use
Identifying Trend Direction: Look at the overall band structure first. In a healthy uptrend, the fast band sits above the mid band, which sits above the slow band. Price should be trading above the fast band or at least within it.
The dynamic coloring gives you an instant read. If everything is green, the trend structure is bullish. Red means bearish. Yellow or mixed colors indicate transition or consolidation.
Check the dashboard summary row for a quick score. Above 60 suggests a solid trend, while below 40 indicates weakness or chop.
Using the Bias Band for Macro Context: The higher timeframe bias band tells you whether the larger trend supports your trade idea. If you are looking to buy on a daily chart, check whether the weekly bias band is bullish, meaning the fast MA is above the slow MA.
When the price is above both bias MAs and the band is bullish, conditions favor long positions. When the price is below both and the band is bearish, conditions favor shorts or staying out.
The fill color between the bias MAs changes automatically. Green fill indicates bullish macro bias and red indicates bearish. This is visible at a glance without checking numbers.
Finding Entry Points: Look for pullbacks into the mid band during established trends. When the fast band compresses toward the mid band and then expands again, this often marks a continuation entry.
Band crossings can signal new trend initiations. When the fast band crosses above the mid band with confirming price action, it suggests a potential long entry. The opposite applies for shorts.
Use the signal markers as alerts to potential opportunities, but confirm with price action. A signal appearing while the price is holding above a key band carries more weight than one appearing in isolation.
Managing Risk and Exits: The slow band often acts as a trailing stop reference during trends. As long as price holds above the slow band on pullbacks, the trend remains intact. This is not always true, but it serves as a helpful general guideline.
Losing the mid band on a closing basis often warns that the move is weakening. This might prompt partial profit-taking or tightening stops.
The 200 MA serves as a major support or resistance level. Trends that break below the 200 after an extended move often accelerate to the downside.
Reading Momentum Through Band Width: When all bands are tightly compressed, expect a directional move soon. Compression represents energy building up.
Expanding bands confirm momentum is present in the current move. Watch for continued expansion on trend days.
Contracting bands during a trend may warn that momentum is fading, even if the price has not reversed yet.
Combining Multiple Timeframes: Enable multi-timeframe mode to see higher timeframe MAs plotted on your current chart. Be careful with this as it can crowd the display, but it is useful for seeing different timeframes stacked together.
This helps identify where significant support or resistance exists above your normal view.
The bias band already provides macro context, but you can set it to different timeframes for different purposes. Day traders might use daily bias bands while swing traders might prefer weekly.
How To Read The Table
The summary row gives you the overall picture. A high score with bullish bias and strong trend status represents ideal conditions for trend-following entries.
Individual band status rows tell you if any divergence exists between timeframes. If the fast band is bearish but mid and slow are bullish, you might be seeing a pullback rather than a reversal.
Price position percentages show how extended the price is from each band. Extreme readings in either direction suggest potential mean reversion or exhaustion.
Limitations
This indicator is designed for trending markets and performs best when clear directional movement exists. During extended consolidation or ranging conditions, the confluence score may oscillate near zero and signals may produce mixed results.
Like all moving average based systems, signals are lagging by nature. The indicator confirms trends rather than predicting them. Early entries require additional confirmation from price action or other methods.
The default settings are optimized for daily and higher timeframes on crypto and forex markets. Intraday traders and those analyzing other asset classes may need to adjust the band lengths to match their specific conditions.
This indicator should be used as part of a complete trading approach that includes proper risk management and position sizing. It is not intended as a standalone system.
Getting Started
Start with the default settings and observe how the indicator behaves on your preferred instruments and timeframes before customizing.
The indicator works on all markets and timeframes, but the default MA lengths are optimized for daily and higher charts. For intraday trading, consider reducing the band lengths proportionally.
Use the compact table mode if the full dashboard feels cluttered. The essential information remains visible while using less screen space.
Set up alerts for trend changes and major MA crosses so you do not need to watch charts constantly. Let the indicator notify you when conditions change.

Golden Cross with Stop and TargetHere is a simple TradingView Pine Script that backtests the classic SMA 50 / SMA 200 crossover strategy with a percentage take-profit and stop-loss.

Crypto MA Crossover indicator v0.1Research I conducted has shown that using moving average crossovers to determine when going long a cryptocurrency (or otherwise going to cash) performs better than both buy-and-hold as other similar strategies (e.g., going long when price crossover over moving averages).
Adaptive moving average strategy paper with full backtests
This indicator shows if a given cryptocurrency is in a state where the best-performing moving averages have crossed over. It also shows the specific moving average settings for each cryptocurrency.
Note: you will have to edit the script to update the coins and moving average settings manually.

Volume-Adjusted CCI Trend [Alpha Extract]A sophisticated trend identification system that combines dual EMA direction analysis with volume-weighted normalization and CCI momentum filtering for comprehensive trend validation. Utilizing Volume RSI integration and standard deviation-based bands that expand and contract with volume characteristics, this indicator delivers institutional-grade trend detection with multi-layered confirmation requirements. The system's volume adjustment mechanism modulates signal sensitivity based on participation strength while CCI thresholds prevent false signals during weak momentum conditions, creating a robust trend-following framework with reduced whipsaw susceptibility.
🔶 Advanced Dual EMA Direction Engine
Implements fast and slow exponential moving average comparison to establish primary trend direction bias with configurable period parameters for timeframe optimization. The system calculates trend direction as binary +1 (bullish when fast EMA exceeds slow EMA) or -1 (bearish when slow exceeds fast), providing foundational directional input that requires additional confirmation before generating actionable trend states.
🔶 Volume-Adjusted Normalization Framework
Features sophisticated normalization calculation that measures price deviation from basis EMA, scales by standard deviation, then applies volume-weighted adjustment factor for participation-sensitive signal generation. The system calculates Volume RSI to quantify relative volume strength, converts to ratio format, and multiplies normalized deviation by volume factor scaled by impact parameter, creating signals that strengthen during high-volume confirmations and weaken during low-volume moves.
// Volume-Adjusted Normalization
Vol_Ratio = Volume_RSI / 50
Vol_Factor = 1 + (Vol_Ratio - 1) * Vol_Impact
Dev = src - Basis_EMA
Raw_Normalized = Dev / (StdDev * Multiplier)
Vol_Adjusted_Norm = Raw_Normalized * Vol_Factor
🔶 CCI Momentum Filter Integration
Implements Commodity Channel Index threshold system with configurable upper and lower bounds to validate trend strength and filter sideways market conditions. The system calculates standard CCI with adjustable length, compares against asymmetric thresholds (default +100 bullish, -50 bearish), and requires CCI confirmation in addition to EMA direction and normalized deviation before transitioning trend states, ensuring only high-conviction signals generate entries.
🔶 Multi-Layer Trend State Logic
Provides intelligent trend state machine requiring simultaneous confirmation from EMA direction, volume-adjusted normalization threshold breach, and optional CCI momentum validation. The system maintains persistent trend state that only transitions when all three conditions align, preventing premature reversals during temporary retracements or low-volume fluctuations while capturing genuine trend changes with institutional-grade confirmation requirements.
🔶 Dynamic Volume Band Architecture
Creates volatility-adjusted bands around basis EMA using standard deviation multiplied by volume factor, producing channels that widen during high-volume periods and contract during low-volume consolidations. The system applies identical volume adjustment to band calculations as normalization metric, ensuring visual envelope consistency with underlying signal logic and providing intuitive reference boundaries for trend-following price action.
🔶 Gradient Strength Visualization System
Implements color intensity modulation based on normalized signal strength relative to threshold requirements, creating visual feedback that communicates trend conviction. The system calculates strength ratio by dividing absolute normalized value by threshold, caps at 1.0, and applies gradient interpolation from muted to vivid colors, instantly conveying whether current trend exhibits marginal or strong characteristics through line and candle coloring.
🔶 Volume RSI Calculation Engine
Utilizes RSI methodology applied to volume series rather than price to quantify relative participation strength with normalization to 0.5-1.5 range for factor multiplication. The system processes volume through standard RSI calculation, divides by 50 to center around 1.0, and produces ratio values where readings above 1.0 indicate above-average volume and below 1.0 suggest below-average participation for signal adjustment purposes.
🔶 Asymmetric Threshold Configuration
Features separate positive and negative normalization thresholds with independent CCI upper and lower bounds enabling optimization for bullish versus bearish signal generation characteristics. The system defaults to symmetric normalized thresholds (±0.2) but asymmetric CCI levels (+100/-50), recognizing that bullish momentum often requires stronger confirmation than bearish reversals in typical market structures.
🔶 Comprehensive Visual Integration
Provides multi-dimensional trend visualization through color-coded basis line, volume-adjusted bands with gradient fills, trend-synchronized candle coloring, and transition signal labels. The system enables selective display toggling for each visual component while maintaining consistent color scheme and strength-based intensity across all elements for cohesive chart presentation without overwhelming information density.
🔶 Alert and Signal Framework
Generates trend change alerts when state transitions occur with all confirmation requirements satisfied, providing notifications for bullish (transition to +1) and bearish (transition to -1) signals. The system implements state change detection through comparison with previous bar trend state, ensuring single alert per transition rather than continuous notifications during sustained trends.
🔶 Performance Optimization Architecture
Employs efficient calculation methods with null value handling for Volume RSI initialization and nz() functions preventing calculation errors during early bars. The system includes intelligent state persistence maintaining previous trend during ambiguous conditions and optimized gradient calculations balancing visual quality with computational efficiency across extended historical periods.
🔶 Why Choose Volume-Adjusted CCI Trend ?
This indicator delivers sophisticated trend identification through multi-layered confirmation combining directional EMA analysis, volume-weighted normalization, and momentum validation via CCI filtering. Unlike traditional trend indicators relying solely on price-based calculations, the volume adjustment mechanism ensures signals strengthen during high-participation moves and weaken during low-volume drifts, reducing false breakouts and choppy market whipsaws. The system's requirement for simultaneous EMA direction, normalized threshold breach, and CCI momentum confirmation creates institutional-grade signal quality suitable for systematic trend-following approaches across cryptocurrency, forex, and equity markets. The volume-adjusted bands provide dynamic support/resistance references while the gradient strength visualization enables instant assessment of trend conviction for position sizing and risk management decisions.

MACD Matrix: Angle & SettlementThis indicator is a comprehensive Multi-Timeframe (MTF) Dashboard designed for technical traders who rely on MACD not just for crossovers, but for Momentum Angle and Settlement (Hooks).
Instead of cluttering your screen with 5 different MACD charts, this Matrix calculates the math in the background and presents a clean "Heads-Up Display" of the MACD state across your specific timeframes (Default: 3m, 15m, 1h, 4h, 16h).
The Concept: "Angle Settlement"
Standard MACD indicators only show you when a cross happens. By then, the move is often halfway over. This script focuses on the Angle (Slope) of the MACD line to predict turns before they happen:
Steep Angle: Momentum is accelerating. (Strong Trend)
Settling Angle: The slope is flattening out. The MACD line is "hooking." (Reversal/Cross Imminent)
Dashboard Columns Explained
TF (Timeframe): Auto-formats your settings into readable text (e.g., "240" becomes "4h").
Zone:
> 0 (Green): MACD is above the Zero Line (Bullish Trend context).
< 0 (Red): MACD is below the Zero Line (Bearish Trend context).
Cross:
PCO (Green): Positive Crossover (MACD > Signal).
NCO (Red): Negative Crossover (MACD < Signal).
Deg (°):
The calculated mathematical angle of the MACD line.
Positive (+): Momentum is rising.
Negative (-): Momentum is falling.
State (The Strategy):
STEEP (Bright Color): The angle is increasing. Do not trade against this momentum.
SETTLE (Dim Color): The angle is decreasing compared to the previous bar. The momentum is "cooling off," often signaling a "Hook" or an upcoming crossover.
Settings & Customization
Custom Timeframes: You can freely change TF-1, TF-2, etc., in the settings. The table labels will auto-update (e.g., if you change 4h to 1D, the table will display "1D").
MACD Lengths: Fully customizable (Default 12, 26, 9).
Angle Sensitivity: A multiplier to calibrate the "Degrees" to your specific asset class (Crypto, Forex, or Indices). If angles look too small, increase this value.

Predictive ZLEMA NavigatorThis is an advanced trend-following indicator that combines Zero-Lag Exponential Moving Averages (ZLEMA) with predictive crossover analysis to identify high-probability trade entries with exceptional timing precision.
Key Features:
1. Zero-Lag Technology
Utilizes ZLEMA calculation to eliminate the inherent lag found in traditional EMAs
Provides faster response to price movements while maintaining smooth trend identification
Default periods (34/89) align with Fibonacci sequence for natural market rhythm detection
2. Predictive Crossover System
Unique algorithm forecasts upcoming Golden Cross and Death Cross events before they occur
Displays estimated bars until next crossover, giving traders advance preparation time
Helps avoid late entries by signaling trend changes up to 200 bars in advance
3. Visual Direction Arrows
Color-coded projection arrows show the momentum trajectory of both fast and slow ZLEMAs
Adjustable projection length allows customization for different trading timeframes
Instantly identifies whether trends are strengthening or weakening
4. Multi-Layer Signal Confirmation
Clear crossover points marked with circles and confirmation ticks
Dynamic fill coloring between MAs for instant trend bias recognition
Bullish signals (green/blue) and bearish signals (orange/red) prevent confusion
Performance Characteristics:
Strengths:
Reduced Whipsaws: ZLEMA's lag reduction minimizes false signals in ranging markets
Early Detection: Predictive algorithm provides 10-50 bar advance warning of trend changes
Versatile Application: Works across all timeframes (1-minute to daily) and asset classes
Visual Clarity: Clean interface prevents information overload while maintaining comprehensive data
Optimal Use Cases:
Swing trading on 4H-Daily timeframes
Trend confirmation for breakout strategies
Portfolio rotation timing based on momentum shifts
Works exceptionally well on trending assets (crypto, indices, trending stocks)
Trading Approach:
Enter long on Golden Cross confirmation with upward direction arrows
Exit or reverse on Death Cross with downward momentum projection
Use prediction labels to scale into positions before actual crossover
Combine with volume analysis for enhanced confirmation
Built-in Alert System: Automated notifications for both bullish and bearish crossovers ensure you never miss a trading opportunity.
This indicator bridges the gap between reactive and predictive trading, giving you the speed of ZLEMA with the foresight of trend projection analysis.
DISCLAIMER: This information is provided for educational purposes only and should not be considered financial, investment, or trading advice.Happy Trading

SMAcross-mvrOverview
SMAcross-mvrNew is a flexible, non-repainting moving-average strategy designed for clarity, configurability, and reliable backtesting.
It supports multiple entry styles, optional layered exits, and full-capital position sizing, while remaining stable during chart zooming and dragging.
🚀 What’s New in v2
✅ Multiple Entry Modes
You can now choose how trades are entered:
Entry Mode A: Short SMA crosses Long SMA
Entry Mode B: Price crosses Long SMA
This allows both classic MA-crossover trading and trend-continuation pullback entries using the same strategy.
✅ Modular Exit System (Checkbox-Based)
Exit logic is now fully modular using independent checkboxes:
☑ Exit on opposite signal
☑ Exit when price closes beyond Short SMA
You may enable one, both, or neither.
If both are enabled, the strategy exits on whichever condition occurs first.
✅ Terminology Clarity
All labels, inputs, and alerts now use semantic naming:
Short SMA (formerly 13 SMA)
Long SMA (formerly 30 SMA)
This makes the strategy easier to understand and future-proof if SMA lengths are changed.
✅ Full-Capital Position Sizing
Each trade uses 100% of available equity, allowing performance to naturally compound over time during backtests.
✅ Optional Visual Enhancements
Optional cross price labels (can be toggled on/off)
Color-filled zone between Short and Long SMAs for quick trend recognition
Optional 200 SMA (off by default) for higher-timeframe context
✅ Alert-Ready (TV-Safe)
All alerts use static messages compatible with TradingView’s alert system, making the strategy suitable for:
Manual trade notifications
Webhook-based automation
Broker integrations
🔒 Design Principles
No repainting
No line continuations (TradingView-safe formatting)
Stable behavior when zooming or scrolling
Clear separation of entry logic, exit logic, and visuals
⚠️ Notes
This script is intended for educational and research purposes.
Always forward-test and apply proper risk management before live trading.

SMA MAD Trend [Alpha Extract]A sophisticated trend identification system that combines Simple Moving Average with Mean Absolute Deviation methodology to create adaptive Super Trend-style bands with advanced strength filtering and gradient visualization. Utilizing ADX-based trend strength validation and slope analysis for signal quality enhancement, this indicator delivers institutional-grade trend detection with dynamic ATR-based ribbon visualization and comprehensive strength measurement. The system's dual-filter architecture eliminates false signals during weak or choppy market conditions while maintaining sensitivity to genuine trend establishment and reversal events.
🔶 Advanced SMA-MAD Band Construction
Implements innovative Mean Absolute Deviation calculation around Simple Moving Average baseline to create volatility-adaptive bands with ratcheting logic for trend persistence. The system calculates MAD by measuring absolute price deviations from the mean, then applies configurable multipliers to generate upper and lower bands that adjust to changing market conditions while preventing premature band violations.
// Core SMA-MAD Framework
SMA_Value = ta.sma(close, SMA_Length)
Mean = ta.sma(close, MAD_Length)
Abs_Deviation = abs(close - Mean)
MAD_Value = ta.sma(Abs_Deviation, MAD_Length)
// Adaptive Bands
Upper_Band = SMA_Value + MAD_Factor * MAD_Value
Lower_Band = SMA_Value - MAD_Factor * MAD_Value
🔶 Intelligent Dual-Filter System
Features comprehensive trend validation using ADX strength measurement and slope analysis to eliminate low-conviction signals during ranging or consolidating markets. The system calculates normalized slope strength using ATR scaling and combines with ADX threshold analysis, generating filtered trend states that distinguish genuine trends from temporary price fluctuations.
🔶 Dynamic Trend Strength Engine
Implements sophisticated strength calculation combining slope intensity and ADX readings to produce normalized 0-100% strength scores with gradient colour intensity modulation. The system normalizes slope by minimum threshold and ADX by configurable level, multiplying factors to create composite strength measurement that drives visual feedback intensity across all indicator elements.
🔶 Super Trend-Style Direction Logic
Utilizes classic Super Trend methodology adapted for SMA-MAD bands, where trend direction flips occur on opposite band violations with persistent state maintenance. The system tracks previous band levels with ratcheting behaviour that adjusts bands only when price movement or new calculations warrant changes, preventing oscillation during normal volatility.
🔶 ATR-Based Ribbon Visualization
Provides dynamic ribbon overlay using ATR-scaled width around the trend line with opacity modulation based on trend strength for intuitive conviction assessment. The system creates upper and lower ribbon bounds at configurable ATR multiples, filling the channel with gradient-adjusted transparency that increases during strong trends and fades during weak conditions.
🔶 Multi-Dimensional Visual Architecture
Provides complete chart integration through trend line overlay, ATR ribbon fills, candle colouring, background glow, and transition signal labels with configurable visibility toggles. The system enables traders to customize display density from minimal (trend line only) to comprehensive (all visual elements) while maintaining consistent colour scheme and strength-based intensity across components.
🔶 Slope Strength Validation
Calculates ATR-normalized slope over configurable lookback periods to measure trend line momentum and filter sideways price action. The system compares absolute slope against minimum threshold requirements, preventing trend signals when price movement relative to the trend line lacks sufficient directional conviction regardless of band position.
🔶 Signal Generation Framework
Generates trend change signals when filtered direction state transitions from bearish to bullish or vice versa, with label placement and alert integration. The system implements state persistence that maintains previous trend until both ADX and slope filters confirm directional change, reducing whipsaw signals while capturing genuine reversals with minimal lag.
🔶 Performance Optimization Framework
Utilizes efficient calculation methods with optimized variable management and configurable parameters for balance between responsiveness and stability. The system includes intelligent state tracking with NA handling for initial bars and smooth gradient calculations that maintain performance across extended historical periods and real-time updates.
This indicator delivers sophisticated trend identification through Mean Absolute Deviation methodology combined with dual-strength filtering for superior signal quality. Unlike traditional Super Trend indicators that rely solely on ATR bands, the SMA-MAD approach uses statistical deviation measurement while incorporating ADX strength and slope validation to eliminate false signals during choppy conditions. The system's gradient-based visual feedback, ATR ribbon visualization, comprehensive dashboard, and multi-dimensional filtering make it essential for traders seeking reliable trend-following approaches with clear conviction measurement across cryptocurrency, forex, and equity markets. The combination of adaptive bands, strength-based transparency, and intelligent filtering creates an institutional-grade trend system suitable for systematic trading strategies.

Trend Fusion Indicator🎯 Trend Fusion Indicator🎯
Professional trading indicator combining EMA momentum with Supertrend volatility for high-probability signals.
📊KEY FEATURES:
• 9 EMA & Supertrend (10,3) crossover signals
• Visual trend direction with colored fills
• Buy/Sell arrows at crossover points
• Real-time trend tracking
• Clean, professional interface
⚡SIGNAL LOGIC:
✅ BUY: When EMA crosses ABOVE Supertrend
✅ SELL: When EMA crosses BELOW Supertrend
🎨VISUAL INDICATORS:
• Green Zone/Fill: Bullish trend (EMA > Supertrend)
• Red Zone/Fill: Bearish trend (EMA < Supertrend)
• Triangle Arrows: Entry signals
• Background Colors: Trend confirmation
⚙️CUSTOMIZABLE SETTINGS:
• EMA Length (Default: 9)
• Supertrend ATR Length (Default: 10)
• Supertrend Factor (Default: 3.0)
🔔ALERTS INCLUDED:
• Buy Alert: EMA crosses above Supertrend
• Sell Alert: EMA crosses below Supertrend
📈 BEST FOR:
• Swing Trading
• Day Trading
• Trend Following
• Market Reversals
⚠️ DISCLAIMER: This indicator is for educational purposes only.
Trading involves risk. Not financial advice. Use at your own risk.

Filtered TEMA CrossoverFiltered Dual TEMA Crossover
This indicator is a trend-following tool based on the classic Dual Triple Exponential Moving Average (TEMA) Crossover strategy, enhanced with two robust filters: the Chop Index and the Average Directional Index (ADX).
The TEMA is known for its low lag and high responsiveness, making the crossover an effective signal for trend reversals. However, trading TEMA crossovers during sideways, choppy markets often leads to false signals. This is where the filters come in.
Key Features
▪️Dual TEMA Crossover: Plots two customizable TEMA lines (Fast and Slow) for clear visualization of the primary trend direction.
▪️Intelligent Signal Filtering: Buy and Sell signals are generated only when the market confirms it is in a trending state, thanks to two integrated filters:
➖Chop Index Filter: Blocks signals when the market is detected as sideways or consolidating (Chop Index reading above a user-defined threshold).
➖ADX Filter: Ensures signals are only taken when the trend strength is sufficient (ADX reading above a user-defined minimum threshold).
▪️Customizable Signals: Full control over the signal shapes (Arrows, Triangles, etc.), colors, text, and size.
How to Use It
Use the Filtered Dual TEMA Crossover to enter positions on trend continuation or reversal while dramatically reducing exposure to low-quality, whipsawing signals common in non-trending environments.
Before the filters:
After the filters:
Minimize Noise. Maximize Clarity. Trade the Trend.

EMA Cross with SLEMA Cross with adjustable SL.
Created for M5 timeframe chart.
Best combine with MACD.

9/21 EMA Trend TOP rIGHT CORNER INDICATORCrossover indicator for the 9 & 21 EMA. Buy Sell for cross up or down respectively. Daily, weekly and Monthly trend.

VWAP TrendSignalVWAP TrendSignal
VWAP (Volume-Weighted Average Price) is the market’s true fair value — the benchmark institutions use to see when price is balanced, extended, or trending with real intent.
Price often snaps back when it moves too far (mean reversion), and only shows genuine strength when it holds above or below VWAP.
VWAP TrendSignal makes this insight effortless by color-coding VWAP direction:
Yellow = VWAP rising → bullish pressure
Red = VWAP falling → bearish pressure
No bands. No noise. Just pure directional clarity.
Anchor VWAP to the Session, Week, Month, Quarter, or Year, and tailor the Slope Smoothing Filter to your timeframe:
1–2 smoothing → fast & reactive (1–5m scalping)
3–5 smoothing → clean & stable (5–15m intraday)
6–10 smoothing → slow flips (1H–4H swings)
10–15 smoothing → macro bias only (Daily/Weekly)
The line adapts to how you trade.
How to Use It
Mean Reversion
When price stretches far from VWAP, expect pullbacks or snapbacks.
Trend Direction
Yellow supports long bias, red supports short bias.
Simple, reliable, instantly visible.
Balance Zones
Price sitting near VWAP = compression, buildup, or chop.
A perfect signal to wait or prepare for a breakout.
Why It Works
VWAP TrendSignal distills institutional logic into a clean, single-line tool.
It shows fair value, trend slope, and balance all at once — making your chart clearer and your decisions faster.
Once you get used to reading it, trading without it feels blind.

Trend Pulse Algo (LTM)Trend Pulse Algo LTM Indicator Description
Overview
Trend Pulse Algo LTM is an advanced multi layer technical indicator designed for TradingView that combines moving average MA crossovers confirmation signals pivot based structure analysis imbalance zone detection and overextension warnings to identify potential trend shifts continuations and reversal points. It aims to provide traders with reliable entry and exit signals in trending markets while highlighting areas of market inefficiency imbalances and overextended price moves that could signal exhaustion.
This indicator operates on a pulse concept where it detects rhythmic shifts in market momentum through layered MAs a quick MA for short term sensitivity a mid MA for intermediate confirmation and a long MA as a baseline trend filter. Signals are generated based on alignments and crosses between these MAs but with added layers of confirmation to reduce false positives such as requiring consecutive bars above below the long MA and breaks of prior pivot highs lows. It incorporates higher timeframe HTF analysis for imbalance zones to capture broader market context making it suitable for swing trading trend following or scalping on lower timeframes when combined with the overextension detector.
Unlike simple MA crossover systems for example standard dual EMA strategies this algo uses adaptive MA types based on timeframe pivot deviation for structural breaks and a tally based confirmation to filter noise. Imbalance zones identify fair value gaps or inefficiencies between candle bodies and wicks where price may retrace to fill. Overextension is calculated relative to the mid MA using a rolling mean absolute deviation MAD ratio highlighting potential tops bottoms in strong trends. The result is a visually clean or detailed based on mode overlay that colors bars backgrounds plots labels for signals and pivots and draws zones to guide decision making.
How It Works
MA Layers and Signal Generation
Three MAs quick mid long are computed using either SMA or EMA selected dynamically based on the charts timeframe for optimal responsiveness for example EMA on lower TFs for faster signals.
Early Signals A crossover of the quick MA above the mid MA while above the long MA triggers a Possible Bull label indicating early momentum shifts. A crossunder below triggers Possible Bear.
Confirmed Signals Bullish confirmation requires a set number of bars closing above the long MA plus alignment quick greater than mid and a break above the prior pivot high. Bearish requires bars below the long MA and a break below the prior pivot low. This uses a counter mechanism to ensure persistence reducing whipsaws. Breaks are detected via crossovers under of close versus prior highs lows.
State persistence tracks the current regime bull bear warn early coloring the chart accordingly until a new signal overrides it.
Pivot Detection and Structure
Pivots are identified by scanning for highs lows separated by a minimum bar depth with a percentage deviation threshold to confirm validity. This follows a zigzag like approach but with deviation filtering for robustness.
Labels like HH Higher High HL Higher Low LH Lower High LL Lower Low highlight market structure helping identify trends for example HH HL for uptrends or breakdowns. These are used internally to validate signal breaks.
Imbalance Zones
Zones detect imbalances or gaps between candle bodies and prior highs lows where unfilled inefficiencies attract price.
For bullish zones If open greater than close and high minus low two less than zero a zone is drawn from calculated top bottom limits. Bearish similarly for close greater than open.
Supports current TF HTF or both. Zones extend rightward until filled price touches the opposite side or mid line if enabled then either delete or shorten based on settings. Mid lines can act as fill triggers for partial closures.
HTF data is fetched via security for broader context resetting on new HTF bars.
Overextension Indicator
Measures price deviation from the mid MA relative to a rolling average RMA of relative deviations over a length.
Multipliers define tiers mild for example two times avg deviation moderate three times extreme four times. Circles plot above below bars in bull bear states when thresholds are exceeded signaling potential reversals for example red for extreme tops in uptrends. This is akin to a Bollinger Band squeeze expansion but normalized to MA distance for trend specific warnings.
Chart Coloring and Visuals
Background or candle coloring reflects the state green for bull red for bear orange for warn blue for early.
Modes control clutter Clean hides MAs zones pivots Balanced shows essentials Detailed includes all.
How to Use It
Setup Add to your chart via TradingViews indicator search. Adjust inputs based on asset timeframe for example shorter MA periods for volatile cryptos longer for stocks.
Trading Strategy Ideas
Trend Following Enter long on Confirmed Bull labels exit on Confirmed Bear or extreme overextension circles. Use imbalance zones as support resistance for stops targets for example buy dips to unfilled bullish zones.
Reversal Scalping Watch for Possible Bull Bear near pivot labels for example HL LL and overextension in the opposite direction. Confirm with zone fills.
Multi TF Analysis Set HTF to D for daily context on hourly charts zones from HTF often act as magnets.
Risk Management Place stops below prior lows in bulls or above highs in bears. Target zone edges or MA crosses. Avoid trading against strong states without confirmation.
Alerts Set up via TradingView for Early Up Down or Up Down Confirm to notify on signal edges.
Limitations Best in trending markets may lag in ranges. Test on historical data no indicator is foolproof combine with volume price action.
Detailed Input Settings
Below is a comprehensive breakdown of all user adjustable inputs from the settings panel grouped as in the script. Each explains what it controls its effect on the indicators logic and usage tips. Defaults are provided for reference.
Chart Mode
Chart Mode default Detailed Mode options Clean Mode Balanced Mode Detailed Mode
Controls visual detail level. Clean Mode hides MAs imbalance zones and pivots for a minimal overlay focused on signals and coloring. Balanced Mode shows MAs and signals but omits zones pivots. Detailed Mode displays everything for in depth analysis. Use Clean for live trading to reduce clutter Detailed for backtesting structure review.
Display Settings
Color Style default Candles options Background Candles
Determines how states bull bear warn early are visualized. Background colors the chart area for example green shading for bull. Candles colors bar bodies wicks directly. Background is subtler for multi indicator setups Candles emphasizes signals on naked charts.
Imbalance Zone HTF Config
Higher TF Period default D
Sets the higher timeframe for imbalance detection for example D for daily four H for four hour. This fetches broader data to identify significant zones. Use a TF four to five times your current for context for example daily on one H charts avoid very high TFs like W on intraday for relevance.
TF Mode default Current TF options Current TF Current plus HTF HTF Only
Defines timeframe handling for zones. Current TF uses only your charts TF. Current plus HTF combines both for layered zones. HTF Only ignores current TF. Current plus HTF is ideal for multi TF confluence HTF Only simplifies for swing traders.
Shift default ten min zero max five hundred
Horizontal offset in bars for current TF zone labels. Higher values shift labels rightward to avoid overlap. Adjust if labels crowd the chart.
HTF Shift default twenty min zero max five hundred
Similar to Shift but for HTF zone labels. Use larger offsets for HTF to distinguish them visually.
Imbalance Zone Core Options
Mid Line Fill default false
Enables a midpoint line in each zone zones fill close short when price touches this mid line instead of the far edge. Activates partial fill logic for more conservative zone closure. Enable for tighter risk in volatile markets.
Remove Filled Zones default true
If true completely deletes filled zones if false shortens them to the fill point keeping history. True clears clutter false retains context for review.
Display TF on Zone default false
Shows the timeframe for example D IZ on zone labels. Useful for distinguishing current versus HTF zones in combined mode.
Max Upward Zones default twenty min one max fifty
Limits displayed bullish upward zones removes oldest when exceeded. Lower for cleaner charts higher for historical depth.
Max Downward Zones default twenty min one max fifty
Same as above but for bearish downward zones.
Imbalance Zone Visuals
Upward Zone color green at ninety percent transparency
Color for current TF upward imbalance zones. Adjust opacity for visibility.
HTF Upward Zone color lime at eighty percent transparency
Color for higher timeframe upward imbalance zones. Differentiate from current for example lighter shade.
Downward Zone color red at ninety percent transparency
Color for current TF downward imbalance zones.
HTF Downward Zone color maroon at eighty percent transparency
Color for higher timeframe downward imbalance zones.
Mid Line Color color white at eighty five percent transparency
Color for the optional midpoint line in zones.
Text Color color white
Color for text labels on zones.
MA Layers
Quick MA Period default ten min one
Length for the fastest moving average sensitive to short term price. Shorter for example five for scalping longer for example fifteen for less noise.
Mid MA Period default twenty min one
Intermediate MA length used for crossovers and overextension base. Typically two times quick for balance.
Long MA Period default fifty min one
Baseline trend filter length. Longer for example one hundred for major trends shorter for active trading.
MA Variants by Period
Under one H default EMA options SMA EMA
MA type for timeframes under one hour for example EMA for faster response.
One H to less than five H default EMA options SMA EMA
MA type for one to five hour timeframes.
Five H to less than one D default EMA options SMA EMA
MA type for five hour to one day timeframes.
One D plus default EMA options SMA EMA
MA type for daily and higher timeframes. Adapt to market EMA for trends SMA for mean reversion.
Signal Confirmation
Bull Confirm Bars default one min zero
Consecutive bars needed above long MA for bull confirmation. Zero for instant higher for example three filters noise but delays entries.
Bear Confirm Bars default two min zero
Same for bear below long MA. Asymmetrical default higher for bears assumes uptrend bias.
Pivot Detection
Pivot Depth default six min one
Min bars between pivots. Higher reduces minor swings lower captures more structure.
Pivot Deviation percent default one point zero min zero point one
Percent change required for new pivot. Higher ignores small moves for example two percent for stocks zero point five percent for forex.
Display HH and HL default true
Shows labels for Higher Highs Lows bullish structure.
Display LH and LL default true
Shows labels for Lower Highs Lows bearish structure.
Overextension Indicator
Show Overextension Circles Potential Tops default true
Enables circles above bars in bull states for potential tops.
Show Overextension Circles Potential Bottoms default true
Enables below bars in bear states for bottoms.
Overextension Length default fourteen min one
Period for rolling relative deviation average. Matches RSI STOCH defaults for alignment.
Mild Multiplier default two point zero min zero point zero
Threshold for mild overextension yellow circle. Zero disables tier.
Moderate Multiplier default three point zero min zero point zero
For moderate orange.
Extreme Multiplier default four point zero min zero point zero
For extreme red. Tune lower for sensitive warnings in ranging markets.

Dashboard Trader _V1
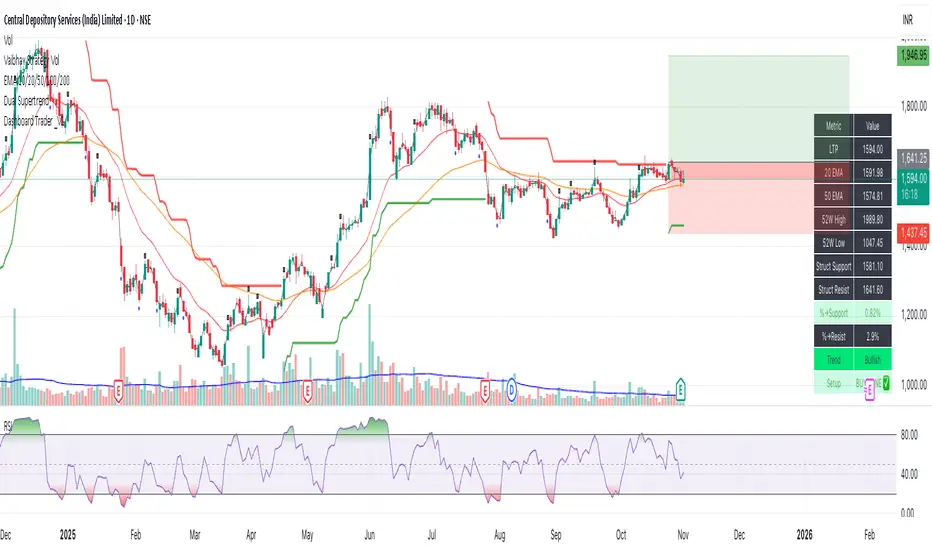
📊 Dashboard Trader – Adaptive Structure, Trend & Zones
Description:
NSE Dashboard V3 is a next-gen support–resistance and trend-mapping indicator designed for positional and swing traders. It combines price structure, moving averages, and adaptive pivot logic to highlight Buy Zones, Take-Profit Zones, and overall market direction — all inside a clean, compact dashboard.
⸻
🧩 What It Does
• Auto-detects structural support & resistance zones using adaptive pivot clustering logic.
• Tracks broken levels dynamically — old supports removed, new ones added.
• Identifies trend bias using dual EMAs (20-EMA & 50-EMA).
• Displays a live dashboard table showing:
• LTP (Last Traded Price)
• 20 EMA / 50 EMA
• 52-week High & Low (true daily data)
• Structural Support & Resistance
• % Distance to each zone
• Trend direction
• Trade Setup Zone → BUY ✅ / TAKE PROFIT ⚠ / NEUTRAL
⸻
🧠 How to Trade It
1. Check the trend:
• 20 EMA > 50 EMA → Bullish bias (look for long entries).
• 20 EMA < 50 EMA → Bearish bias (look for short or avoid longs).
2. Enter near support:
• When price is ≤ 2% above Struct Support and trend is bullish → BUY ZONE ✅
3. Exit or reduce near resistance:
• When price is ≤ 2% below Struct Resistance → TAKE PROFIT ⚠
4. If no valid resistance (at ATH):
• Trail stop below 20 EMA or last swing low.
⸻
⚙️ Key Features
• EMA-based trend detection
• Dynamic structural zone calculation (auto-updates)
• Daily timeframe 52-week High/Low
• Auto color-coded zones and table
• Works on all NSE stocks, futures, or indices
• Optional refresh every new bar
• Lightweight – optimized for live chart use
⸻
📈 Best Used For
• Swing trading / Positional setups (Daily or 4-hour charts)
• Intraday confirmation on lower timeframes (15-min+)
• Trend continuation entries and risk-defined reversals
⸻
⚠️ Disclaimer
This indicator is for educational purposes only.
It does not constitute financial advice or a buy/sell recommendation.
Always combine with your own price action, volume, and risk management.
⸻
💬 Author’s Note
Built for traders who think in zones, not signals.
Trade where risk is smallest and structure is strongest.
— Wealthcafe Investments
Portfolio Strategy TesterThe Portfolio Strategy Tester is an institutional-grade backtesting framework that evaluates the performance of trend-following strategies on multi-asset portfolios. It enables users to construct custom portfolios of up to 30 assets and apply moving average crossover strategies across individual holdings. The model features a clear, color-coded table that provides a side-by-side comparison between the buy-and-hold portfolio and the portfolio using the risk management strategy, offering a comprehensive assessment of both approaches relative to the benchmark.
Portfolios are constructed by entering each ticker symbol in the menu, assigning its respective weight, and reviewing the total sum of individual weights displayed at the top left of the table. For strategy selection, users can choose between Exponential Moving Average (EMA), Simple Moving Average (SMA), Wilder’s Moving Average (RMA), Weighted Moving Average (WMA), Moving Average Convergence Divergence (MACD), and Volume-Weighted Moving Average (VWMA). Moving average lengths are defined in the menu and apply only to strategy-enabled assets.
To accurately replicate real-world portfolio conditions, users can choose between daily, weekly, monthly, or quarterly rebalancing frequencies and decide whether cash is held or redistributed. Daily rebalancing maintains constant portfolio weights, while longer intervals allow natural drift. When cash positions are not allowed, capital from bearish assets is automatically redistributed proportionally among bullish assets, ensuring the portfolio remains fully invested at all times. The table displays a comprehensive set of widely used institutional-grade performance metrics:
CAGR = Compounded annual growth rate of returns.
Volatility = Annualized standard deviation of returns.
Sharpe = CAGR per unit of annualized standard deviation.
Sortino = CAGR per unit of annualized downside deviation.
Calmar = CAGR relative to maximum drawdown.
Max DD = Largest peak-to-trough decline in value.
Beta (β) = Sensitivity of returns relative to benchmark returns.
Alpha (α) = Excess annualized risk-adjusted returns relative to benchmark.
Upside = Ratio of average return to benchmark return on up days.
Downside = Ratio of average return to benchmark return on down days.
Tracking = Annualized standard deviation of returns versus benchmark.
Turnover = Average sum of absolute changes in weights per year.
Cumulative returns are displayed on each label as the total percentage gain from the selected start date, with green indicating positive returns and red indicating negative returns. In the table, baseline metrics serve as the benchmark reference and are always gray. For portfolio metrics, green indicates outperformance relative to the baseline, while red indicates underperformance relative to the baseline. For strategy metrics, green indicates outperformance relative to both the baseline and the portfolio, red indicates underperformance relative to both, and gray indicates underperformance relative to either the baseline or portfolio. Metrics such as Volatility, Tracking Error, and Turnover ratio are always displayed in gray as they serve as descriptive measures.
In summary, the Portfolio Strategy Tester is a comprehensive backtesting tool designed to help investors evaluate different trend-following strategies on custom portfolios. It enables real-world simulation of both active and passive investment approaches and provides a full set of standard institutional-grade performance metrics to support data-driven comparisons. While results are based on historical performance, the model serves as a powerful portfolio management and research framework for developing, validating, and refining systematic investment strategies.

SZO - Signal Zone Oscillator ## Signal Zone Oscillator - SZO
**Created by:** @TraderCurses
**Version:** 1.0 (October 2025)
### ▌ OVERVIEW
The Signal Zone Oscillator (SZO) is a comprehensive momentum tool designed to provide a clearer, more nuanced view of market dynamics. It synthesizes three of the most powerful classic indicators—RSI, a unique MACD Ratio, and the Stochastic oscillator—into a single, unified signal.
The indicator's core feature is the **"Signal Zone"**: a colored area between the main oscillator line and its moving average filter. This zone makes it incredibly easy to visualize shifts in momentum, trends, and potential entry/exit points.
### ▌ KEY FEATURES
* **Composite Formula:** Combines RSI, MACD Ratio, and Stochastic using a weighted average to measure underlying market momentum.
* **The Signal Zone:** The flagship feature. The area between the SZO line and its filter is colored **green** in a bullish context (SZO above filter) and **red** in a bearish context (SZO below filter).
* **Dynamic Coloring:** Both the main SZO line and its filter change color dynamically, providing instant feedback on direction and strength.
* **Zero-Line Reference:** A dashed zero line acts as a classic equilibrium level, helping to confirm stronger bullish or bearish momentum.
* **Fully Customizable:** Every parameter is adjustable. You can change the lengths, sources, and even the weights of the core indicators from the settings menu.
* **Built-in Alerts:** Comes with pre-configured alerts for crossovers of the filter and the zero line, allowing you to automate your monitoring.
### ▌ HOW TO USE IT
The SZO provides several clear signals for traders:
1. **Bullish Signal:**
* The SZO line crosses **above** its filter.
* The Signal Zone turns **green**.
* A cross above the zero line can be used as further confirmation of strong bullish momentum.
2. **Bearish Signal:**
* The SZO line crosses **below** its filter.
* The Signal Zone turns **red**.
* A cross below the zero line can be used as further confirmation of strong bearish momentum.
3. **Divergences:**
* Like any oscillator, look for divergences between the SZO's peaks/troughs and the price action to spot potential reversals.
This tool is designed for traders who want to cut through the noise and get a clear, actionable signal from multiple momentum sources at once. Happy trading!

AI Bot Regime Feed (v6) — stableThis indicator generates real-time, structured JSON alerts for external trading bots or automation systems.
It combines multiple technical layers to identify market regimes and high-probability buy/sell events, and sends them to any webhook endpoint (e.g., a FastAPI or Zapier listener).

Stochastic Arrows Crossover with Alerts [TED]This indicator highlights key Stochastic %K and %D crossovers, helping traders identify potential buy and sell signals with visual triangle arrows and custom alerts. It uses the Stochastic Oscillator, which is a momentum indicator that compares the closing price to the price range over a given period.
Key Features:
Visual Arrows: The indicator plots green triangle-up arrows for bullish crossovers and red triangle-down arrows for bearish crossovers on the chart.
Customizable Parameters: You can adjust the period for %K, %D, and the smoothing factor to fit your trading strategy.
Overbought/Oversold Zones: The background color fills between the 80 (Overbought) and 20 (Oversold) levels, helping you visualize potential reversal areas.
Alerts: Set up dynamic alerts based on the crossover events, including:
Bullish and Bearish Crossovers
Crossover Events from the Previous Bar
How to Use:
Bullish Signal: When the %K line crosses above the %D line, it signals a potential buying opportunity. This is visually represented with a green triangle-up arrow on the chart.
Bearish Signal: When the %K line crosses below the %D line, it signals a potential selling opportunity, indicated by a red triangle-down arrow on the chart.
Overbought/Oversold Zones: The background color fill helps identify overbought or oversold market conditions, which may indicate a potential reversal.
Custom Alerts:
You can set alerts for:
Bullish Crossover: When the %K line crosses above the %D line.
Bearish Crossover: When the %K line crosses below the %D line.
Previous Bar Crossovers: Alerts for crossovers from one bar ago (helpful for backtesting).
Instructions:
Add the Indicator: Apply this Stochastic Arrows Crossover indicator to your chart from the public library.
Customize Settings: Adjust the input parameters like K period, D period, and Smoothing to match your preferred settings.
Enable Alerts:
Once added to your chart, you can set up alerts from the Alert Panel on TradingView.
Choose from the available alert conditions (Bullish Crossover, Bearish Crossover, or Crossover from the Previous Bar).
Set your desired timeframe and alert message to receive notifications for the crossovers.
Monitor the Chart: Keep an eye on the arrows and background color fill to interpret potential trade setups based on the Stochastic Oscillator's behavior.
MAxRSI Signals [KedArc Quant]Description:
MAxRSI Indicator Marks LONG/SHORT signals from a Moving Average crossover and (optionally) confirms them with RSI. Includes repaint-safe confirmation, optional higher-timeframe (HTF) smoothing, bar coloring, and alert conditions.
Why combine MA + RSI
* The MA crossover is the primary trend signal (fast trend vs slow trend).
* RSI is a gate, not a second, separate signal. A crossover only becomes a trade signal if momentum agrees (e.g., RSI ≥ level for LONG, ≤ level for SHORT). This reduces weak crosses in ranging markets.
* The parts are integrated in one rule: *Crossover AND RSI condition (if enabled)* → plot signal/alert. No duplicated outputs or unrelated indicators.
How it works (logic)
* MA types: SMA / EMA / WMA / HMA (HMA is built via WMA of `len/2` and `len`, then WMA with `sqrt(len)`).
* Signals:
* LONG when *Fast MA crosses above Slow MA* and (if enabled) *RSI ≥ Long Min*.
* SHORT when *Fast MA crosses below Slow MA* and (if enabled) *RSI ≤ Short Max*.
* Repaint-safe (optional): confirms crosses on closed bars to avoid intrabar repaint.
* HTF (optional): computes MA/RSI on a higher timeframe to smooth noise on lower charts.
* Alerts: crossover alerts + state-flip (bull↔bear) alerts.
How to use (step-by-step)
1. Add to chart. Set MA Type, Fast and Slow (keep Fast < Slow).
2. Turn Use RSI Filter ON for confirmation (default: RSI 14 with 50/50 levels).
3. (Optional) Turn Repaint-Safe ON for close-confirmed signals.
4. (Optional) Turn HTF ON (e.g., 60 = 1h) for smoother signals on low TFs.
5. Enable alerts: pick “MAxRSI Long/Short” or “Bullish/Bearish State”.
Timeframe guidance
* Intraday (1–15m): EMA 9–20 fast vs EMA 50 slow, RSI filter at 50/50.
* Swing (1h–D): EMA 20 fast vs EMA 200 slow, RSI 50/50 (55/45 for stricter).
What makes it original
* Repaint-safe cross confirmation (previous-bar check) for reliable signals/alerts.
* HTF gating (doesn’t compute both branches) for speed and clarity.
* Warning-free MA helper (precomputes SMA/EMA/WMA/HMA each bar), HMA built from built-ins only.
* State-flip alerts and optional RSI overlay on price pane.
Built-ins used
`ta.sma`, `ta.ema`, `ta.wma`, (HMA built from these), `ta.rsi`, `ta.crossover`, `ta.crossunder`, `request.security`, `plot`, `plotshape`, `barcolor`, `alertcondition`, `input.*`, `math.*`.
Note: Indicator only (no orders). Test settings per symbol. Not financial advice.
⚠️ Disclaimer
This script is provided for educational purposes only.
Past performance does not guarantee future results.
Trading involves risk, and users should exercise caution and use proper risk management when applying this strategy.

Trend ChannelThis Trend Channel is designed to simplify how traders view trends, while also keeping track of potential shifts in trends with signals. It is designed for traders that prefer less over more.
The indicator can be used for trend following, trend reversals and confirmation in combination with price or other indicators.
At the core is one EMA and a smoothed volatility based channel around it.
The purpose of the channel is to avoid false signals on trend reclaim or trend loss and instead identify trend deviations.
The indicator also incorporates long and short EMA cross-over signals to recognize possible shifts in trend without having to overlay multiple EMAs and keep the chart cleaner.
Additionally the indicator fires warnings for potential false signals on golden/death crosses with a letter "W" above/below the signal candle. Those warnings are based on the distance between price and the crossover. When the distance is above a certain threshold the indicator fires a warning that price might mean revert.
Traders can customize all inputs in the settings.

RMA Smoothed RSIRMA Smoothed RSI
Description:
An enhanced RSI built for cleaner intraday and swing reads. It applies RMA smoothing to damp noise.
How It Works
RSI (RMA-Smoothed):
Computes classic RSI from price changes and smooths the result with an additional RMA (user-controlled 3–7, where 5 is the sweet spot). This reduces whipsaw while preserving shifts in momentum.
How to Interpret
50 Midline = Bias Filter: Above 50 favors strength; below 50 favors weakness.
RSI vs RSI-MA Crosses: Cross up can precede thrust or mean-revert toward 50; cross down the opposite.
Inputs
Length: RSI period (default 14).
Source: Price source for RSI (default Close).
Smoothing: RMA smoothing length on RSI (3–7; default 3; 5 sweet spot).
Calculate Divergence: Toggle to compute pivots/divergences and enable alerts.
Moving Average Type: None, SMA, EMA, WMA, VWMA (default EMA).
MA Length: Length of the RSI-based MA (separate from RSI length).
Best For
Traders who want a cleaner RSI read without losing responsiveness.
Scalpers timing momentum shifts around the 50 line and MA crosses.
Swing traders using divergences as early reversal context.
Pro Tips
For fast intraday charts, start with Length 14, Smoothing 3–5, and EMA as the RSI-MA.
Use 50 reclaims/rejections as a simple regime filter.
Combine divergence labels with volume surges, key S/R, or volatility tools (e.g., BBW/TTM squeeze) to time entries.
Divergence alerts fire only if Calculate Divergence is enabled—keep it on if you rely on signals.
