Moon TraderHello Fellow Traders!
-------------------------------------------
This is the newest addition to Gnome Alerts PRO!
This Bot Script works on all Crypto, Leverage, Forex, & Traditional Exchanges.
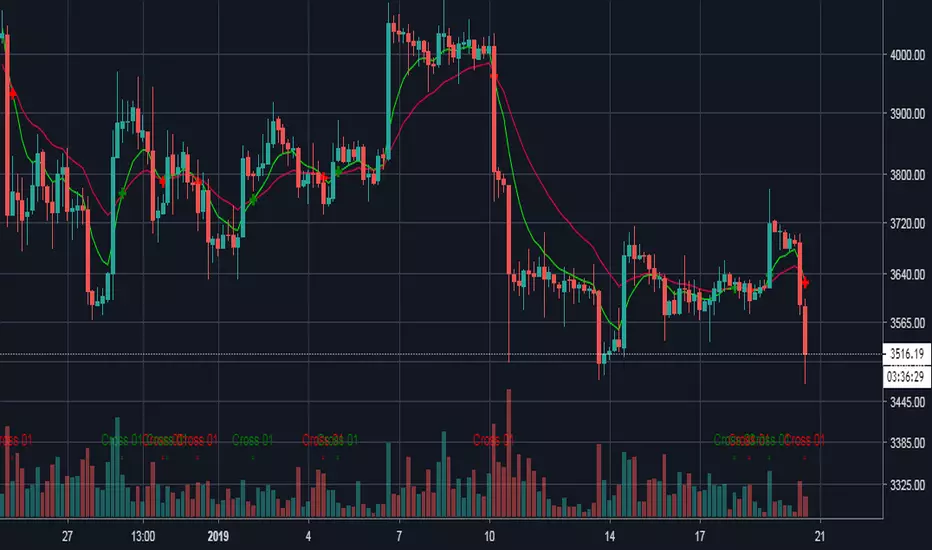
Trade of Major TRENDS with no repaint using my proprietary MVG AVG Cross Script.
FEATURES
------------------------
*Autoview Ready*
- Easy to Use
- Backtesting Included
- Stop Loss
More info on how gain access in my profile!
Crossover

TJ-StochFinally I am setting this beast free.
This is one of my favorite indicators and it has everything what there is to Stochastic and Stochastic RSI.
The TJ-Stoch is a heavy mod and merge of Stochastic and Stochastic RSI.
There are some very important modifications on it.
- The green and red line at 40 and 90 points.
The stochastic lines like getting rejected at both lines.
A rejection at the 40 point line, from above or from below, mostly has an impulse move to it.
The same applies to the 90 point line.
The 90 point line nevertheless, has mostly an impulse move, when it is getting crossed down.
The stochastic lines staying above the 90 point line, are an indication for upcoming impulse moves.
- The lines itself
The stochastic lines have their original colors; blue for K , the faster moving line and orange for D the slower moving line.
Nevertheless, you can identify the original colors only, when those are ascending.
When the K and the D line are descending, those turn red, so you can immediately see what move is what and where it is actually descending or ascending.
- The crosses
One of the most important treats that Stochastic and Stochastic RSI have, are the crossovers. Sometimes these are hard to identify.
Therefore, a crossover is marked with a green cross at the top. A cross-down is marked with a red cross at the top.
Like and Follow me and you will find this page interesting because I am a TA expert and professional day trader in crypto since 2012 that does daily updates and new posts about the hottest and most discussed coins.
Cheers, TJ

Repulsion Moving Average - Least Crosses MAA Moving Average With Less Whipsaws Signals
The cross of the price with a moving average is one of the easiest strategy in technical analysis and could have worked if market price wasn't so noisy (In general periods of 1 to 20 produces the most whipsaws) . So it is possible to create a moving average who can manage to escape those noisy periods and produce 0 whipsaws ?
This question was asked by one of my work colleagues and i responded : "well... almost 0".
The Motion Of A Moving Average
Moving Average estimate the Trend and will always have phase shift, they will still follow the price and cross it during high volatility or low volatility periods, and when a moving average cross the price during a low volatility period you can expect lot of crosses.
In order to fix this behaviour a simple calculation exist :
FixMa = LongPeriodMA + MediumPeriodMA - ShortPeriodMA
We can see things in that way, the medium term MA is high pass filtered (subtracted) with a short term MA and the result is summed to a long term MA. We give more reactivity to our long term MA and thus creating some kind of repulsion motion with the price. Of course this can sometimes make the filter kinda zero-lag to some price periods (when the long term MA is near the price) .
Comparison
In red a simple moving average of period 100 and in blue our repulsion moving average :
In the image the short term moving average period is 100, since the long term period of the moving average is equal to short term x 3 you could be interested to look at the comparison of our moving average with the actual long term moving average :
Less crosses, i think you can see it.
Something to notice is that its always a tradeoff between Signal Speed and Signal Numbers , a classic moving average create faster signals but also a high numbers of them, a classic trailing stop create less signals but slowest ones, our moving average is some kind of average between those indicators.
Improvement Methods - Choice of The Filter/More Terms
A bad behaviour of our filter can be fixed by using filters who tend to create less crosses with the price or by developing the formula of our filter by adding more terms as follow :
fixma = ma(Price,a) + ma(Price,b) + ma(Price,c) - ma(Price,d) - ma(Price,e)
where a > b > c > d > e . The number of subtractive terms is equal to the number of summing terms - 1.
Way To Use
This indicator can be used like any moving average with cross strategy. Can also be used as a trailing stop.
No tests have been made proving that this indicator provide support and resistance levels, such signals come from more centered indicators.
Hope you enjoy
For any questions/demands feel free to pm me, i would be happy to help you :)

MA Crossover TypeDraws the up and down crossovers of a specified MA Type.
# Inputs
- MA Type: "sma", "ema", "swma", "vwma", "wma"
- Length >=1
- Source
- Offset >= 0
- Show cross Up?
- Show cross Down?
# Open Source
The code is open source @ github.com and uses the commonpine library github.com

13/21 EMA + Ichimoku Kinko Hyo StrategyThis trading strategy uses combination of the Ichimoku Kinko Hyo system with Fibonacci numbers based 13/21 exponential moving average ( EMA ) crossover, giving excellent results in trending assets !

EMA + Ichimoku Kinko Hyo StrategyThis trading strategy uses combination of the Ichimoku Kinko Hyo system with Fibonacci numbers based exponential moving average(EMA) and RSI 12/24 crossover, giving excellent results in trending stocks !


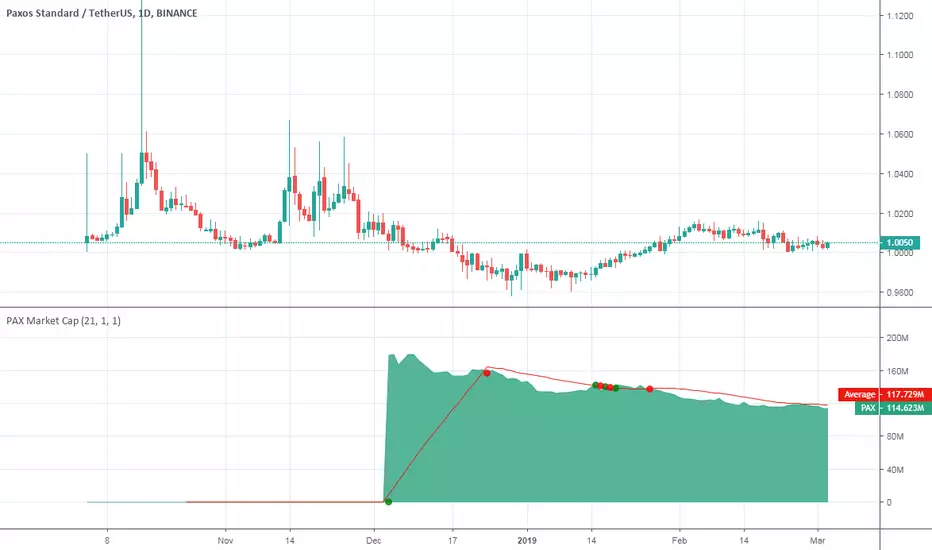
Paxos Standard Token Market CapHey there!
This is Paxos Standard Token market cap with some additional features.
Consider it as my Christmas gift to the community.
What is included
Dynamic market capitalization chart
Customizable SMA of the market capitalization
Crossovers highlighting
You can set alerts for crossovers
Alert for the specified positive % change
Alert for the specified negative % change
NOTE : The word "Dynamic" means that I did not hardcode the supply of the presented stablecoin. You can check it over time.
Good luck and happy trading!
TrueUSD Market CapHey there!
This is TrueUSD (TUSD) market cap with some additional features.
Consider it as my Christmas gift to the community.
What is included
Dynamic market capitalization chart
Customizable SMA of the market capitalization
Crossovers highlighting
You can set alerts for crossovers
Alert for the specified positive % change
Alert for the specified negative % change
NOTE : The word "Dynamic" means that I did not hardcode the supply of the presented stablecoin. You can check it over time.
Good luck and happy trading!

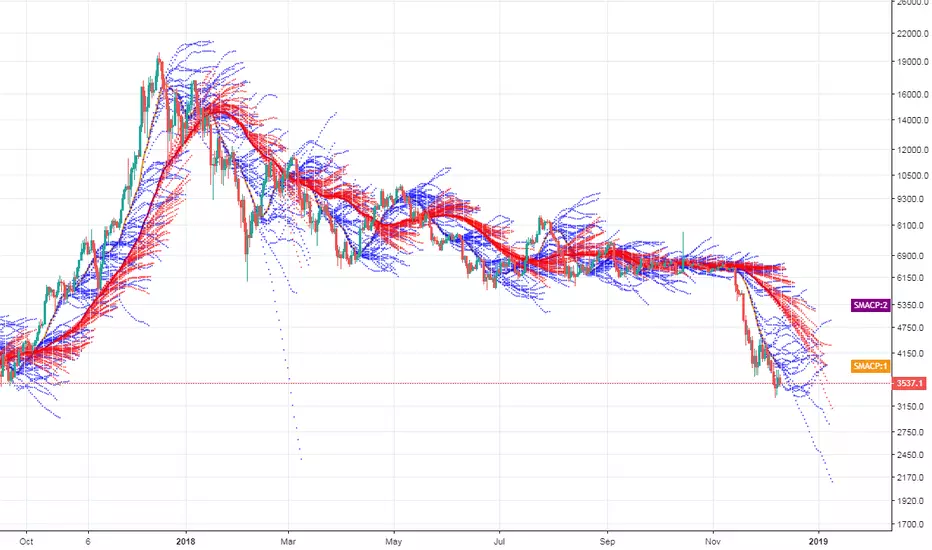
[RESEARCH] SMA Crossover PredictionHello traders and developers!
This "chinese dragon" indicator plots two SMA for the specified periods and their possible movements in the future using stochastic processes under the hood.
It's experimental and FREE because I haven't enough time to test it on each instrument and timeframe due to my main job (I'm really tired this year).
So, I invite you to become volunteers and test it. I will be glad to receive any feedback and suggestions from you.
If you want to try it out you can leave a comment or PM me to get access.
Good luck!
2 Moving Average Cross SignalsThis indicator is meant to aid those who use Moving Average crosses as part of their trading strategy. This can be used to help identify turning points in trends.
You can customize what timeframe the MAs are derived from (e.g. can use current timeframe, or can hold it to 1d timeframe across all other timeframes)
When the fast and slow MAs cross each other, the background of the candle where the cross happened will be highlighted green or red (changeable), this will help visualize where the crosses are happening, regardless of whether or not you actually want the moving average lines printed on the charts. This could help keep the chart less cluttered.
Finally, you can choose between SMAs, EMAs, WMAs, and Linear MAs.
Enjoy
HAMA alertHeikin Ashi + EMA alert
- all time frame
---------------------------------
BTCUSDT
Dump protect

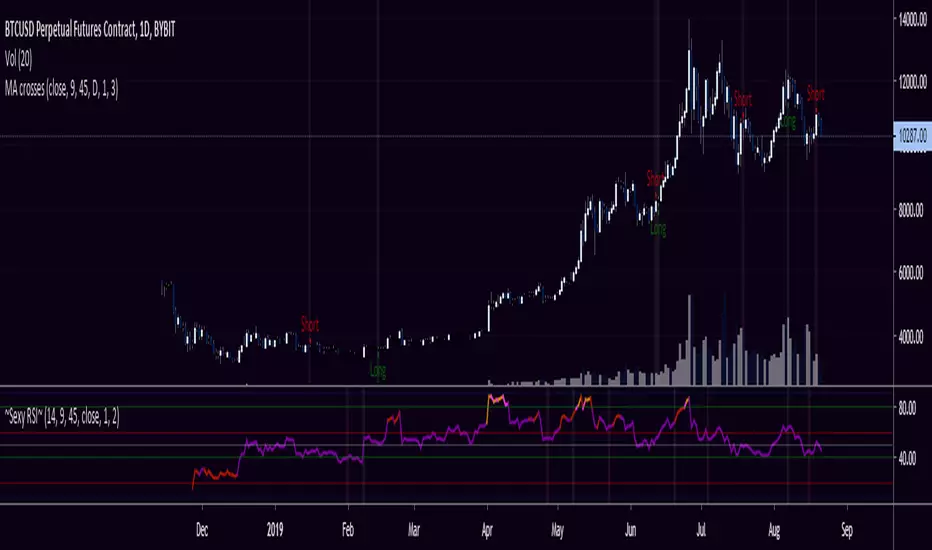
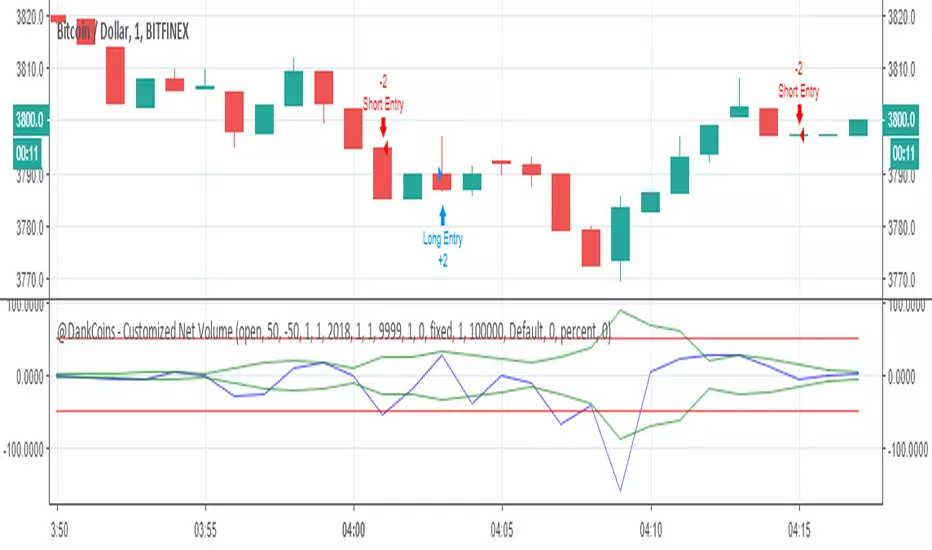
Help Requested - "Time-Slot" Delay for Crossover StrategyHello Tradingview Community,
I've been playing around with some various volume-based indicators, and recently have been experiencing a delay in the entries for my strategy for 2 minutes in this scenario. If the time is adjusted, it also is delayed 2 bars.
In this example, the "Short" position should enter when the blue line Crosses under the upper green line, and visa vera for the "Long" position. A simplified Pine Script is available below as well.
I have Googled this issue and attempted to modify the code with => criteria instead, but too no avail. Would appreciate any help or anyone who could point me in the right direction on this Time Delay Issue. Thanks!
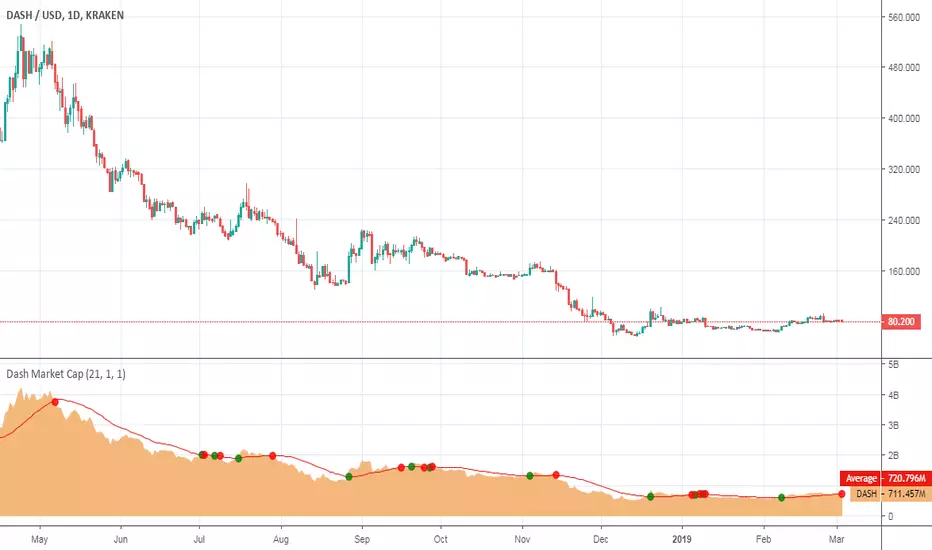
Dash Market CapHello traders!
This is Market Cap chart of Dash cryptocurrency with some features.
What is included
Dynamic market capitalization chart
Customizable SMA of the market capitalization
Crossovers highlighting
Alerts for crossovers
Alert for the specified positive % change
Alert for the specified negative % change
How to get access
Buy for only 20$ to get lifetime access to this indicator
Like and follow for more cool indicators!
Happy Trading!
GC Usual Moving AveragesManage the usual moving averages. Moving averages remain unchanged if the time resolution is different from some MA maintains coherence of the temporal framework that is being observed. Gaps can be observed when the resolution chosen is lower than that of the MA.

Keep It Simple, Stupid!This is a strategy that utilizes crossovers as entries and exits. You have quite a bit of freedom to choose the type of MA used, along with the source and length. You are also able adjust the backtest range. I will update with changes if any are needed, as well as a description of the update.

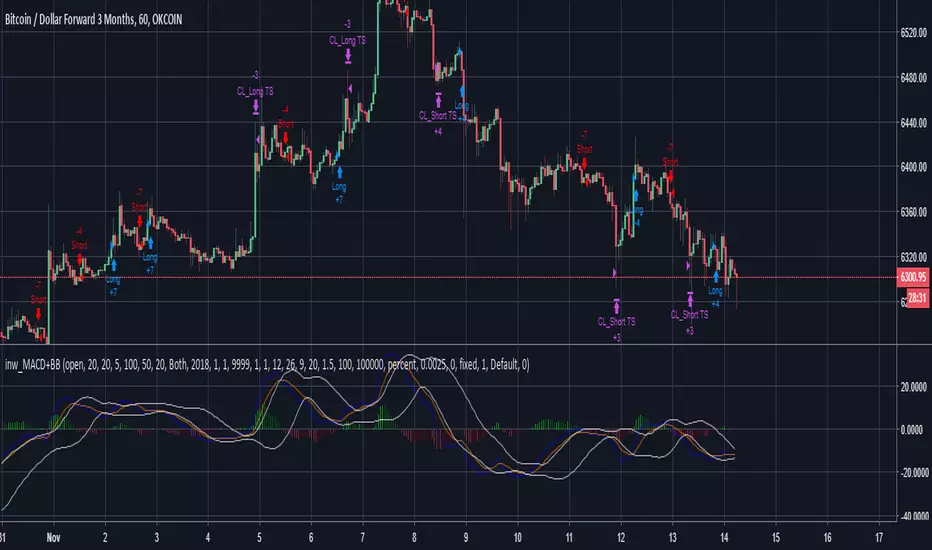
inwCoin MACD + BB Cross StrategySimple yet effective strategy by using MACD and BB the MACD line then cross it for short/long entry.
This strategy using trailing stop to exit position.
Klinger Volume OscillatorThis indicator was originally developed by Stephen J. Klinger (Stocks & Commodities, V.15:12 (December, 1997): "Identifying Trends with Volume Analysis").
NOTE : this is the only correct version of Klinger Volume Oscillator in the public library.
Like and follow for more open source indicators!
Happy Trading!

Add MA Crossing Method (short, medium, long) (D)Add three EMAs that are usually used in crossing tactics and alerts to signal buy/sell

EMA TEMA crossoverHello,
as usual recently the chart is bugged if I dare post a log one so I deleted and reposted...
here is a simple ema/team script that could allow you to catch trends.
You can play with parameters to get alerted of strong trends, or to detect trends early on.
I want to adapt this to an inside bar strategy, I am going to release that in a while, it is not my priority thought I am a countertrend trader, so I cannot say why, but what I have seen is inside bar breaks in very strong trends work very well.
There is a condition for this inidcator to work: you have to use it on a Heikin Ashi chart (the candle type, selectable in the area right of the timeframe).
Works sometimes. I advice backtesting any strategy before using. Idk maybe this could work decently, seems to have given big winners on bch recently. That huge one from 600 to 1800 lol. *3
* No one should pay for things this simple by the way...

HMA 55/80 Crossover Strategy - Multiple Crossing OptionsThis strategy concept is from ismail_tarim on TradingView, and on Twitter as @ismailtarim977. It is intended to be implemented on the daily chart . The original strategy is reflected, to the best of my ability and understanding, in the default settings.
There is an option to toggle plots being displayed. The plots accurately indicate when the events take place, rather than the delay from the strategy display.
// SYMBOL LEGEND //
Green 'X' indicates when price crosses up the desired HMA .
Green 'Up Arrow' shows the pullback entry on the crossed HMA .
Red "Down Arrow" shows the exit when prices closes below the HMA 55, or "Fast HMA".
If you notice something that needs to be changed or that could be added, please share it in the comments below. Thanks!
