Donchian MA Bands [LuxAlgo]The Donchian MA Bands script is a complete trend indicator derived from the popular Donchian channel indicator as well as various customizable moving averages to estimate trend direction and build support/resistance levels & zones.
🔶 USAGE
The indicator outputs various elements, the main ones being a lower dynamic zone (blue by default), an upper dynamic zone (in orange by default), and one support and resistance level/zones (red/green by default).
A prominent lower zone is indicative of an uptrend, while a prominent upper zone is indicative of a downtrend. These zones can be used as support/resistance as well.
Support/resistance zones and levels can be used using a breakout methodology or to determine price bounced if a level was tested multiple times.
The indicator contains various modes affecting the output of the indicator, described below.
🔹 Clouds
Clouds return one upper/lower dynamic zone and look/act similarly to a trailing stop. Price over the lower zone is indicative of an uptrend, and price under the upper zone is indicative of a downtrend.
🔹 Upper Band
The upper band mode returns a dynamic zone closer to prices during an uptrend, and farther away during a downtrend.
This band can act as a support during uptrends.
🔹 Lower Band
The lower band mode returns a dynamic zone closer to prices during an uptrend, and farther away during a downtrend.
This band can act as a resistance during downtrends.
🔹 Bands
Bands return both upper and lower zones, the zones are more apparent depending on the price trend direction, with uptrends being indicated by a more visible lower zone, and downtrends being indicated by a more visible upper zone.
Breakout dots are highlighted when price breakout the indicator displayed extremities, and can be indicative of a confirmed trend reversal.
These breakouts can be more effective for trend following during trending markets. Ranging markets might return breakouts highlighting the top/bottom.
🔶 DETAILS
The core of this script is the highest / lowest mean average (MA) value for a given number of bars back ( Donchian lines).
This is repeated a few times with the obtained values.
When Bands are chosen ( Style ) this will be repeated 1 more time.
The type of mean average can be customized ( Type MA ), as well as the number of bars back ( Length ).
Depending on the choice of bands ( Style ) the script will focus on certain area's of interest.
When the option Clouds , Upper band or Lower band is chosen, an extra feature, support/resistance (S/R), will be shown.
These color-filled areas are visible when there is a difference between the 2nd and 3rd highest/lowest values.
The lines/areas can be used for stop loss, entry, exit,...
You can set the type of MA and Length separately ( Settings -> S/R ).
If you don't need this feature, simply set Type ( Settings -> S/R ) -> NONE
The shape sometimes resembles triangles, indicating a potential direction
Default the average of the highest and lowest values is plotted (Style -> Mid Donchian)
This can act as potential support/resistance or visualization of the trend, the mean average is not plotted but can be (Style -> MA)
🔹 Note
When the option Bands is chosen, an indication is plotted when the closing price breaks above the highest band or breaks below the lower band. This isn't necessarily a buy/sell signal, it is merely a signal that these lines are broken.
Users should decide on their own how they use the bands/lines/areas as entry, exit, trailing stop, stop loss, profit taking,...
🔶 SETTINGS
🔹 Bands
Style: Clouds (default), Upper band, Lower band, Bands
Type MA: choose between SMA, EMA, RMA, HullMA, WMA, VWMA (default), DEMA, TEMA, NONE (off)
Length: Length of moving average and Donchian calculations (default 20)
Colour Bands
🔹 S/R (Support/Resistance, visible with Clouds, Upper band or Lower band)
Type MA: choose between SMA, EMA, RMA, HullMA, WMA, VWMA (default), DEMA, TEMA, NONE (off)
Length: Length of moving average and Donchian calculations (default 20)
Colour S/R
Moving_average

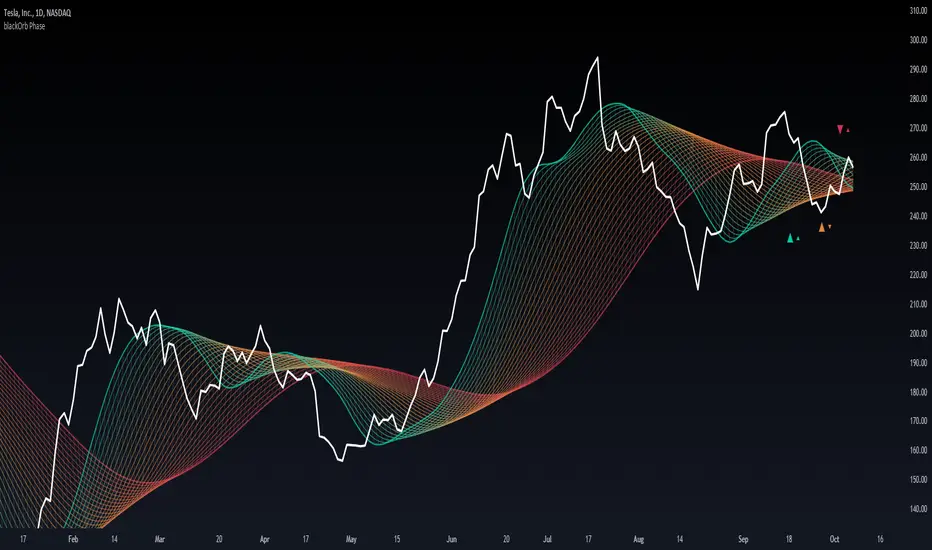
blackOrb PhaseMA matrix for identification of bullish/bearish macro phases and strategy implementation through the definition of effective MA lengths.
Moving Averages, when conventionally employed in either single-line or dual-line configurations, come with inherent limitations that hinder their effectiveness in capturing the complexities of varying market conditions.
In response to this challenge, blackOrb Phase utilizes a combination of quantitative and relational MA analysis techniques, providing users with a more comprehensive understanding of market trends and a granular derivation of price-dynamic phases by using the following features:
I. MA matrix to identify effective MA lengths for strategy implementation
II. Stochastic coloring for trend tracking and macro phase identification
III. Diverse MA options for enhanced analytical flexibility
Technical Methodology
I. MA Matrix to Identify Effective MA Lengths for Strategy Implementation
Central to the methodology is the ability to identify optimal MA lengths for effective strategy implementation. blackOrb Phase utilizes a matrix of multiple MAs, each characterized by unique parameters, to establish a relational grid structure. By systematically examining price data within predefined vertical segments, this matrix offers a linear multi-level modulation of historical price data, providing access to up to 500 prior data instances. This methodology enhances the analysis of both micro price dynamics shifts and bullish or bearish macro trend changes. It has been empirically validated that this approach can assist users to refine their analysis and adapt to varying market conditions*.
Crossings of MA lines with different colors signify potential shifts in price dynamic phases. When green MA lines intersect red MA lines, it suggests a higher likelihood of a macro trend change (bullish or bearish market environment). Conversely, when green MA lines cross over orange MA lines, it indicates a lower probability of a macro trend change but still suggests a potential micro trend shift. This micro trend shift can be viewed as a subordinate price dynamic change within the broader macro trend.
*Source: Prof. Pätäri, Eero. "Performance of moving average trading strategies over varying stock market conditions." Applied Economics, vol. 46, no. 24, 2014, pp. 2851-2872.
II. Stochastic Coloring for Trend Tracking and Macro Phase Identification
To provide a comprehensive view, this indicator includes a stochastic tracking feature, displayed through an intuitive single-color system across the entire matrix grid. The color scheme transitions from red lines, indicating the beginning of bearish trend phases, to green lines, indicating the initiation of bullish trend phases and vice versa. The greater the number of lines with the same color, the stronger the trend.
This tool enhances price trend monitoring, allowing traders not only to track their initiation and continuation but also to confirm trend culmination. By observing color shifts from red/green lines, traders can assess the sustainability and persistence of broader macro trends.
Note: Stochastic coloring aids in probability-based orientation and provides valuable insights for trading strategy implementation. It is most effective when used in conjunction with other analysis and risk management techniques.
III. Diverse MA Options for Enhanced Analytical Flexibility
Users have the flexibility to choose from 14 different MA types (e.g. including ALMA, KAMA, T3, VWMA, TriMA and ZLEMA). This versatility allows for precise configurations tailored to specific market conditions.
For example, among the array of these 14 MA alternatives, VWMA (Volume Weighted MA) stands out as a suitable implementation choice for integrating volume data. It goes beyond the scope of a simple moving average, considering both price and volume in its calculation, as shown in the following formula:
(C1 x V1 + C2 x V2 + ... + Cn x Vn) / (V1 + V2 + ... + Vn)
Alongside this variety of MA types, users can select from a range of OHLC combination options (open, high, low and close price data), further enhancing analytical flexibility.
Note: While these choices offer substantial flexibility, they also require a solid understanding of the various MA types and data combinations, making risk management essential.
Note on Usability
blackOrb Phase can have synergies with blackOrb Price and blackOrb Zone as all three indicators combined can give a bigger picture for supporting comprehensive and multifaceted data-driven trading analysis.
This tool was meticulously created to serve as an additional frame for the seamless integration of other more granular trading indicators. This indicator isn't intended for standalone trading application. Instead, it is serving as a supplementary tool for orientation within broader trading strategies.
Irrespective of market conditions, it can harmonize with a wider range of trading styles and instruments / trading pairs / indices like Stocks, Gold, FX, EURUSD, SPX500, GBPUSD, BTCUSD and Oil.
Inspiration and Publishing
Taking genesis from the inspirations amongst others provided by TradingView Pine Script Wizard Kodify, blackOrb Phase is a multi-encompassing script meticulously forged from scratch. It aspires to furnish a comprehensive approach, borne out of personal experiences and a strong dedication in supporting the trading community. We eagerly await valuable feedback to refine and further enhance this tool.
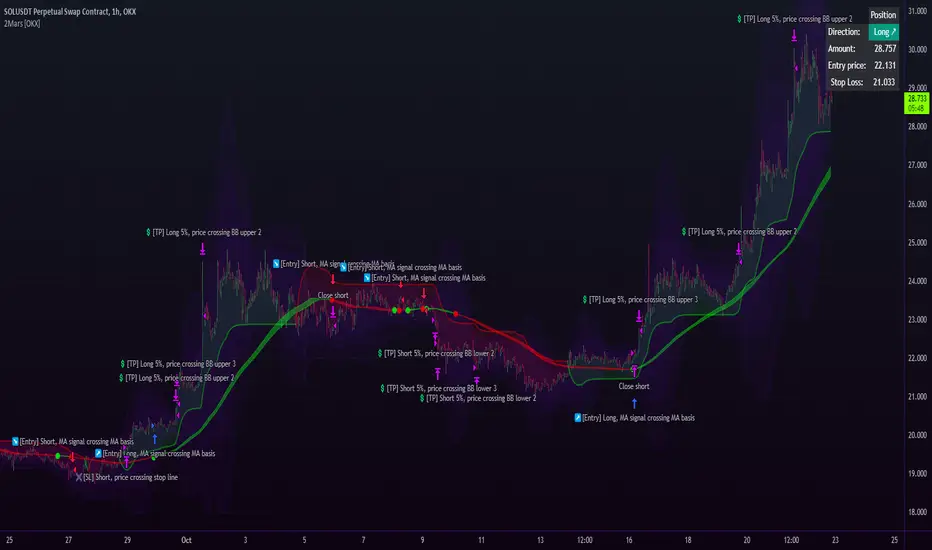
2Mars strategy [OKX]The strategy is based on the intersection of two moving averages, which requires adjusting the parameters (ratio and multiplier) for the moving average.
Basis MA length: multiplier * ratio
Signal MA length: multiplier
The SuperTrend indicator is used for additional confirmation of entry into a position.
Bollinger Bands and position reversal are used for take-profit.
About stop loss:
If activated, the stop loss price will be updated on every entry.
Basic setup:
Additional:
Alerts for OKX:
Ehlers DecyclerJohn F. Ehlers introuced Decycler in his book "Cycle Analytics for Traders", chapter 4.
The decycler is designed to remove the influence of shorter cycle fluctuations, resulting in an output that closely resembles a one-pole low-pass filter.
A standout feature of the decycler is its notably minimal lag. The most extended cycle elements experience a delay of less than five bars. When considering a frequency of 0.05 cycles per bar (equivalent to a 20-bar cycle period), the lag approximates 1.5 bars. Components with a higher frequency face even lesser delays. Consequently, any higher-frequency variations that pass the filter's attenuation align closely with the price fluctuations. This makes the decycler an optimal "immediate trend detector," giving a true depiction of the data's trend.
While the SuperSmoother filter can yield a comparably smoothed output, the decycler typically exhibits less lag when the two are juxtaposed. It's worth noting that the decycler operates as a one-pole filter, implying it doesn't have the best filtering capabilities. It's not advisable to use the decycler as a smoothing filter to eliminate aliasing disturbances. Instead, its application should focus on generating an immediate trend representation, especially when choosing a larger cutoff period. The broad cutoff period equips the decycler with the ability to reduce aliasing disturbances, given that it's significantly distant from the Nyquist frequency.
There are already several decycler indicators on Tradingview, but I like to structure the code and highlight the main components as functions rather than hiding them in the code. I hope this is useful for those who are starting to learn Pine Script.

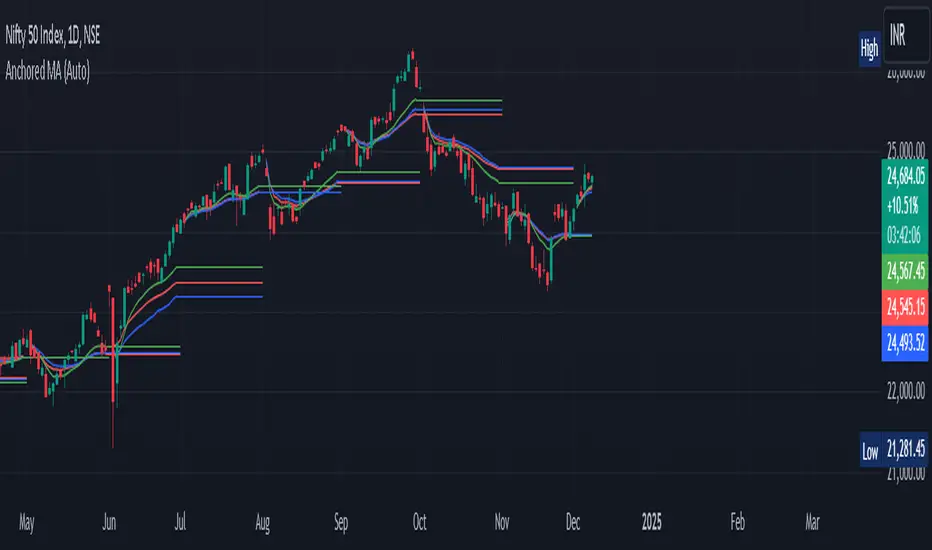
Anchored Moving Average By Market Mindset - Zero To EndlessAnchored Moving Average?
An anchored moving average (AMA) is created when you select a point on the chart and start calculating the moving average from there. Thus the moving average’s denominator is not fixed but cumulative and dynamic.
In this indicator, I've provided three different types of Anchored Moving Averages, viz., WMA, SMA and VWAP.
WMA is relevant if big moves are there.
SMA is relevant if volume data is not to be considered or if it is not available.
VWAP is the standard anchored MA, which is most commontly used. Is consider the volume data along with the price move.
In this indicator, Auto anchor is time based anchor. A trader can opt for Pivot Type Anchor or Volume Type Anchor or some higher resolution based anchor too. The length of the pivot lookback can also be changed by the user.
It can be used for intraday, swing trading and even for technical based investment purpose.
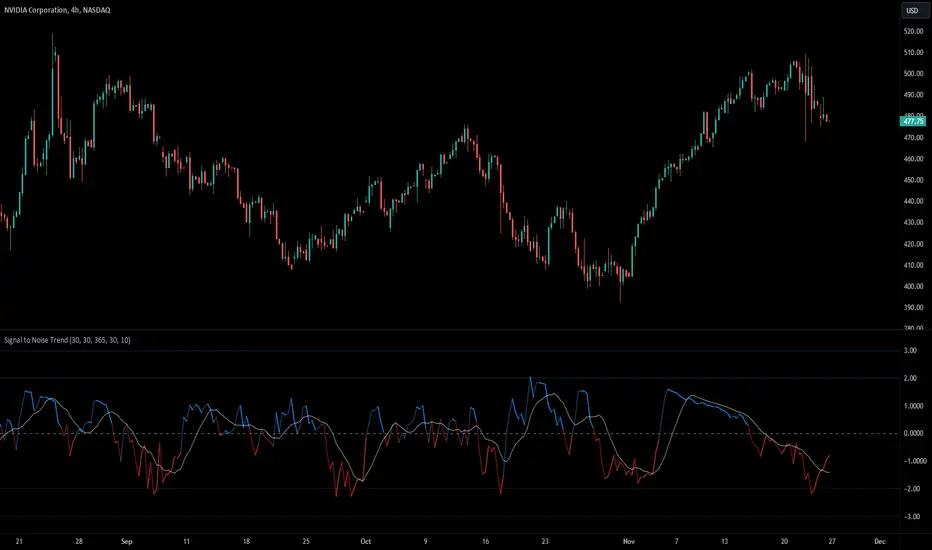
Signal to Noise TrendSignal to Noise Ratio
The Signal to Noise Ratio or SNR is used to assess the quality of information or data by comparing the strength of a useful signal to the presence of background noise or random variations.
In Finance the SNR refers to the ratio of strength of a trading signal to the background noise. A high SNR suggest a clear and reliable signal, meanwhile a low SNR indicates more noise (random fluctuations, volatility, or randomness).
Signal To Noise Trend
This indicator basically calculates the signal to noise of returns and then gets the Z-Score of the signal to noise ratio to find extremes levels of signal and noise. The Lines basically are standard deviations from the mean. 1,2,3 Are standard deviations same with the -1,-2,-3 Lines.
The signal is expressed as the positive Z-Score value, and the Noise is the negative Z-Score Value.
The moving average enhances the indicator ability to display the trend of returns and the trend strength. It provides a smooth representation of the Signal to Nose Ratio values.
There are more trending conditions when there is a higher signal, and there is more "ranging" conditions when there is more noise present in the markets.
The Standard deviations help find extreme levels of signal and noise. If the noise reaches the standard deviation of -3 then that means that there is a extreme negative deviation from the mean, and this would be a rare occurrence, with a lot of noise. This could indicate a potential reversion in market states, and could be followed by a trending move.
Another example is that if the Z-Score value reaches a Standard deviation of 3, this could mean that there is extremely strong and rare signal, and could potentially mean a change to a more noisy environment soon.
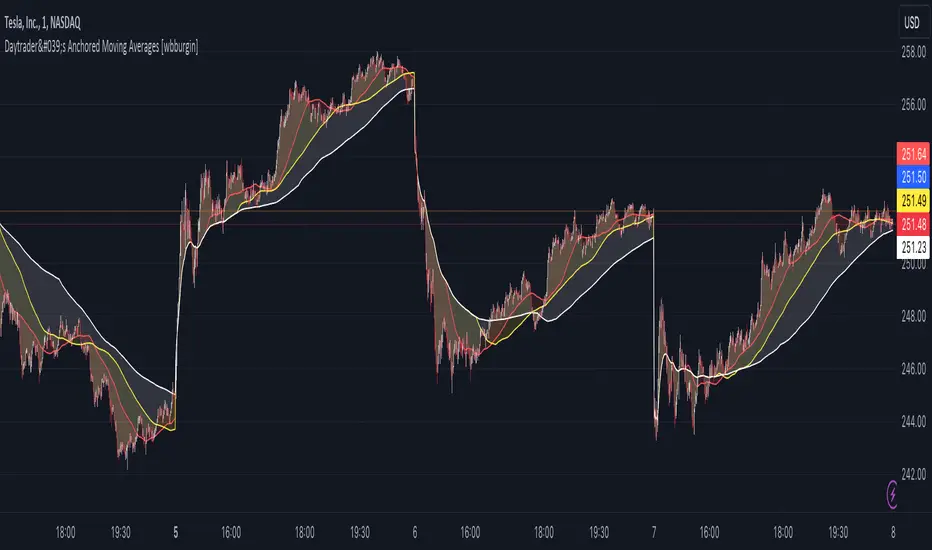
Day Trader's Anchored Moving Averages [wbburgin]For day traders, establishing a trend at the start of the day is critically important for setting targets and entering positions. This can be difficult when traditional moving averages lag from previous days, causing late entry and/or incorrect trend interpretation.
The Day Trader's Anchored MA indicator plots three dynamic moving averages which restart on each new period (session or monthly - more coming soon). This eliminates the lag in traditional moving averages while better identifying the trend, as the moving averages essentially 'build up' their lengths as the day progresses, until they reach your chosen maximum length.
This means that these anchored moving averages are
Quicker to identify the start-of-day trend, as markets tend to establish and then follow one trend throughout the day;
Dynamically increasing throughout the day (to your specifications)
Completely independent from previous days
Quick usage note: make sure that your moving average length is less than the number of bars in the period, or it won't reach the maximum length you specified.
TL;DR: Moving average that resets every day and does not lag. Inspired by the VWAP.
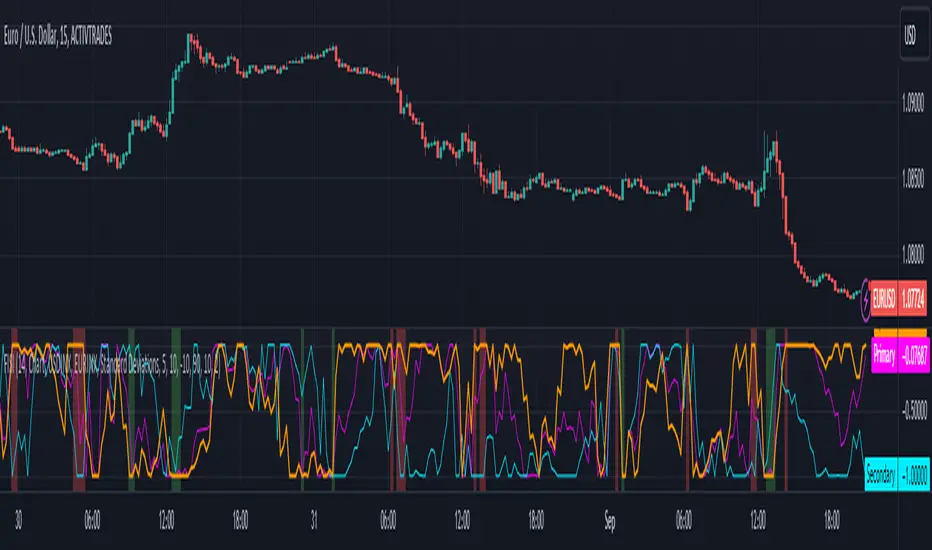
Zaree - FX Index Spread IndicatorDescription:
The "Zaree - FX Index Spread Indicator" (FISI) is a powerful technical analysis tool designed to provide insights into the spread between two selected currency indices. By calculating and visualizing the percentage difference between the values of a primary and a secondary currency index, traders can gain valuable information about potential market dynamics and trends.
Details of the Indicator:
The indicator calculates the spread percentage between a primary and a secondary currency index, allowing traders to understand the relative strength of the two indices.
Traders can choose from a list of currency indices to use as the primary and secondary indices for comparison.
The indicator offers multiple methods for setting thresholds to identify potential trading opportunities, including standard deviations, percentile ranks, historical highs and lows, and fixed thresholds.
Users can customize the length of the calculation period and choose whether to display the primary index, secondary index, and the spread percentage on the chart.
Shaded areas on the chart indicate regions where the spread percentage is above or below predefined thresholds, helping traders identify potential trading signals.
How to Use the Indicator:
Select the primary and secondary currency indices you want to compare from the provided dropdown menus. These indices will be used to calculate the spread percentage.
Choose the method for setting thresholds by selecting one of the options: "Standard Deviations," "Percentile Ranks," "Historical Highs and Lows," or "Fixed Thresholds."
Depending on the selected method, configure the relevant threshold parameters, such as historical threshold percentage, upper and lower fixed thresholds, upper and lower percentile thresholds, or the standard deviation multiplier.
Choose whether to visualize the primary index, secondary index, and spread percentage on the chart by enabling the respective options.
Observe the chart to identify potential trading signals based on the interactions between the spread percentage and the predefined thresholds.
Example of Usage:
Suppose you're interested in trading currency pairs involving the US Dollar (USD) and Euro (EUR), and you want to monitor the spread between the USD Index (USDINX) and the EUR Index (EURINX). Here's how you can use the FISI indicator:
Select "USDINX" as the primary index and "EURINX" as the secondary index.
Choose the method for setting thresholds based on your strategy. For instance, you can select "Standard Deviations" and adjust the standard deviation multiplier.
Enable the visualization of the primary index, secondary index, and spread percentage on the chart.
Observe the shaded areas on the chart. If the spread percentage crosses above the upper threshold, it may indicate a potential market overextension. Conversely, if the spread percentage crosses below the lower threshold, it could suggest an oversold market condition.
Look for instances where the spread percentage approaches or crosses the predefined thresholds. Consider these instances as potential entry or exit points for your trades.
Remember that the FISI indicator is a tool to assist you in your analysis. It's recommended to combine its insights with other technical and fundamental factors before making trading decisions. Adjust the indicator settings and thresholds based on your trading strategy and preferences.
As with any trading tool, practice and observation are key. Over time, you can refine your trading strategy by analyzing historical data and observing how the indicator performs in different market conditions.
Feel free to experiment with different settings and methods to find the configuration that aligns best with your trading style and goals.
@tk · fractal emas█ OVERVIEW
This script is an indicator that plots short, medium and long moving averages for multiple fractals. This script was based on sharks EMAs by rlvs indicator, that plots multiple rays for each fractals into the chart. The main feature of this indicator is the customizability. The calculation itself is simple as moving average.
█ MOTIVATION
The trader can customize all aspects of the plotted data. The text size, extended line length, the moving average type — exponential, simple, etc... — the length of fractal rays, line style, line width and visibility. To keep minimalist, this indicator simplifies the logic of line colors based on the purpose of each moving averages. To prevent overnoise the chart with multiple lines with multiple colors for each fractal timefraes, the trader needs to keep in mind that the all lines with the "short" moving average color for example, will represents the short moving averages lines for all fractals. This logic is applied for medium and long moving averages either.
█ CONCEPT
The trading concept to use this indicator is to make entries on uptrend or downtrend pullbacks when the asset price reaches the short, medium or long moving averages price levels. But this strategy don't works alone. It needs to be aligned together with others indicators like RSI, Chart Patterns, Support and Resistance, and so on... Even more confluences that you have, bigger are your chances to increase the probability for a successful trade. So, don't use this indicator alone. Compose a trading strategy and use it to improve your analysis.
█ CUSTOMIZATION
This indicator allows the trader to customize the following settings:
GENERAL
Text size
Changes the font size of the labels to improve accessibility.
Type: string
Options: `tiny`, `small`, `normal`, `large`.
Default: `small`
SHORT
Type
Select the Short Moving Average calculation type.
Type: string
Options: `EMA`, `SMA`, `HMA`, `VWMA`, `WMA`.
Default: `EMA`
Length
Changes the base length for the Short Moving Average calculation.
Type: int
Default: 12
Source
Changes the base source for the Short Moving Average calculation.
Type: float
Default: close
Color
The base color that will represent the Short Moving Average.
Type: color
Default: color.rgb(255, 235, 59) (yellow)
Fractal Style
The fractal ray line style.
Type: string
Options: `dotted`, `dashed`, `solid`.
Default: `dotted`
Fractal Width
The fractal ray line width.
Type: string
Options: `1px`, `2px`, `3px`, `4px`.
Default: `1px`
Fractal Ray Length
The fractal ray line length.
Type: int
Default: 12
MEDIUM
Type
Select the Medium Moving Average calculation type.
Type: string
Options: `EMA`, `SMA`, `HMA`, `VWMA`, `WMA`.
Default: `EMA`
Length
Changes the base length for the Medium Moving Average calculation.
Type: int
Default: 26
Source
Changes the base source for the Medium Moving Average calculation.
Type: float
Default: close
Color
The base color that will represent the Short Moving Average.
Type: color
Default: color.rgb(0, 230, 118) (lime)
Fractal Style
The fractal ray line style.
Type: string
Options: `dotted`, `dashed`, `solid`.
Default: `dotted`
Fractal Width
The fractal ray line width.
Type: string
Options: `1px`, `2px`, `3px`, `4px`.
Default: `1px`
Fractal Ray Length
The fractal ray line length.
Type: int
Default: 12
LONG
Type
Select the Long Moving Average calculation type.
Type: string
Options: `EMA`, `SMA`, `HMA`, `VWMA`, `WMA`.
Default: `EMA`
Length
Changes the base length for the Long Moving Average calculation.
Type: int
Default: 200
Source
Changes the base source for the Long Moving Average calculation.
Type: float
Default: close
Color
The base color that will represent the Short Moving Average.
Type: color
Default: color.rgb(255, 82, 82) (red)
Fractal Style
The fractal ray line style.
Type: string
Options: `dotted`, `dashed`, `solid`.
Default: `dotted`
Fractal Width
The fractal ray line width.
Type: string
Options: `1px`, `2px`, `3px`, `4px`.
Default: `1px`
Fractal Ray Length
The fractal ray line length.
Type: int
Default: 12
VISIBILITY
Show Fractal Rays · (Short)
Shows short moving average fractal rays.
Type: bool
Default: true
Show Fractal Rays · (Medium)
Shows short moving average fractal rays.
Type: bool
Default: true
Show Fractal Rays · (Long)
Shows short moving average fractal rays.
Type: bool
Default: true
█ FUNCTIONS
The script contains the following functions:
`fn_labelizeTimeFrame`
Labelize timeframe period in minutes and hours.
Parameters:
tf: (string) Timeframe period to be labelized.
Returns: (string) Labelized timeframe string.
`fn_builtInLineStyle`
Converts simple string to built-in line style variable value.
Parameters:
lineStyle: (string) The line style simple string.
Returns: (string) Built-in line style string value.
`fn_builtInLineWidth`
Converts simple pixel string to line width number value.
Parameters:
lineWidth: (string) The line width pixel simple string.
Returns: (string) Built-in line width number value.
`fn_requestFractal`
Requests fractal data based on `period` given an expression.
Parameters:
period: (string) The period timeframe of fractal.
expression: (series float) The expression to retrieve data from fractal.
Returns: (mixed) A result determined by `expression`.
`fn_plotRay`
Plots line after chart bars.
Parameters:
y: (float) Y axis line position.
label: (string) Label to be ploted after line.
color: (color) Line and label color.
length: (int) Line length.
show: (bool) Flag to display the line. (default: `true`)
lineStyle: (string) Line style to be applied. (default: `line.style_dotted`)
lineWidth: (int) Line width. (default: `1`)
Returns: void
`fn_plotEmaRay`
Plots moving average line for a specific period.
Parameters:
period: (simple string) Period of fractal to retrieve
expression: (series float) The expression to retrieve data from fractal.
color: (color) Line and label color.
length: (int) Line length. (default: `12`)
show: (bool) Flag to display the line. (default: `true`)
lineStyle: (string) Line style to be applied. (default: `line.style_dotted`)
lineWidth: (string) Line width. (default: `1px`)
Returns: void
`fn_plotExtendedEmaRay`
Draws extended line for current timeframe moving average.
Parameters:
coordY: (float) Extended line Y axis position.
textValue: (simple string) Extended line label text.
textColor: (color) Extended line text color.
length: (int) Extended length. (default: `5`)
Returns: void

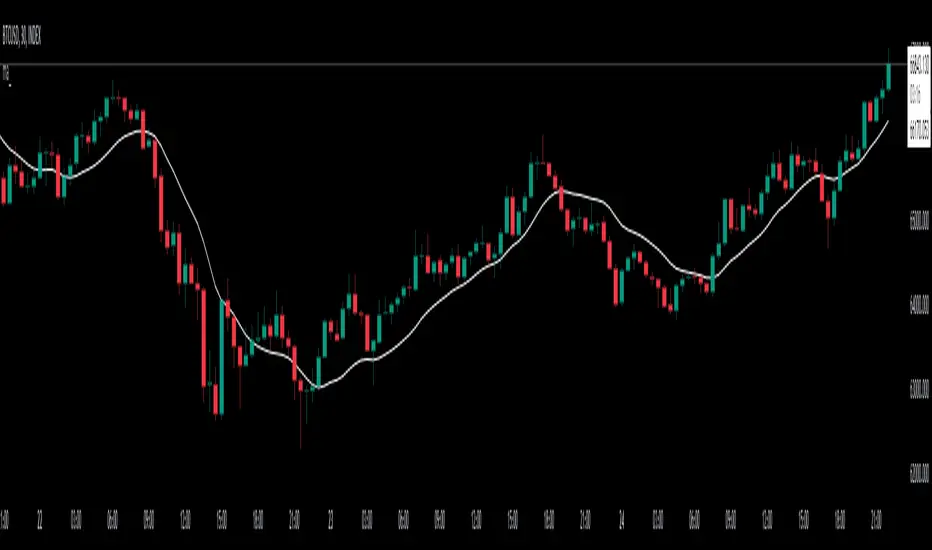
Adaptive Trend Indicator [Quantigenics]Our Adaptive Trend Indicator is an advanced trading indicator using price and time series analysis to adapt to market trends. It calculates a weighted average of the median price and twice-smoothed average price, then applies a linear regression over twice the user-defined period, generating a trend line. This trend line represents the prevailing market direction and adjusts dynamically based on price fluctuations. When the Adaptive Trend value increases compared to the previous value, the line turns aqua, signaling an upward trend. Conversely, if it decreases, the line turns red, indicating a downward trend. This color coding provides visual guidance for traders. By combining advanced statistical techniques with real-time adaptation, the Adaptive Trend indicator provides timely trend information, supporting traders in navigating various market conditions.
Additionally, this indicator may be applied multiple times to the same chart. Traders may adjust the length of each instance to show a group of trendlines that can indicate when price action is overbought or oversold as well as support or resistance at different indicator lengths. Example below.
CRYPTO:BTCUSD
CRYPTO:BTCUSD
NASDAQ:TSLA
We hope you enjoy this indicator. Happy Trading!

L&S Volatility Index Refurbished█ Introduction
This is my second version of the L&S Volatility Index, hence the name "Refurbished".
The first version can be found at this link:
The reason I released a separate version is because I rewrote the source code from scratch with the aim of both improving the indicator and staying as close as possible to the original concept.
I feel that the first version was somewhat exotic and polluted in relation to the indicator originally described by the authors.
In short, the main idea remains the same, however, the way of presenting the result has been changed, reiterating what was said.
█ CONCEPTS
The L&S Volatility Index measures the volatility of price in relation to a moving average.
The indicator was originally described by Brazilian traders Alexandre Wolwacz (Stormer) and Fábio Figueiredo (Vlad) from L&S Educação Financeira.
Basically, this indicator can be used in two ways:
1. In a mean reversion strategy, when there is an unusual distance from it;
2. In a trend following strategy, when the price is in an acceptable region.
As an indicator of volatility, the greatest utility is shown in first case.
This is because it allows identifying abnormal prices, extremely stretched in relation to an average, including market crashes.
How the calculation is done:
First, the distance of the price from a given average in percentage terms is measured.
Then, the historical average volatility is obtained.
Finally the indicator is calculated through the ratio between the distance and the historical volatility.
According to the description proposed by the creators, when the L&S Volatility Index is above 30 it means that the price is "stretched".
The closer to 100 the more stretched.
When it reaches 0, it means the price is on average.
█ What to look for
Basically, you should look at non-standard prices.
How to identify it?
When the oscillator is outside the Dynamic Zone and/or the Fixed Zone (above 30), it is because the price is stretched.
Nothing on the market is guaranteed.
As with the RSI, it is not because the RSI is overbought or oversold that the price will necessarily go down or up.
It is critical to know when NOT to buy, NOT to sell or NOT to do anything.
It is always important to consider the context.
█ Improvements
The following improvements have been implemented.
It should be noted that these improvements can be disabled, thus using the indicator in the "purest" version, the same as the one conceived by the creators.
Resources:
1. Customization of limits and zones:
2. Customization of the timeframe, which can be different from the current one.
3. Repaint option (prints the indicator in real time even if the bar has not yet closed. This produces more signals).
4. Customization of price inputs. This affects the calculation.
5. Customization of the reference moving average (the moving average used to calculate the price distance).
6. Customization of the historical volatility calculation strategy.
- Accumulated ATR: calculates the historical volatility based on the accumulated ATR.
- Returns: calculates the historical volatility based on the returns of the source.
Both forms of volatility calculation have their specific utilities and applications.
Therefore, it is worthwhile to have both approaches available, and one should not necessarily replace the other.
Each method has its advantages and may be more appropriate in different contexts.
The first approach, using the accumulated ATR, can be useful when you want to take into account the implied volatility of prices over time,
reflecting broader price movements and higher impact events. It can be especially relevant in scenarios where unexpected events can drastically affect prices.
The second approach, using the standard deviation of returns, is more common and traditionally used to measure historical volatility.
It considers the variability of prices relative to their average, providing a more general measure of market volatility.
Therefore, both forms of calculation have their merits and can be useful depending on the context and specific analysis needs.
Having both options available gives users flexibility in choosing the most appropriate volatility measure for the situation at hand.
* When choosing "Accumulated ATR", if the indicator becomes difficult to see, there are 3 possibilities:
a) manually adjust the Fixed Zone value;
b) disable the Fixed Zone and use only the Dynamic Zone;
c) normalize the indicator.
7. Signal line (a moving average of the oscillator).
8. Option to normalize the indicator or not.
9. Colors to facilitate direction interpretation.
Since the L&S is a volatility indicator, it does not show whether the price is rising or falling.
This can sometimes confuse the user.
That said, the idea here is to show certain colors where the price is relative to the average, making it easier to analyze.
10. Alert messages for automations.

Moving Average Continuity [QuantVue]"Moving Average Continuity," is designed to compare the position of two Moving Averages (MAs) across multiple timeframes.
The user can select three timeframes and determine the length and type of both a fast and slow moving average.
The indicator will display a small table in a user selected location.
This table helps traders quickly determine if, for their selected timeframes, the faster moving average is trending above or below the slower moving average.
The “Moving Average Continuity” indicator can also send you three types of alerts;
1. All moving averages are aligned bullish
2. All moving averages are aligned bearish
3. Moving averages are mixed
Key Features:
1. Timeframes: The user can select up to three distinct timeframes to compare the moving averages.
2. Moving Average Inputs: For each MA, users can determine:
• Length of the MA
• Type of the MA - Options include EMA (Exponential Moving Average), SMA (Simple Moving Average), HMA (Hull Moving Average), WMA (Weighted Moving Average), and VWMA (Volume Weighted Moving Average).
3. Positioning: Users have the ability to adjust the table's positioning (top, middle, or bottom) and horizontal alignment (right, center, or left) on the chart overlay.
4. Runtime Error Prevention: The indicator will throw an error if the chart's timeframe exceeds the maximum selected timeframe, ensuring that comparisons are done correctly.
Give this indicator a BOOST and COMMENT your thoughts!
We hope you enjoy.
Cheers.

Extended Moving Average (MA) LibraryThis Extended Moving Average Library is a sophisticated and comprehensive tool for traders seeking to expand their arsenal of moving averages for more nuanced and detailed technical analysis.
The library contains various types of moving averages, each with two versions - one that accepts a simple constant length parameter and another that accepts a series or changing length parameter.
This makes the library highly versatile and suitable for a wide range of strategies and trading styles.
Moving Averages Included:
Simple Moving Average (SMA): This is the most basic type of moving average. It calculates the average of a selected range of prices, typically closing prices, by the number of periods in that range.
Exponential Moving Average (EMA): This type of moving average gives more weight to the latest data and is thus more responsive to new price information. This can help traders to react faster to recent price changes.
Double Exponential Moving Average (DEMA): This is a composite of a single exponential moving average, a double exponential moving average, and an exponential moving average of a triple exponential moving average. It aims to eliminate lag, which is a key drawback of using moving averages.
Jurik Moving Average (JMA): This is a versatile and responsive moving average that can be adjusted for market speed. It is designed to stay balanced and responsive, regardless of how long or short it is.
Kaufman's Adaptive Moving Average (KAMA): This moving average is designed to account for market noise or volatility. KAMA will closely follow prices when the price swings are relatively small and the noise is low.
Smoothed Moving Average (SMMA): This type of moving average applies equal weighting to all observations and smooths out the data.
Triangular Moving Average (TMA): This is a double smoothed simple moving average, calculated by averaging the simple moving averages of a dataset.
True Strength Force (TSF): This is a moving average of the linear regression line, a statistical tool used to predict future values from past values.
Volume Moving Average (VMA): This is a simple moving average of a volume, which can help to identify trends in volume.
Volume Adjusted Moving Average (VAMA): This moving average adjusts for volume and can be more responsive to volume changes.
Zero Lag Exponential Moving Average (ZLEMA): This type of moving average aims to eliminate the lag in traditional EMAs, making it more responsive to recent price changes.
Selector: The selector function allows users to easily select and apply any of the moving averages included in the library inside their strategy.
This library provides a broad selection of moving averages to choose from, allowing you to experiment with different types and find the one that best suits your trading strategy.
By providing both simple and series versions for each moving average, this library offers great flexibility, enabling users to pass both constant and changing length parameters as needed.
Moving Average Exponential Angle DetectionMoving Average exponential angle detection use to find the angle of moving average so we can take trade according to our strategy.
Hope you like this.
Thanks and Regards,
TradingTail

GDCA ScreenerThis is upgrated system for Screener to DCA from "Grospector DCA V.3".
This has 5 zone Extreme high , high , normal , low , Extreme low. You can dynamic set min - max percent every zone.
Extreme zone is derivative short and long which It change Extreme zone to Normal zone all position will be closed.
Every Zone is splitted 10 channel. and this strategy calculate contribution.
and now can predict price in future.
Price Type: Allows the user to select the price type (open, high, low, close) for calculations.
ALL SET
Length MA for normal zone: The length of the moving average used in the normal zone.
Length for strong zone: The length of the moving average used in the strong zone, which is averaged from the normal zone moving average.
Multiple for Short: The multiplication factor applied to determine the threshold for the short zone.
Multiple for Strong Sell: The multiplication factor applied to determine the threshold for the strong sell zone.
Multiple for Sell Zone: The multiplication factor applied to determine the threshold for the sell zone.
Multiple for Buy Zone: The multiplication factor applied to determine the threshold for the buy zone.
Multiple for Strong Buy: The multiplication factor applied to determine the threshold for the strong buy zone.
Multiple for Long: The multiplication factor applied to determine the threshold for the long zone.
ZONE
Start Short Zone %: The start percentage of the short zone.
End Short Zone %: The end percentage of the short zone.
Start Sell Zone %: The start percentage of the sell zone.
End Sell Zone %: The end percentage of the sell zone.
Start Normal Zone %: The start percentage of the normal zone.
End Normal Zone %: The end percentage of the normal zone.
Start Buy Zone %: The start percentage of the buy zone.
End Buy Zone %: The end percentage of the buy zone.
Start Long Zone %: The start percentage of the long zone.
End Long Zone %: The end percentage of the long zone.
DISPLAY
Show Price: Controls the visibility of the price column in the display table.
Show Mode: Controls the visibility of the mode column in the display table.
Show GDCA: Controls the visibility of the GDCA column in the display table.
Show %: Controls the visibility of the percentage column in the display table.
Show Short: Controls the visibility of the short column in the display table.
Show Strong Sell: Controls the visibility of the strong sell column in the display table.
Show Sell: Controls the visibility of the sell column in the display table.
Show Buy: Controls the visibility of the buy column in the display table.
Show Strong Buy: Controls the visibility of the strong buy column in the display table.
Show Long: Controls the visibility of the long column in the display table.
Show Suggestion Trend: Controls the visibility of the suggestion trend column in the display table.
Show Manual Custom Code: Controls the visibility of the manual custom code column in the display table.
Show Dynamic Trend: Controls the visibility of the dynamic trend column in the display table.
Symbols: Boolean parameters that control the visibility of individual symbols in the display table.
Mode: Integer parameters that determine the mode for each symbol, specifying different settings or trends.
My mindset has been customed = AAPL , MSFT
To effectively make the DCA plan, I recommend adopting a comprehensive strategy that takes into consideration your mindset as the best indicator of the optimal approach. By leveraging your mindset, the task can be made more manageable and adaptable to any market
Dollar-cost averaging (DCA) is a suitable investment strategy for sound money and growth assets which It is Bitcoin, as it allows for consistent and disciplined investment over time, minimizing the impact of market volatility and potential risks associated with market timing

Sessioned EMA - Frozen EMA in post market hoursWhy I develop this indicator?
In future indices, post market data with little volume distort the moving average seriously. This indicator is to eliminate the distortion of data during low volume post market hours.
How to use?
There is a time session setting in the indicator, you can set the cash hour time, moving average outside the session will be frozen.
What this indicator gives you
This indicator give you a more make sense ema pattern, the ema lines are more respected by the prices when you set the session properly.
Setup
1. Session setting
In US indices, such as NQ, ES etc, when there was data release at 0830 hr, huge volume transaction order appears, that makes the 0830 price data important that should be included in your ema trend line calculating. If that is the case, I will set the session begin from 0830, otherwise, I start the session at 0930. Golden rule : Price with huge volume counts.
2. Time zone
The coding is decided for GMT+8 time zone, you may amend the code to fit your timezone.

RSI Multi Timeframe Based on Moving Average By Alireza PhoenixHi. I have prepared for you the multi-time frame RSI indicator based on moving average
You can use it in three different time frames
Open the settings and put the value you want in the Time 1 and Time 2 fields
In the fast and slow section, specify the length of the moving period of fast and slow origins as desired
In the offset section, you can add or reduce the time interval as you wish
This indicator shows you the RSI index in three different time frames along with two different lengths of the moving average based on the RSI index.
You can use this indicator in all financial, forex or crypto markets
The crossing of RSI and moving average lines in different time frames and lengths will give you a buy or sell signal.
Whenever the faster line or smaller RSI total frame succeeds in breaking the slower line or the RSI time is higher than the low, a free signal is issued and vice versa.
I do not guarantee that 100% of the issued signals are accurate and correct, and I have coded this indicator only for your convenience.
I hope you can get help from this indicator and make profit
Love From IRAN

RAINBOW AVERAGES - INDICATOR - (AS) - 1/3
-INTRODUCTION:
This is the first of three scripts I intend to publish using rainbow indicators. This script serves as a groundwork for the other two. It is a RAINBOW MOVING AVERAGES indicator primarily designed for trend detection. The upcoming script will also be an indicator but with overlay=false (below the chart, not on it) and will utilize RAINBOW BANDS and RAINBOW OSCILLATOR. The third script will be a strategy combining all of them.
RAINBOW moving averages can be used in various ways, but this script is mainly intended for trend analysis. It is meant to be used with overlay=true, but if the user wishes, it can be viewed below the chart. To achieve this, you need to change the code from overlay=true to false and turn off the first switch that plots the rainbow on the chart (or simply move the indicator to a new pane below). By doing this, you will be able to see how all four conditions used to detect trends work on the chart. But let's not get ahead of ourselves.
-WHAT IS IT:
In its simplest form, this indicator uses 10 moving averages colored like a rainbow. The calculation is as follows:
MA0: This is the main moving average and can be defined with the type (SMA, EMA, RMA, WMA, SINE), length, and price source. However, the second moving average (MA1) is calculated using MA0 as its source, MA2 uses MA1 as the data source, and so on, until the last one, MA9. Hence, there are 10 moving averages. The first moving average is special as all the others derive from it. This indicator has many potential uses, such as entry/exit signals, volatility indication, and stop-loss placement, but for now, we will focus on trend detection.
-TREND DETECTION:
The indicator offers four different background color options based on the user's preference:
0-NONE: No background color is applied as no trend detection tools is being used (boring)
1-CHANGE: The background color is determined by summing the changes of all 10 moving averages (from two bars). If the sum is positive and not falling, the background color is GREEN. If the sum is negative and not rising, the background color is RED. From early testing, it works well for the beginning of a movement but not so much for a lasting trend.
2-RAINBW: The background color is green when all the moving averages are in ascending order, indicating a bullish trend. It is red when all the moving averages are in descending order, indicating a bearish trend. For example, if MA1>MA2>MA3>MA4..., the background color is green. If MA1 threshold, and red indicates width < -threshold.
4-DIRECT: The background color is determined by counting the number of moving averages that are either above or below the input source. If the specified number of moving averages is above the source, the background color is green. If the specified number of moving averages is below the source, the background color is red. If all ten MAs are below the price source, the indicator will show 10, and if all ten MAs are above, it will show -10. The specific value will be set later in the settings (same for 3-TSHOLD variant). This method works well for lasting trends.
Note: If the indicator is turned into a below-chart version, all four color options can be seen as separate indicators.
-PARAMETERS - SETTINGS:
The first line is an on/off switch to plot the skittles indicator (and some info in the tooltip). The second line has already been discussed, which is the background color and the selection of the source (only used for MA0!).
The line "MA1: TYP/LEN" is where we define the parameters of MA0 (important). We choose from the types of moving averages (SMA, EMA, RMA, WMA, SINE) and set the length.
Important Note: It says MA1, but it should be MA0!.
The next line defines whether we want to smooth MA1 (which is actually MA0) and the period for smoothing. When smoothing is turned on, MA0 will be smoothed using a 3-pole super smoother. It's worth noting that although this only applies to MA0, as the other MAs are derived from it, they will also be smoothed.
In the line below, we define the type and length of MAs for MA2 (and other MAs except MA0). The same type and length are used for MA1 to MA9. It's important to remember that these values should be smaller. For example, if we set 55, it means that MA1 is the average of 55 periods of MA0, MA2 will be 55 periods of MA1, and so on. I encourage trying different combinations of MA types as it can be easily adjusted for ur type of trading. RMA looks quirky.
Moving on to the last line, we define some inputs for the background color:
TSH: The threshold value when using 3-TSHOLD-BGC. It's a good idea to change the chart to a pane below for easier adjustment. The default values are based on EURUSD-5M.
BG_DIR: The value that must be crossed or equal to the MA score if using 4-DIRECT-BGC. There are 10 MAs, so the maximum value is also 10. For example, if you set it to 9, it means that at least 9 MAs must be below/above the price for the script to detect a trend. Higher values are recommended as most of the time, this indicator oscillates either around the maximum or minimum value.
-SUMMARY OF SETTINGS:
L1 - PLOT MAs and general info tooltip
L2 - Select the source for MA0 and type of trend detection.
L3 - Set the type and length of MA0 (important).
L4 - Turn smoothing on/off for MA0 and set the period for super smoothing.
L5 - Set the type and length for the rest of the MAs.
L6 - Set values if using 4-DIRECT or 3-TSHOLD for the trend detection.
-OTHERS:
To see trend indicators, you need to turn off the plotting of MAs (first line), and then choose the variant you want for the background color. This will plot it on the chart below.
Keep in mind that M1 int settings stands for MA0 and MA2 for all of the 9 MAs left.
Yes, it may seem more complicated than it actually is. In a nutshell, these are 10 MAs, and each one after MA0 uses the previous one as its source. Plus few conditions for range detection. rest is mainly plots and colors.
There are tooltips to help you with the parameters.
I hope this will be useful to someone. If you have any ideas, feedback, or spot errors in the code, LET ME KNOW.
Stay tuned for the remaining two scripts using skittles indicators and check out my other scripts.
-ALSO:
I'm always looking for ideas for interesting indicators and strategies that I could code, so if you don't know Pinescript, just message me, and I would be glad to write your own indicator/strategy for free, obviously.
-----May the force of the market be with you, and until we meet again,

Higher Fibonacci EMAOverall image:
If the closing price is higher than the three Fibonacci EMAs (uptrend):
Thanks to @ZenAndTheArtOfTrading and his indicator "Higher Timeframe EMA", URL =
This is a trend-discriminating indicator that uses 3 EMAs.
The Williams Alligator is the underlying philosophy, and we have applied it to capture the larger trend.
It is set up for the current time frame + 2 higher time frames.
One of the upper time legs has a daily EMA length of 13 Fibonacci numbers.
The top-level time leg has a weekly EMA with a length of 5 Fibonacci.
If the current closing price of the ticker leg is higher than these three EMAs, the bar color will be green. If it is lower, it will be red. If it is neither, it will be gray.
If the bar color is green, it suggests that the trend is upward. If it is red, you can consider entering short. If it is gray, it is best not to enter anything.

twisted SMA strategy [4h] Hello
I would like to introduce a very simple strategy that uses a combination of 3 simple moving averages ( SMA 4 , SMA 9 , SMA 18 )
this is a classic combination showing the most probable trend directions
Crosses were marked on the basis of the color of the candles (bulish cross - blue / bearish cross - maroon)
ma 100 was used to determine the main trend, which is one of the most popular 4-hour candles
We define main trend while price crosses SMA100 ( for bullish trend I use green candle color )
The long position strategy was created in combination of 3 moving averages with Kaufman's adaptive moving average by alexgrover
The strategy is very accurate and is easy to use indicators
the strategy uses only Buy (Long) signals in a combination of crossovers of the SMA 4, SMA 9, SMA 18 and the Kaufman Adaptive Moving Average.
As a signal to close a long position, only the opposite signal of the intersection of 3 different moving averages is used
the current strategy is recommended for higher time zones (4h +) due to the strength of the closing candles, which translates into signal strength
works fascinatingly well for long-term bullish market assets (for example 4h Apple, Tesla charts)
Enjoy and trade safe ;)

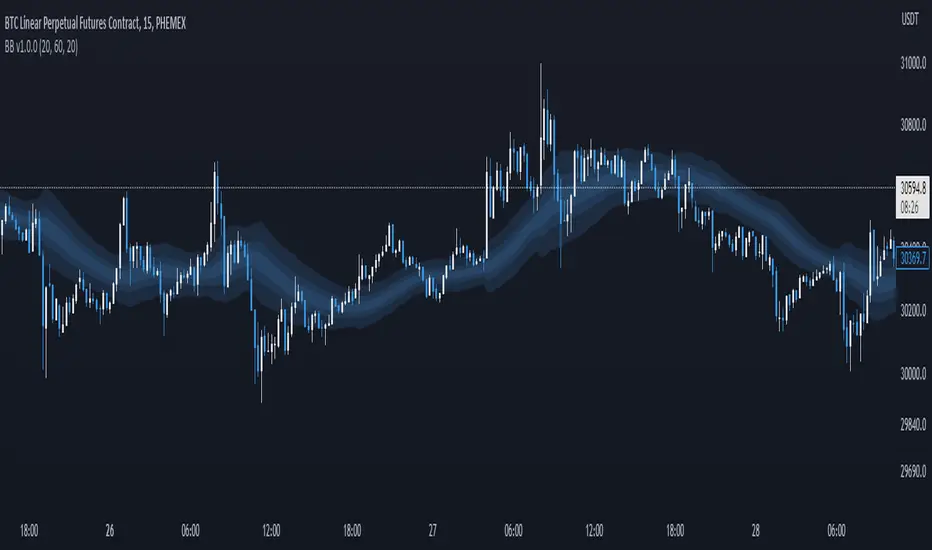
Breakout Band v1.0This indicator uses a custom source to define a point of relativity to which regions are based off to aid in technical analysis.
Breakout Band's use is:
- Monitoring trends
- Defining trends
- Defining areas of consolidation
- Trend support / resistance levels
- Aid in technical analysis
However, the band provides information different to that of an EMA, as they are not created from the same source, ref Fig 1.
---
Fig 1
Breakout Band compared to an EMA, both with a length setting of 20.
---
The primary band uses your charts timeframe to plot the band. This can be useful for more immediate information, ref Fig 2.
Fig 2
BTC on a 15m chart with Breakout Band's Chart Timeframe option.
---
There is also a functionality for a higher timeframe band to be plotted ( currently limited to 4 higher timeframes ) which can help to view higher timeframe moves with lower timeframe information, ref Fig 3. The higher timeframe band has an added smoothing effect.
Fig 3.
The same chart as referenced in Fig 2., while using Breakout Bands HTF option ( 60m band ).
---
USING BREAKOUT BAND
The band provides potential areas of consolidation, as seen in Fig 4., and when price action falls outside of the band, it can be considered trending.
Fig 4.
Defining areas of consolidation, trends, and monitor trends with Breakout Band.
---
Different zones are given different colors. The closer to the middle of the band, the higher chance of reactivity. Meaning, there is a greater chance that price will have a reaction within this zone. Whether that be trend continuation or a break of structure, showing signs of weakness of a trend, ref Fig 5.
Fig 5.
Breakout Bands reactivity region showing an area of potential resistance, which price action enters, then the trend continues.
---
NOTE : The same principles apply if you're using the HTF band for monitoring HTF trends.
I hope you enjoy the Breakout Band. Should you encounter any issues or have any suggestions for improving this indicator, let me know.
Any and all feedback is appreciated.
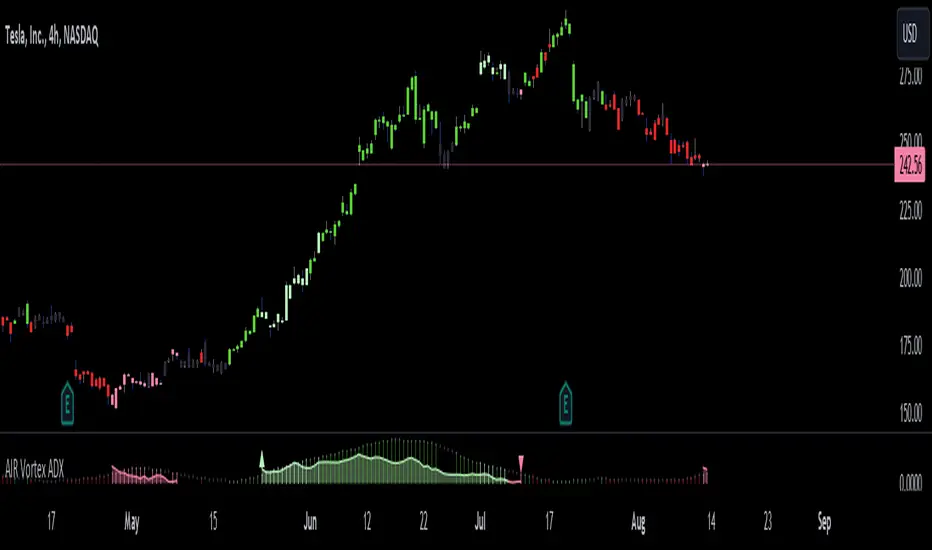
AIR Vortex ADXThis project started as an effort to improve the user interface of the hybrid indicator ADX of Vortex, which is, as per the name, a blend of ADX and Vortex Indicator. Plotting both indicators on the same polarity and normalising the vortex, a better interpretation of the interaction between the two is possible, and trend becomes apparent.
Basically, the Vortex provides the bright punch and ADX the continuation of the trend and momentum.
A range mixer has been added to the vortex, comprising both true and interpercentile ranges (see my previous script for a desrciption of interpercentile range). Users can activate and add amounts of each as they see fit.
Finally, there is an RSI filter, the idea of which is to filter out ranging (flat) markets, where no distinct direction is yet emerging.
Moving Average-TREND POWER v2.0-(AS)HELLO:
-This indicator is a waaaay simpler version of my other script - Moving Average-TREND POWER v1.1-(AS).
HOW DOES IT WORK:
-Script counts number of bars below or above selected Moving Average (u can se them by turning PLOT BARS on). Then multiplies number of bars by 0.01 and adds previous value. So in the uptrend indicator will be growing faster with every bar when price is above MA. When MA crosess price Value goes to zero so it shows when the market is ranging.
If Cross happens when number of bars is higher than Upper threshold or below Lower threshold indicator will go back to zero only if MA crosses with high in UPtrend and low in DNtrend. If cross happens inside THSs Value will be zero when MA crosses with any type of price source like for example (close,high,low,ohlc4,hl etc.....).This helps to get more crosess in side trend and less resets during a visible trend
HOW TO SET:
Just select what type of MA you want to use and Length. Then based on your preference set values of THSs'
OTHER INFORMATIONS:
-Script was created and tested on EURUSD 5M.
-For bigger trends choose slowerMAs and bigger periods and the other way around for short trends (FasterMAs/shorter periods)
-Below script code you can find not used formulas for calculating indicator value(thanks chat GPT), If you know some pinescript I encourage you to try try them or maybe bulid better ones. Script uses most basic one.
-Pls give me some feedback/ideas to improve and check out first version. Its way more complicated for no real reason but still worth to take a look'
-Also let me know if you find some logical errors in the code.
Enjoy and till we meet again.
