MTF BB Meow Mix [acatwithcharts]This script adds multi-timeframe support to full BB Meow Mix, with the full set of various moving average and stdev calculation types.
There is a tradeoff in that there is, to the best of my knowledge, no way to support both MTF and the default band settings menu in the same script, because the security() function in Pinescipt doesn't support variable lookback lengths and trying to plot everything independently instead maxes out the number of plots allowed per script. So, this version of the script doesn't include a menu of defaults.
My volatility indicators are available by subscription in several packages through SharkCharts.live.
Current pricing and subscription details will be kept up-to-date on SharkCharts.live
Multi-timeframe

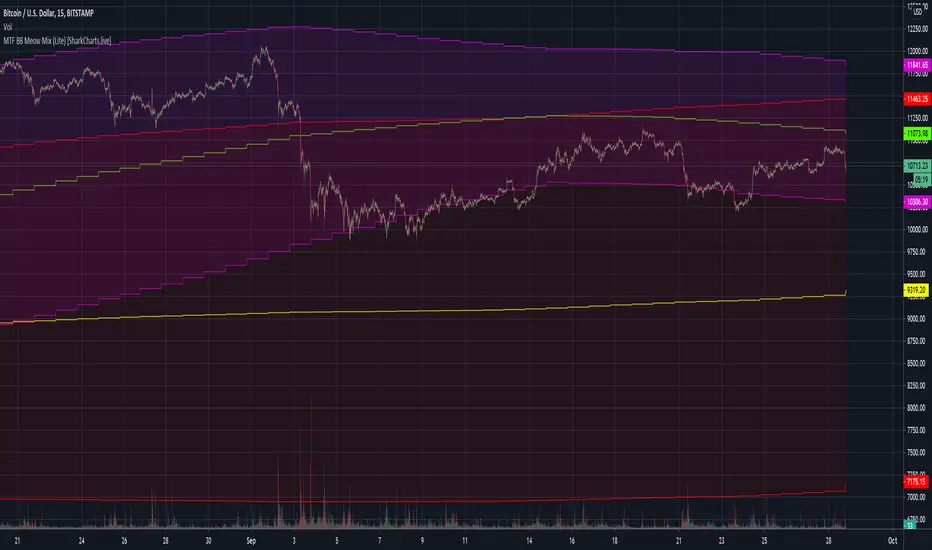
MTF BB Meow Mix (Lite) [acatwithcharts]This script adds multi-timeframe support to BB Meow Mix (Lite).
There is a tradeoff in that there is, to the best of my knowledge, no way to support both MTF and the default band settings menu in the same script, because the security() function in Pinescipt doesn't support variable lookback lengths and trying to plot everything independently instead maxes out the number of plots allowed per script. So, this version of the script doesn't include a menu of defaults.
My volatility indicators are available by subscription in several packages through SharkCharts.live.
Current pricing and subscription details will be kept up-to-date on SharkCharts.live
Moving Average 8 lines (multi timeframe 4 lines)moving average 8 lines
(multi timeframe moving average 4 lines)
and entry sign
default : for 5 minute chart

Multi Time Frame SARThis Indicator plots 5 differents time frame SAR in the same graphic.
It must be used in 5 minutes Time Frame.
Plots 5 minutes SAR, 15 minutes, 30 minutes, 1 Hour and 4 Hours.
If you need it to use in other time frame, you can send me a message to evaluate the development of a new version.

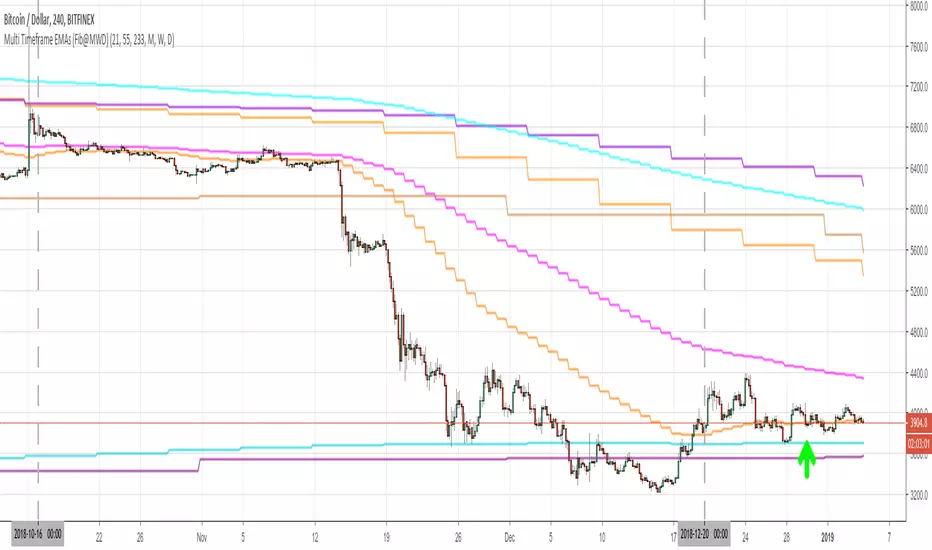
Multi Timeframe EMAs (Fib@MWD)plot fibonacci EMAs 21,55,233 on the timeframes monthly, weekly and daily.
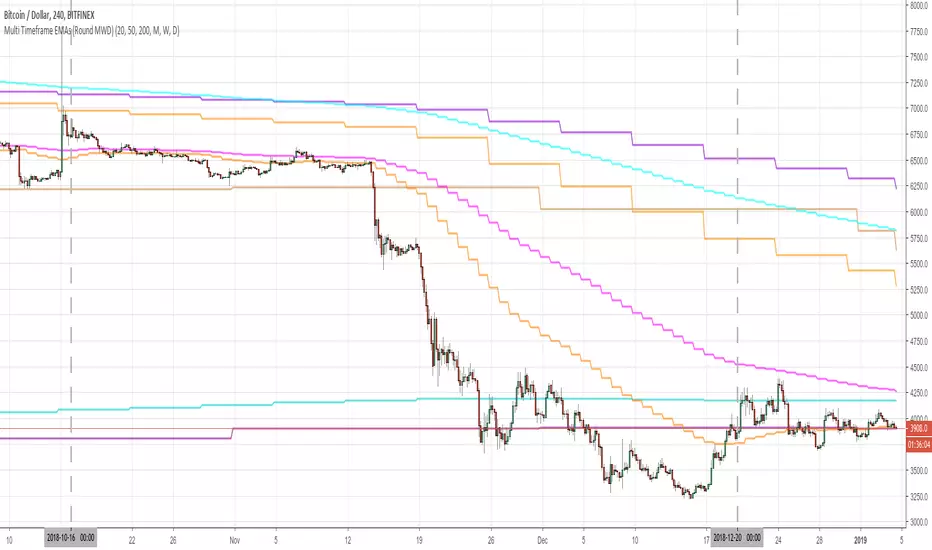
Multi Timeframe EMAs (Round@MWD)plot round number EMAs 20,50,200 on the timeframes monthly, weekly and daily.
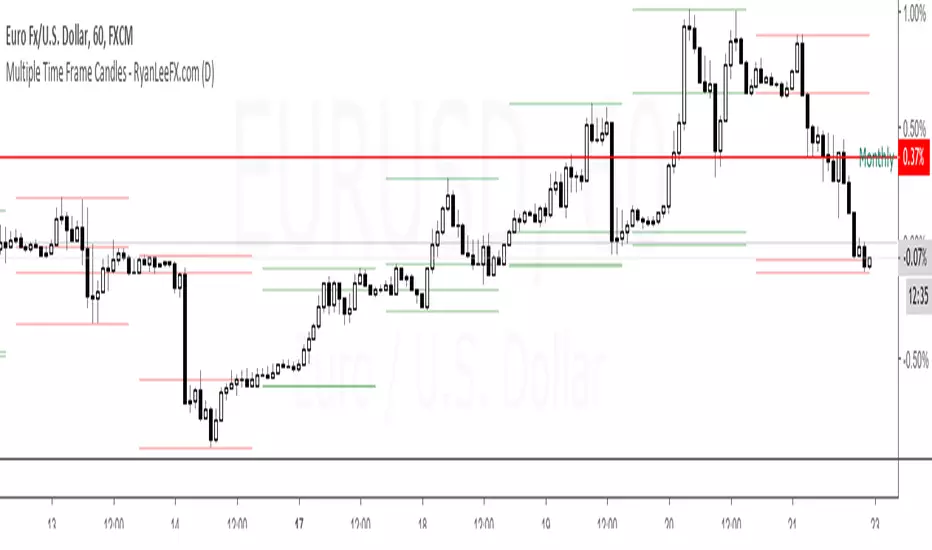
Multiple Time Frame Candles - RyanLeeFX.comMultiple Time Frame Candles is a unique script that allows traders to quickly and easily analyze price action candles across multiple time frames all from one chart. Multiple Time Frame Candles eliminates the need for price action traders to change chart time frames when trying to analyze multiple time frames. With this script, traders can easily see the candles from a lower time frame inside candles from a higher time frame.
For example, traders can see 1 Hour candles inside Daily candles. Or 5 Min candles inside Hourly candles. Or Daily candles inside Weekly candles. Or Hourly candles inside Daily candles inside Weekly candles. The options for comparing multiple time frame candles on one screen are almost limitless.
This script differs from other Multiple Time Frame Candle scripts by displaying the open, high, low and close of the larger time frame candle as well as highlighting the close price due to its proven importance.
The ability to quickly analyze multiple time frames from a single chart will make you more confident in your trades as well as save you valuable time during your analysis.
Multiple Time Frame Candles is also an amazing script to help beginning to experienced traders better visualize price movement across multiple time frames all from a single chart. Happy Trading!!

Quantum Currency Strength Indicator (CSI)If there is only one TradingView indicator you ever buy for trading forex – this has to be it.
Your success as a forex trader depends on being able to identify when a currency or currency pair is oversold or overbought. If it is strong or weak. It is this concept which lies at the heart of forex trading. Without the Quantum Currency Strength indicator, it’s almost impossible. There are simply too many currencies and too many pairs to do this quickly and easily yourself. You need help. The Quantum Currency Strenght indicator breaks this complex market down into the building blocks, the currencies themselves, from which you can then identify quickly, clearly and easily those pairs offering the best opportunities, which to ignore for the time being, and which to add to your watchlist. It’s your radar on the currency market.
The Quantum Currency Strength indicator has been designed with one simple objective in mind. To give you a bird’s eye view of the eight major currencies. To show you in a simple, quick and easy way, when a currency is either oversold or overbought, rising or falling strongly, or just going nowhere.
To help you, the indicator defines the overbought and oversold regions for you, with a simple horizontal line. One near the top at 80, and the other near the bottom at 20. When a currency reaches the upper grey line, it’s approaching an overbought state, and when a currency touches the lower grey line, conversely it’s approaching an oversold state.
It is at these points a trend is likely to reverse, offering you low-risk trading opportunities. Something you could never do quickly or easily yourself.
It displays the eight currencies individually, giving you endless combinations of trading opportunities from scalping to swing and trend trading in all the various currency pairs and in every timeframe.
US dollar – red
Euro – orange
British pound – yellow
Swiss franc – green
Japanese yen – magenta
Canadian dollar – purple
Australian dollar – blue
New Zealand dollar – white
Whilst this concept is simple, its use is sophisticated, and one which you can apply in a variety of ways. In fact four very different, but equally powerful ways, all of which will help you make money, confidently and without emotion:
First – the indicator tells you when an individual currency is overbought or oversold. Strong or weak. Unlike some assets, currencies never go to zero. It is when they reach these extreme points, that currencies offer the lowest risk trading opportunities. These are the regions at which a currency is likely to reverse from a previous trend, giving you the potential to get into a low-risk trading position early.
Second – the indicator will also tell you when it’s time to exit. After all, if it’s good enough to get you in, it’s good enough to get you out as well.
Third – when the currencies are all bunched together in the middle of the indicator – guess what. It’s time to sit on the sidelines and wait.
Finally, take your trading to another level using multiple timeframes. After all, if a currency is moving higher, or lower, across three timeframes, then even more reason to take a low-risk trade, so using the indicator in multiple timeframes is key.
And if this wasn’t enough. There is even more!
You can configure the indicator to your own personal trading style. Think of it like the volume control on your radio. You adjust it to your own personal preference. Well it’s the same here. If you are a scalping trader, simply adjust one of the indicator settings to speed up the indicator. If you are a swing or trend trader, tweak the controls to slow it down a little – the choice is yours. More control means one thing – more consistency and greater profits.
After all, why buy an indicator that you cannot match to your trading style? It would be like buying a radio with no volume control.
That’s why we call them the next generation of trading indicators for TradingView.
The Quantum Currency Strength indicator works in all timeframes from seconds and ticks to minutes and months, and the colour of each currency line on the indicator can be changed to your own personal preferences.

JZW: 8 MA's (EMA, SMA or WMA) Multi TimeframeUp to 8 Moving Averages can be applied to your chart. Each one is individually configurable for the following:
1. Length
2. Method: EMA, SMA or WMA.
3. Timeframe: Current, 1H, 2H, 4H, 6H, 12H, 1D, 3D, Weekly or Monthly.
Any MA's set to the current or higher timeframe than the chart will be displayed.
Suggested use: set 2 or 3 MA's to a higher timeframe (e.g. daily or weekly) to determine the overall trend and set the others to the current timeframe for intraday trading.
The example chart is set to EMA's 3, 5, 10, 20, 50 on current timeframe (4H) and EMA's 50, 100 & 200 for daily.
My first published script, hope you all find this useful!
Any feedback would be welcome.

MTF TRIX - squattterBest setting is 5, with a couple of signal lines set to 7 and 14 for crossovers or bounces.

Multi-Timeframe Commodity Channel IndexCCI indicator that will display resolutions other than the current.

Multi-Timeframe Relative Strength IndexRSI indicator that will display resolutions other than the current.

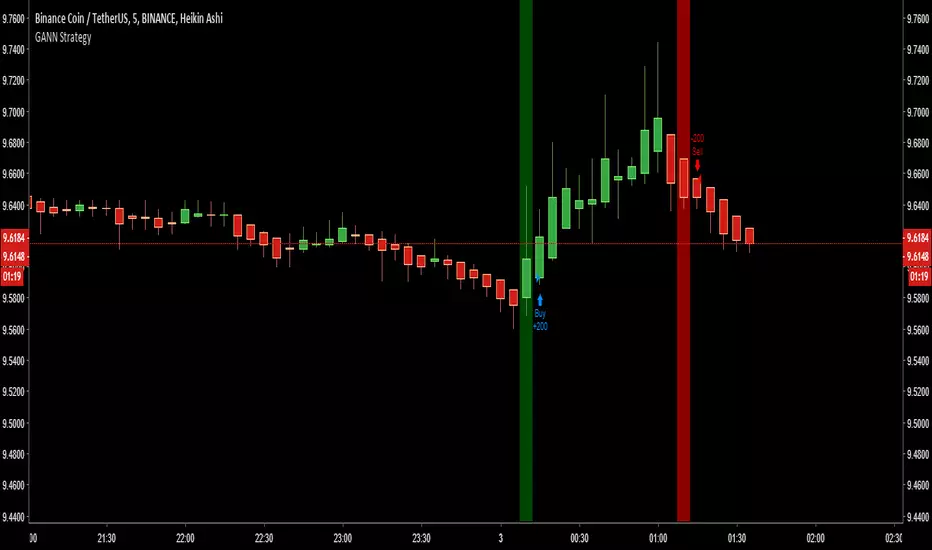
Bones1390's GANN Strategy - Works for Cryptocurrency too! [MTF]Simple Strategy.
Use this strategy with Heiken Ashi candlesticks.
RULES:
Enter Long ONE BAR after the green Vertical Signal Line plots, and sell as soon as a red Vertical Signal Line. Vice versa. You get it. ;)
My candleBu gösterge programın bir parçası ...
Bu sayede MetaTrader 4'te kullandığım göstergeleri kağıt ticareti ve ticaret görünümü için değiştirmeye karar verdim.
Bu göstergelerin yazılması arasında bir boşluk olabilir.
Bu göstergeler ücretsiz ve her zaman ücretsizdir.
Her ne sebeple olursa olsun, bu göstergelerin kaynakları gizli kalacaktır.
Bu endekslerin önceki basımlarını yazmış olabilecek arkadaşların çabaları sayesinde
Ayrıca, daha iyi ve daha başarılı bir işbirliği sunan arkadaşlar.
Haydi gidelim ...
İlk gösterge çok zamanlı bir göstergedir
Hangi şimdiki zamanda daha yüksek kez görmenizi sağlar.
Önceki sürümlerde, birkaç sorun vardı.
// mumun boyutu yüksekten düşüğe doğruydu! ve belki de gösterge göstergesine ihtiyacım var!
// otomatik bir değişiklik yapamazsınız!
// günlüklerden daha az zamanlar kullanamazsınız.
Bu endekslerin Trader adında bir sanatçı tarafından tek yol olduğunu unutmayınız !!!
Bu yüzden endekslerle çalışma sanatını öğreniz.
Sonunda, zayıf Turkce dolayı özür dilemeliyim
Bu çeviri Google Çeviri ile yapıldığı için.
#İyi şanslar#
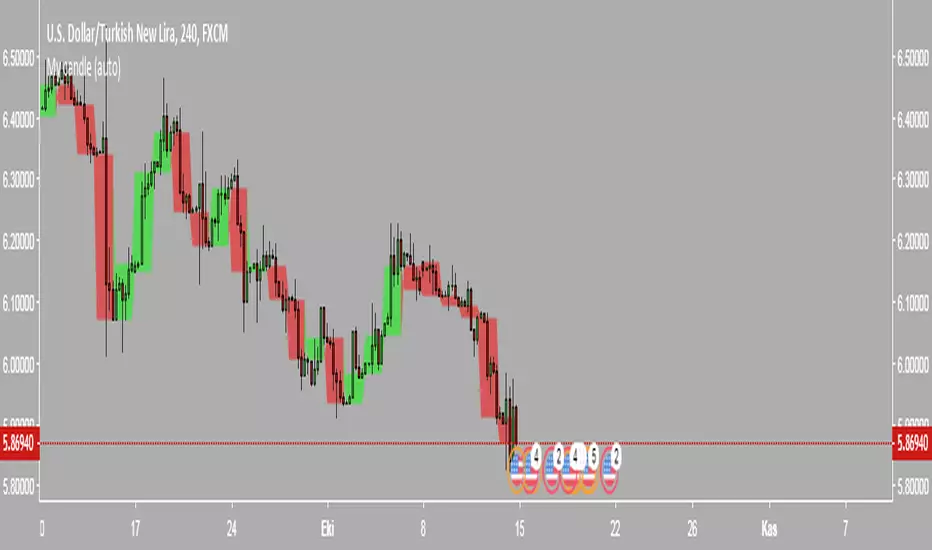
My candleThis indicator is part of the program...
In that, I decided to move the indicators I used in MetaTrader 4 for paper trader and trading view.
There may be a gap between writing these indicators.
These indicators are free and always free.
For whatever reason, the sources of these indicators will remain hidden.
Thanks to the efforts of friends who may have written previous editions of these indices
Also, friends who offer better and more successful cooperation.
Let's move ...
The first indicator is a multi-time indicator
Which allows you to see higher times at the current time.
In the previous versions, there were a few problems.
//the size of the candle was from high to low! and maybe I need the body of indicator!!
//you could not have an auto change!!
//you could not use on the times less than daily.
Do not forget that these indices are the only means by an artist called Trader !!!
So learn the art of working with indices.
In the end, I'll apologize for my weak English
Because this translation is done with Google Translate.
#Good luck#

Multi Timeframe RSI 80 20 Different with 80 - 20 lines to help catch bottoms on multi time frames. The default was 70 - 30. Changed it to be more artistic the current RSI and 1 day are red the rest are white.

Merge Of RSI & Stochastic RSI [salar88]This Indicator Include Stochastic RSI And Multiple Time Frame RSI
I Wish Its gonna useful for tradingview users

MTF StochRSI Grid v2.0 - CryptoProToolsNew version has added the following :
- Custom Time Frames (not limited to TradingViews default resolution selection)
- Optional Medium Strength Signals (Matching 3 x OB or OS instead of the full 4)
- Toggle Highlight Bar Colors ON and OFF
- Signal arrows visible above and below the grid
Original Version Can Be Found Here :
Get Access To This + All of our other current and future indicator releases with a CryptoProTools Lifetime Membership
------------------------------------------------
Other Popular CryptoProTools Releases

Ultimate 'Multi-Timeframe' Multi-Averages + Bitfinex Margin %Added Bitfinex % longs and shorts to the "Ultimate Multitimeframe Multiaverages" indicator.
It works with all coins using charts from Bitfinex.

Ichimoku DoubleTF overlay
Hello guys, this code allow to overlay a second ichimoku over the first one loaded on the used time-frame.
It's simple.
Choose your preferred Time-frame.
Set the Time-frame for the second Ichimoku in the settings menu .
Now you can see two Ichimoku clouds based on two different time-frame.
It can be very usefull and more ordered of a multi-windows layout.
On second Ichimoku the Chikou-span is omitted 'cause i think that is useless and cumbersome.
To help to reading the graph i set two labels to identify the "2nds" tenkan and kijun.
Tell me if this script was useful and remember to follow me and adding a like.
Available combinations:
DAILY: WEEKLY AND MONTLY
4H: WEEKLY, DAILY
1H: WEEKLY, DAILY, 4H
30m: DAILY, 4H, 1H
15m: DAILY, 4H, 1H, 30m
5m: DAILY, 4H, 1H, 30m, 15m
3m: 1H, 30m, 15m
1m: 1H, 30m, 15m,5m,3min
Thanks, bhutano
*****************************************************************************************************
Ciao ragazzi, questo codice permette di sovrapporre un secondo Ichimoku a quello del time-frame utilizzato.
Scegliete il vostro time-frame preferito.
Impostate il time-frame del secondo Ichimoku dalle impostazioni dello script .
Adesso vedrete due Nuvole Ichimoku basati su due time-frame diversi.
Può essere davvero utile e più ordinato di un layout multi-window.
Sul secondo Ichimoku la Chickou è stata omessa perchè penso che sia inutile e ingombrante.
Per aiutare la lettura del grafico ho impostato due etichette per identificare le seconde tenkan e kijun.
Ditemi se questo script vi è stato utile e ricordatevi di seguirmi e aggiungere un mi piace.
Combinazioni possibili:
DAILY: WEEKLY AND MONTLY
4H: WEEKLY, DAILY
1H: WEEKLY, DAILY, 4H
30m: DAILY, 4H, 1H
15m: DAILY, 4H, 1H, 30m
5m: DAILY, 4H, 1H, 30m, 15m
3m: 1H, 30m, 15m
1m: 1H, 30m, 15m,5m,3min
Grazie, bhutano

Ichimoku Cloud x10 - Time fixedDraws up to ten ichimoku clouds, timeframe independant.
Just select your ichi settings, and which timescales you want to see. Enter 0 to disable, if you want less than 10 clouds.

{CDT} v1.0 - MTF Fibonacci RSIMulti Timeframe Fibonacci RSI.... **HIGHLY EXPERIMENTAL**
To show retracement potential, squeeze's, support and resistance, overbought and oversold levels... super filtered too... a new RSI! Regular RSI shown on the chart for comparison.
* This is a crazy indicator that is still under development so use at your own risk, i'm putting this out here because i'd like feedback and its been a good leading indicator so far.
