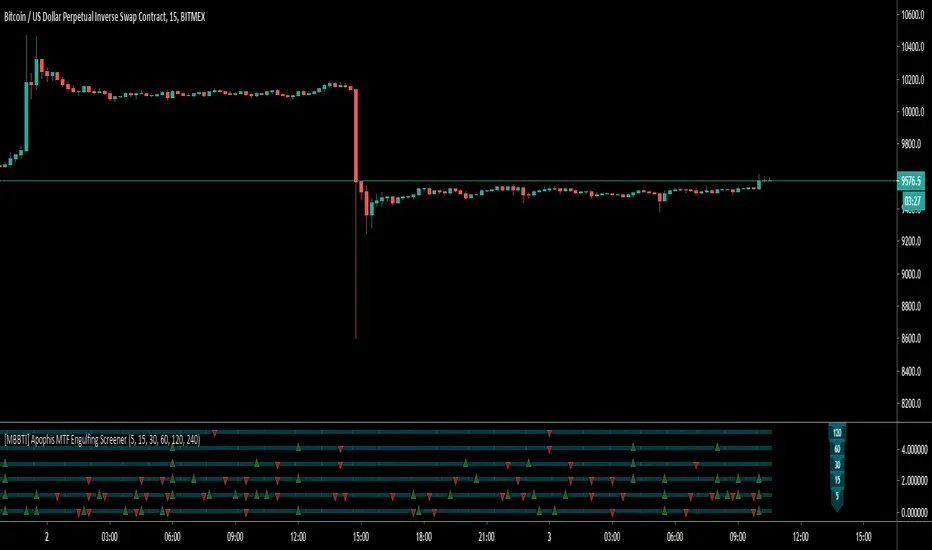
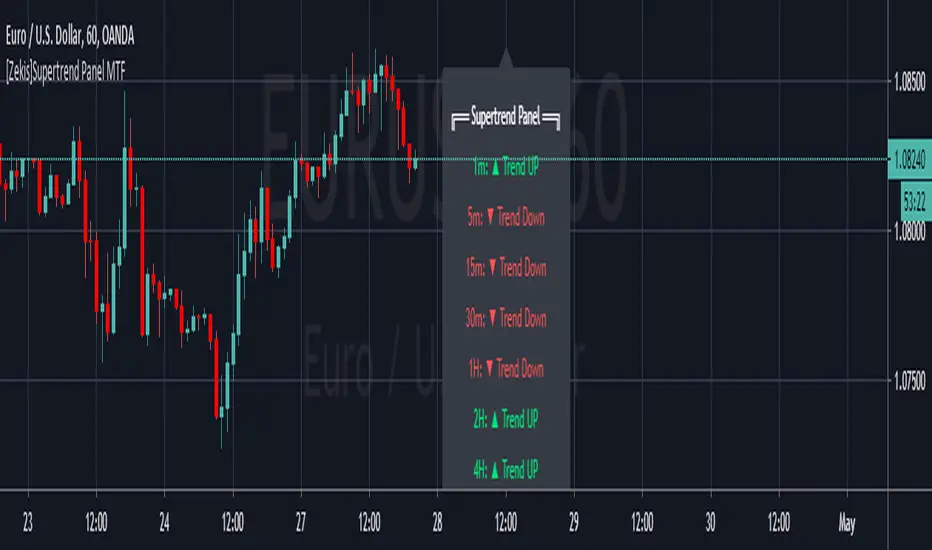
[MBBTI] Apophis MTF Engulfing ScreenerHello Traders,
Apophis MTF Engulfing Screener is based on Daveatt's Engulfing Screener and will screen for engulfing candles on multible time frames. It can help detecting not obvious engulfing candles.
How it works?
- choose your preferable time frames
- green triangle up -> bullish engulfing on this time frame
- red triangle down -> bearish engulfing on this time frame
Contact me if you have any questions or change requests
Wuuzzaa
Multi-timeframe
EMA 20/100/200 alwaysThis script will always show the EMA 20/100/200 daily values across any time frame chart (e.g. showing daily 20 EMA while viewing the 5 minute chart)

DiNapoli MACD MTFSimple oscillator, based on formula from Joe Dinapoli for MACD oscillator. Simply it's analysing current timeframe (bottom row) and 2 higher timeframes.

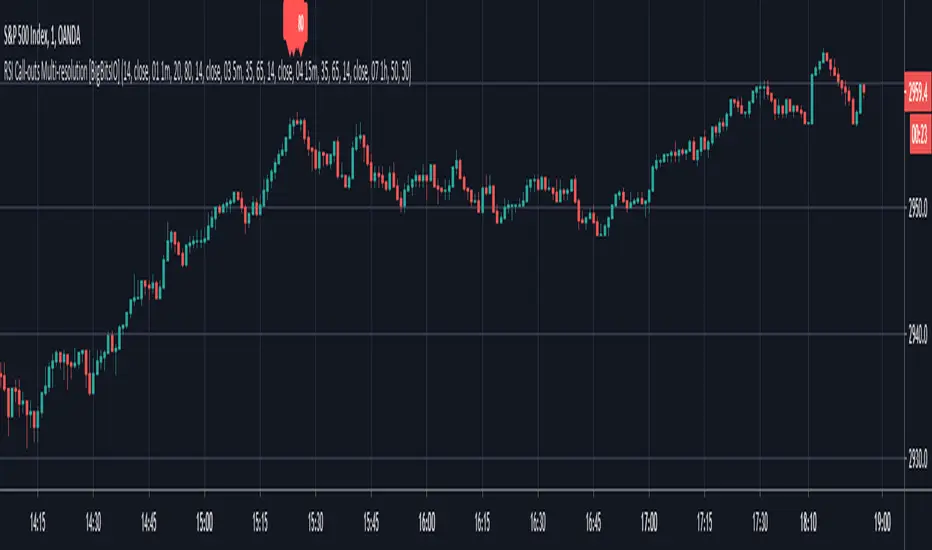
RSI Call-outs Multi-resolution [BigBitsIO]This is a simple multi-resolution (multi-timeframe) RSI indicator that overlays the current chart to show labels for specified oversold and overbought areas defined with inputs.
Up to 4 different resolutions/timeframes for their respective RSI (1,2,3, or 4). RSI1 is always enabled and can not be disabled.
Red labels with white text represent overbought RSI levels as defined by the user. All enabled RSI will have to qualify as overbought based on settings.
Green labels with black test represent oversold RSI levels as defined by the user. All enabled RSI will have to qualify as oversold based on settings.
This RSI overlay help easily call-out overbought and oversold candles on a chart where other RSI values on larger resolutions/timeframes are also oversold/overbought without sacrificing screen space for a traditional RSI indicator that is not overlayed on the chart.
This indicator has alert conditions that will trigger when all enabled RSI indicators are either oversold or overbought respective to your settings.
Note: The best results are to operate your chart as your smallest RSI resolution selected. Personally, I prefer to have my smallest (shortest timeframe) in RSI1, and go larger farther out to RSI4.

[PX] MTF RSIHello guys,
this indicator uses the RSI on three different timeframes, which can be selected in the user input settings. It aims to make your multi-timeframe analysis a bit easier and see patterns, which otherwise might not be spotted. Look for confluence within all the timeframes to increase your probabilities.
Because it uses multi-timeframe data, which can repaint, it comes with an optional checkbox to allow repainting or avoid it.
Happy trading and stay healthy :)

pip hunter baseline overlayThis is a multi time frame baseline indicator which incorporates many aspects to help you eliminate false ideas from the other 2 indicators in the pip hunter package this indicator is the baseline guide to the direction you should be looking at the markets
this indicator can do the following things
work out pivot points
work out fibonacci retracement levels
give you multi time frame based trend ideas and reversal indications this is done in a heavily modified multitimeframe Williams alligator , multitimeframe up and downtrend labels, a multitimeframe TEMA cloud and a multitimeframe dot alert which is based on a proprietary set of exponential moving averages
and give you multiple powerful confluences as to the direction of the market including but not limited to a confirmation bar at the top of the screen which changes colour and brightness depending on the direction of the trend and the amount of chop in the market, it also adds this to the candles in the form of triangles and squares above and below the candles relevant to the direction. you will notice little flag icons these are designed to be little floating take profits with the idea that when a flag appears you should take partials if not the whole position off the table and wait for another entry or for other movement to occur as well as stars these can be used as signals when used with other confluences in the system to make sure that they are valid and correct ideas
this is best used with the rest of the pip hunter package for more info on getting access to all three indicators in the package please message me for more information

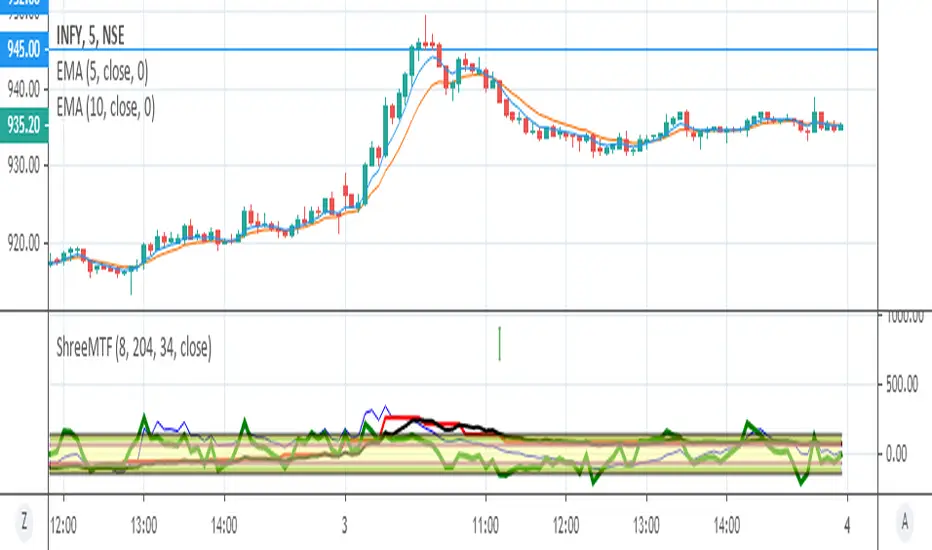
ShreeMTFShree MTF:
CCI8(5 Min)
CCI34(5 Min)
CCI34(30 Min), These 3 variants are plotted along with horizontal lines for CCI8(5 Min) with upper range of -135 and lower range of +135 & CCI34(30Min) with upper limit of +100 and lower limit of -100
Support and Resistance Multi Time frameSimple indicator showing the support and resistance on Daily, Weekly and Monthly time frames no matter what time frame you're currently on by highlighting the highest and lowest points on each over the last 34 bars.
Daily support and resistance are coloured green.
support and resistance are coloured yellow.
Monthly support and resistance are coloured red.
For best results check where multiple support and resistance areas line up and combine with another indicator for example oscillators to gauge if the support or resistance will reverse the market.

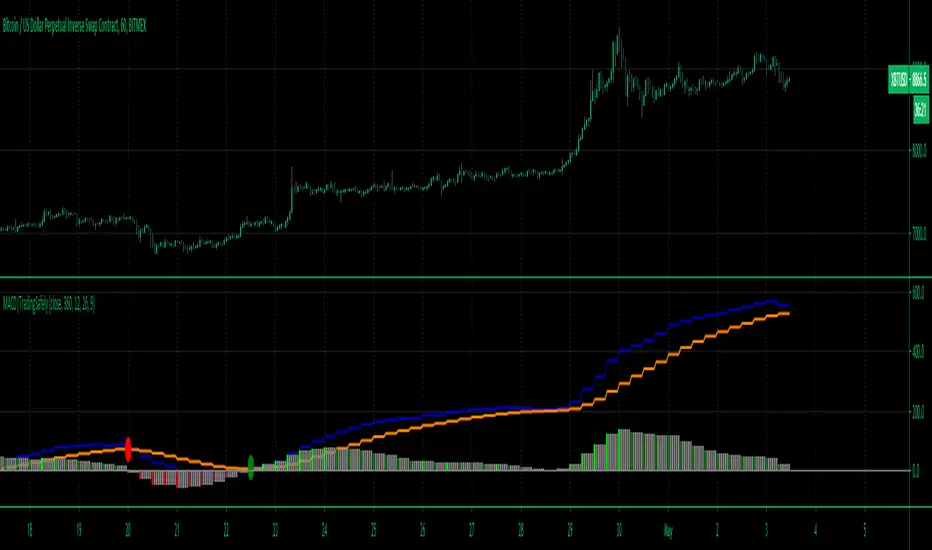
Trading Safely Multiple Time Frame Dynamic MACDOur Multi-Time frame MACD is a Zero-Lag (well near zero-lag) We make this claim because MACD utilizes Moving Averages and as you know moving averages are lagging indicators.
For our MACD we utilize The McGinley Dynamic which looks like a moving average line yet it is a smoothing mechanism for prices that turns out to track far better than any moving average.
The McGinley Dynamic minimizes price separation, price whipsaws and hugs prices much more closely.
The McGinley Dynamic does this automatically as this is a factor of the formula.
Because of the calculation, the Dynamic Line speeds up in down markets as it follows prices yet moves more slowly in up markets.
As traders we want to be quick to sell in a down market, yet ride an up market as long as possible.
How to Trade.
It best to use lower time frame charts and higher time frame MACD settings such as 1H chart and 6H (360min) MACD time frame
You can input any time frame in minutes from 1 min to 1440 minutes on the MACD settings.
1H = 60
2H = 120
3H = 180
4H = 240
6H = 360
12H = 720
24H = 1440
Week = W
Month = M
You can set alerts for bullish and bearish crossovers which are good indications of a potential entry into a long or short trade.
shout out to lonesometheblue for inspiration.
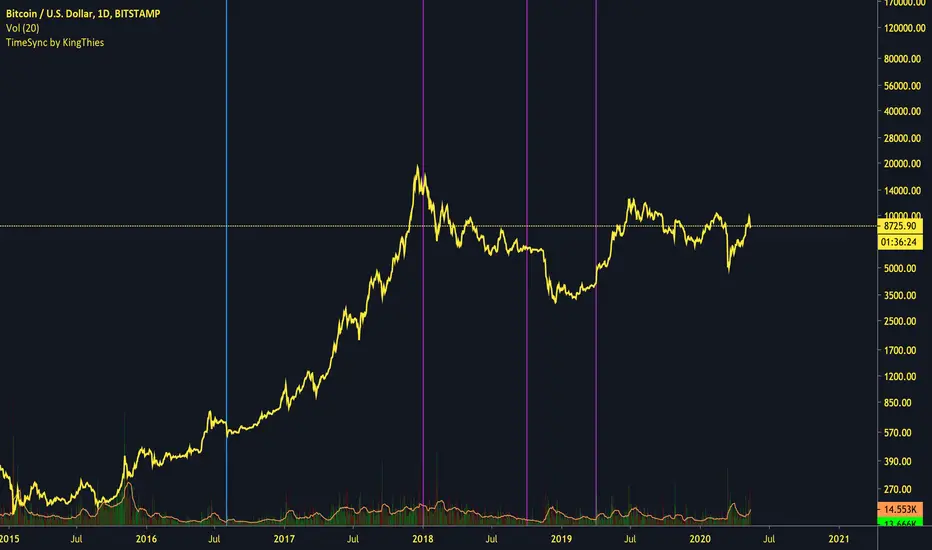
TimeSync by KingThies TimeSync by Kingthies
Written in Pine v4
Applies one function that was published in the Tradingview Pinescript Manual
The Motivation behind this script - Time is 50% of your chart. Many ignore it entirely. This should help give an idea on how to read it and incorporate it in their analysis.
TimeSync by KingThies takes a simple concept and turns it into a visual tracking system of when timeframes of significant impact, all close at the same time.
By utilizing several high time-frames, we see overlaps in periods and more significant events occurring when multiple periods close at once.
The TFs included are 3D,1W,2W and 1M. When users use the timeframes above intraday, the resolution for these HTF's is shown. When using the LTFs, anything lower than 1D/is intraday, the user sees a similar concept but comprised of the 4H, 6H,8H and 10H charts.
Users can adjust the settings to show the HTFs in sync AND also factor in if the event was on a business quarter or new year, which adds more significance to the occurrence.
By seeing when these periods end in sync, we can assume more volatility is present in a given market, presenting various opportunities for traders to take advantage of a given situation.
Apologies in advance for any questions that come up - I will do my best to reply or respond here on Tradingview.com.
Additional Resources for this topic can be found in my account signature, located at the bottom of this post.
MTF Trailing SL Alerts [QuantNomad]These are alerts for my MTF Trailing SL Strategy.
Entry Long position if all 4 time-frames agree on the long signal.
Exit Long positions when at least 2 time-frames disagree on the long signals.
Entry to Short position if all 4 time-frames agree on Short signal.
Exit from Short positions when at least 2 time-frames disagree on Short signal.
Use "Once Per Bar Close" when creating alerts.
Link to the strategy:
Multi Time Frame StochasticThis Indicator draws 6 Stochastic Plots with different Time Frames showing only K Value.
Available Time Frames: 3m, 5m, 15m, 30m, 60m, 240m
Briz HA MTF - A Heikin-Ashi Multi-Timeframe Indicator Ever wanted to know what Heikin-Ashi candles are showing for multiple time frames at a glance? Adjustable time frame for each row. Arrows show when each column is either all green (white up arrow) or all red (yellow down arrow).

MTF Ichimoku CloudIchimoku Cloud , Multiple Time Frames, based on the script : MTF Selection Framework functions (PineCoders)
Possible display:
- four differents Ichimoku
- Tenkan, Kijun, Chikou and Kumo (monochrome or not)
- labels : offset from line, color if you change style and with/without abbreviation
Time Frames :
- 1m
- 3m
- 5m
- 15m
- 30m
- 45m
- 1h
- 2h
- 3h
- 4h
- Daily
- Weekly
- Monthly

MTF TrendLines [Private]As the name suggests, the Multi-Timeframe (MTF) Trendlines indicator allows you to extrapolate trendlines from a higher timeframe into your chart timeframe. A maximum of one upper trendline and one lower trendline will be plotted per indicator instance. You can load multiple copies of the indicator into your chart and manually set each copy to operate in a different higher timeframe.
The trendlines are based on the two most recent upper and lower qualifying pivots found in the higher timeframe, and you can adjust the pivot size via the settings menu. In order to qualify, an upper trendline must have a flat to downward slope and a lower trendline must have a flat to upward slope. In both cases there should not be any breach of the trendline between the two pivots. A tolerance factor is provided so you can introduce some leeway in terms of what constitutes a breach.
As mentioned above, the trendlines are actually extrapolated into the chart timeframe. By that we mean that the cluster of bars that comprise each individual pivot in the higher timeframe are located in the chart timeframe, and the bar with the highest-high/lowest-low is used as the actual pivot point. This is necessary because, for example, the high of a daily pivot bar may not always exactly match the highest-high found in the pivot cluster in the chart timeframe.
In terms of selecting the higher timeframe, there are two modes of operation which can be selected via the settings dialog. In Auto Mode the indicator will automatically select the higher timeframe to use based on your chart timeframe. In Manual Mode you select the higher timeframe to use. In either case the selected higher timeframe must always be greater than or equal to the chart timeframe.
Along with each trendline you can also elect to plot pivot markers as well as price labels. Each can be customized and/or toggled on or off via the settings dialog.
The pivot markers will display as up or down triangle shapes plotted below (for lower trendline) or above (for upper trendline) the two price bars that represent the two pivots used in generating the trendline. You have the option to display just the marker, or display the marker plus the timeframe.
The price labels will display on the most current price bar (an offset is provided) and can be configured to display the trendline value as of that bar, the trendline timeframe, or both. You can also adjust the orientation of the price labels.
For the trendlines themselves, you can adjust the color, thickness, and line type. You can also toggle upper and lower trendlines on or off independently.
Please visit the link in our Signature for pricing.

Multi-TimeFrame Bollinger BandsScript which plot multi-timeframe bollinger bands, up to 3 different timeframes. It is intended to show higher timeframe bands on a smaller timeframe. Default options are 1m, 5m and 15m and used on a 1m chart for crypto-currencies.
It can be used to get a better overview of the current trend.
Level KingShows key historical support & resistance (S/R) levels on multiple timeframes
Shows two nearest levels below and above current close price on 2 selected time frames
Option to select timeframes (daily, weekly, monthly, current)
Option to display moving average S/R levels as well (daily and weekly)
Option to display levels for current bar only, or to show all historic S/R levels as they occurred
Strategies include:
Enter or add to long positions on "support" (when price touches a green/blue line)
Enter or add to short positions on "resistance" (when price touches a red/purple line)
Take profit from a long position when a "resistance" level is touched for the first time
Take profit from a short position when a "support" level is touched for the first time

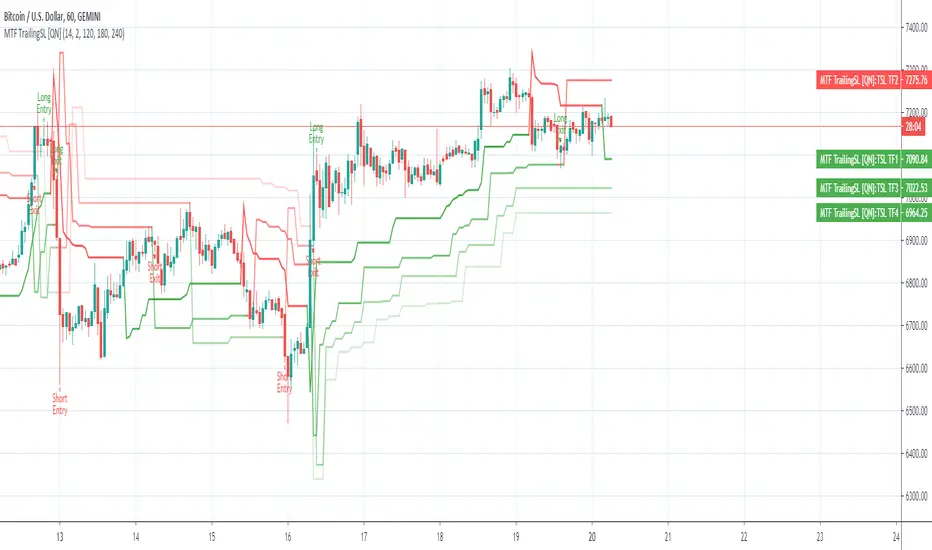
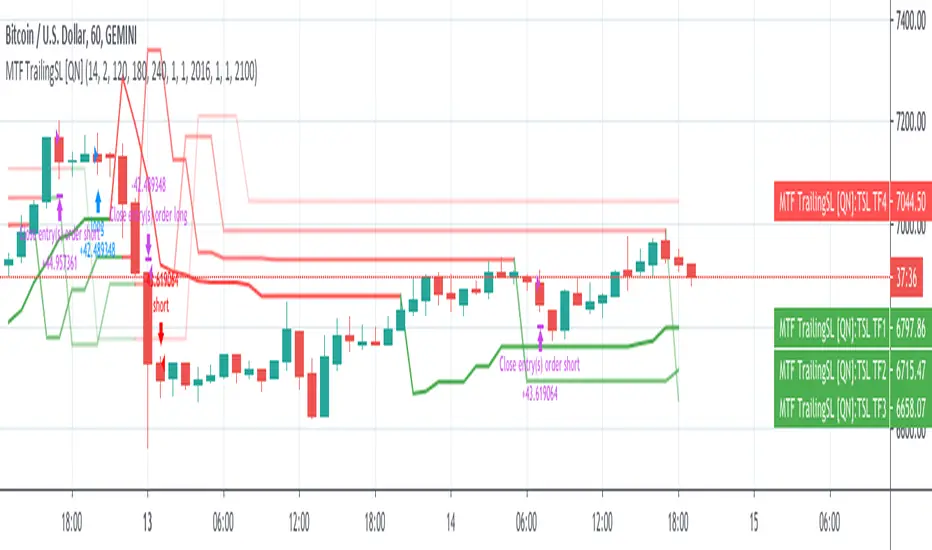
MTF Trailing SL Strategy [QuantNomad]This is a Multi-Timeframe version of my Trailing SL Strategy.
Few weeks ago I published Trailing SL Strategy. There I used only basic Trailing SL to enter positions.
It worked pretty well so I tried to work on it a bit. I thought what if you can use the same ATR TSL on different timeframes and combine them into one signal.
In this strategy you can use only ATR stops and choose 3 other higher timeframes in addition to your current timeframe.
You'll see Trailing SL plotted on the chart form all these timeframes.
Entry Long position if all 4 time-frames agree on long signal.
Exit Long positions when at least 2 time-frames disagree on long signal.
Entry to Short position if all 4 time-frames agree on Short signal.
Exit from Short positions when at least 2 time-frames disagree on Short signal.
Here is the link to my basic Trailing SL Strategy:
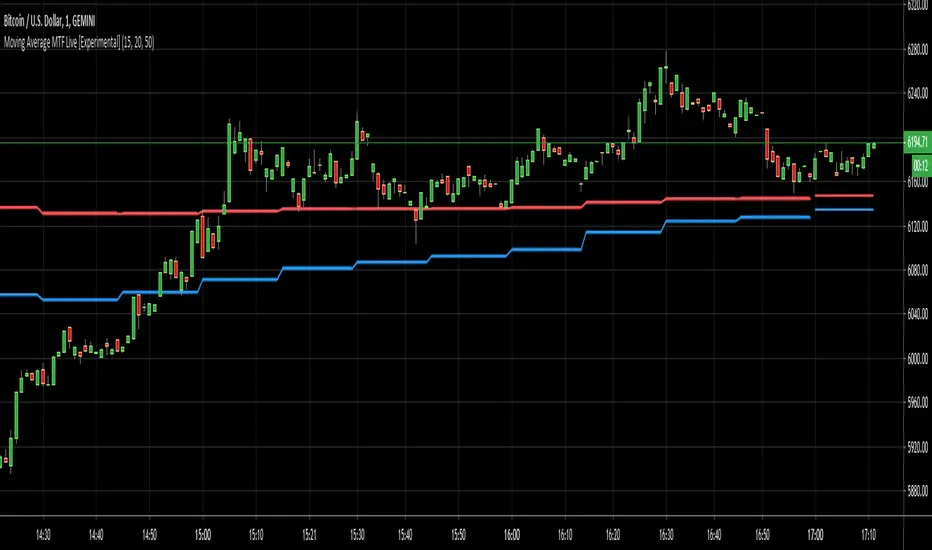
Moving Average MTF Live [Experimental]Hello Everyone,
While using "Security" function for Higher Time Frames (htf) you must accept "Repainting" issue or better you must use previous day data such "security(syminfo.tickerid, 'D', close, lookahead=barmerge.lookahead_on)" that's best normally (or barmerge.lookahead_off). But the problem is (as you can see) it uses previous day data, and this causes latency.
So how to draw LIVE and NON-REPAINTING HTF moving averages?
Until the last candle of higher time frame all is fine and no repaint issue. when it came to last candle of HTF and if we use real data, (because of we can not know the future) while price is changing it starts drawing on each candle of current period without correcting old ones (this is repaint issue). it needs to calculate number of curent time frame candles for higher time frame and must change all points in that period as you can see in the video below.
We have "50 lines" limitation in current Pine version. we hope to have unlimited lines in next versions.
This work is completely experimetal.
btw Thanks to all Pine Platform Developers, They are doing very good job !
Better to watch following video to see how they look like:
P.S. There is no check for Higher time frame, so you should set time frame for HTF accordingly in the options.
Enjoy!
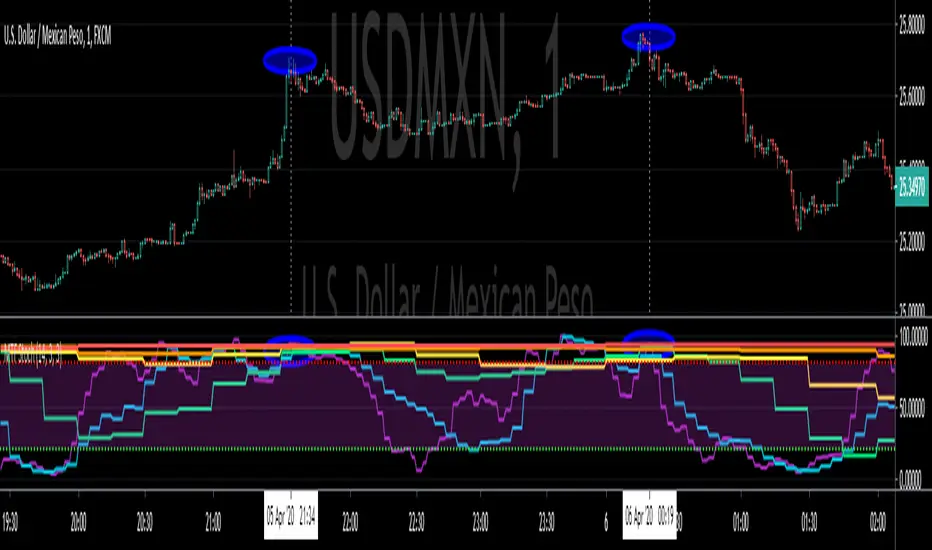
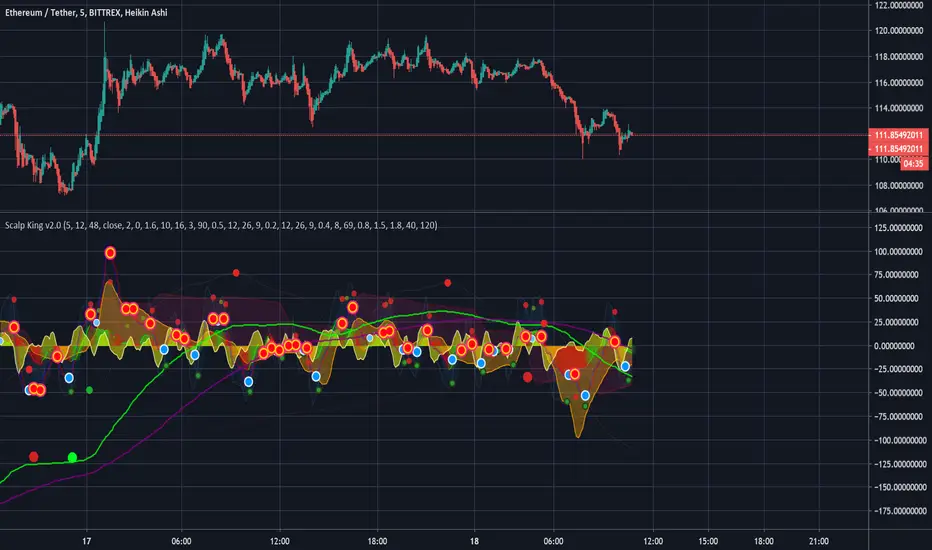
Scalp King v2.0 - Multi-time VWAP, multi-condition alertsMulti time-range VWAP with Multiple condition alerts - version 2.0 - by Viral Killer
This is a script that contains 3 VWAP modes, 5 min, 60 min and 240 min timeframes, all on the same indicator. You add it to the 5 min chart, but seems to work on other ranges.
Usually, when the VWAP wave crosses above, it is a buy signal, although not perfect. This ensures there is also a MAC-D buy confirmation, for a much stronger buy signal.
You can setup SUPER alerts which ensure multiple time ranges line up, before alerting. Some are already built in.
Yellow Wave is 5 min VWAP , crossing from below into positive is a buy signal. Note the word signal, not guaranteed buy.
Orange Wave is 60 min VWAP , crossing from below into positive is a buy signal.
Purple Wave is 240 min VWAP , crossing from below into positive is a buy signal.
The blue wave is 5 the minutes RSI and the other lines are 1h/4h, corresponding to oversold and overbought signals.
U will see a trail of red and blue arrows on the MAC-D, this script knows when the MAC-D is losing power.
Green dots are a buy, dark dots are a sell. Green with orange rim is a weak buy.
If you see 2 or 3 green dots from different time frames very close together, that is a much stronger buy signal. If the MAC-D also agrees, well, it is very strong. This is shown as blue circle white arrow up.
Exit when you see a red cross or red arrow down, RSI overbought and MAC-D crossing down respectively.
You can use multi condition alerts, i.e. alert me to a STRONG BUY when 5 min VWAP crossed above while the 60 min is positive too, aaaand the MAC-D agrees.
Enjoy.
-Viral Killer
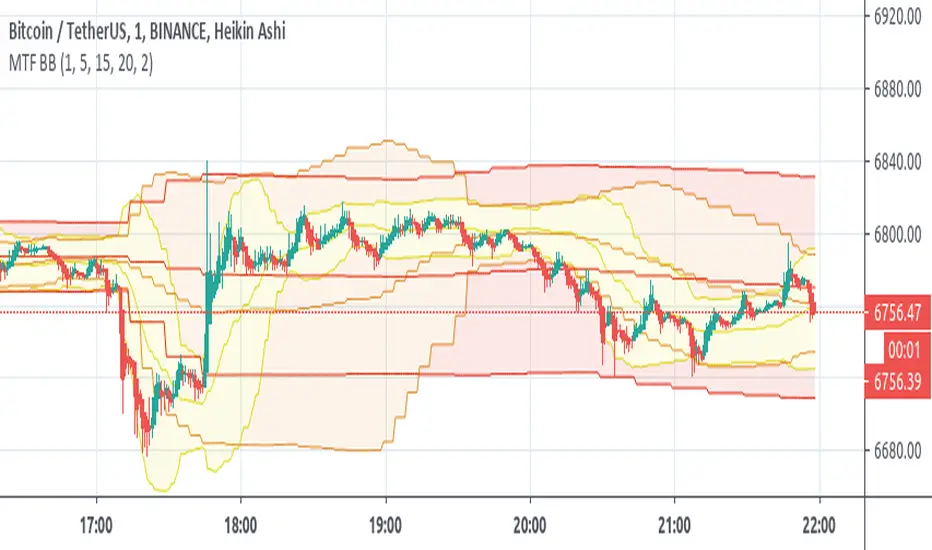
[fikira] Bollinger Bands + Higher Time FramesHere is my take on BB and MTF, based on the most excellent work of
"PineCoders" (MTF Selection Framework functions)!
The big advantage is that on 1 image you can easily see where
price is compared to 5 or less BB Bands (each of different Time Frames).
This gives a lot of Support and Resistance area's!
Includes:
- 1 Bollinger Bands (can be enabled/disabled - "Bollinger Bands"
- 4 Bollinger Bands (each can be enabled/disabled - "HTF Selection 1-4")
Each BB has its colour (can be changed)
- Labels (Timeframe and price) can be enabled/disabled
- Labels position and size can be changed
...
