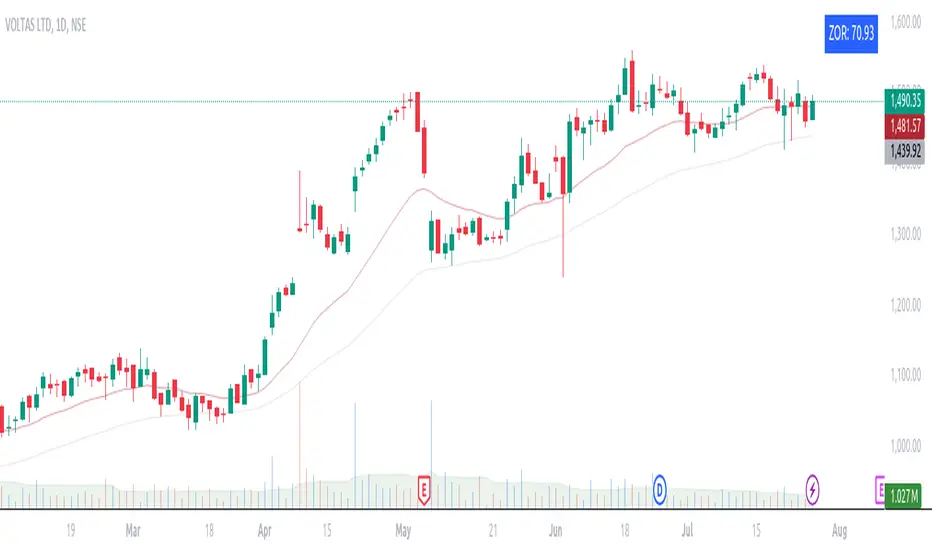
ZORZOR (Zone of Outperformance Ratio) with Supporting Indicators
This custom indicator introduces an approach to measuring asset performance through the Zone of Outperformance Ratio (ZOR), complemented by two supporting indicators for comprehensive market analysis.
1. ZOR (Zone of Outperformance Ratio)
The ZOR is the cornerstone of this indicator, offering a unique perspective on an asset's performance across multiple time zones:
Measures the degree of an asset's outperformance against a benchmark (default: NSE:NIFTY) across different time zones
Utilizes a weighted multi-timeframe approach for a holistic performance view
Combines performance ratios from 63, 126, 189, and 252-day zones and results in a score between 0-99, with higher scores indicating stronger outperformance across zones
Key Features:
Fully configurable weights for each timeframe (63, 126, 189, 252 days)
Customizable benchmark symbol
Color-coded display: Blue for scores ≥60 (strong performance), Red for scores <60 (weaker performance)
2. Supporting Indicators
To enhance analysis and provide context to the ZOR score, two additional indicators are included:
a) Distance to 52-week High:
Calculates the percentage distance between current price and 52-week high
Color-coded for quick interpretation:
Yellow-green when price is above 52-week high
Dark green when price is below 52-week high
Helps identify potential overbought conditions or breakout scenarios
b) Distance to EMA:
Shows percentage distance from current price to a user-defined EMA (default: 21-day)
Helps gauge short-term momentum relative to the trend
Useful for identifying potential mean reversion opportunities
Originality and Usefulness
The ZOR indicator offers a fresh perspective on relative performance by:
Combining multiple timeframes into a single, easy-to-interpret score
Applying a non-linear transformation to emphasize recent performance
Providing a flexible framework for comparing assets against any chosen benchmark
The supporting indicators complement the ZOR by offering additional context:
Distance to 52-week High helps identify potential trend strength and breakout scenarios
Distance to EMA provides insights into short-term momentum and potential mean reversion
This combination allows traders to:
Quickly identify outperforming assets across multiple timeframes
Assess whether an asset is extended from its long-term highs or short-term average
Make more informed decisions by considering relative performance, trend strength, and momentum in a single view
How to Use
1. Add the indicator to your chart
2. Customize settings in the indicator properties:
- Set benchmark symbol
- Toggle visibility of supporting indicators
- Customize EMA length for Distance to EMA
- Adjust ZOR calculation weights(Optional)
3. Interpret the color-coded labels:
- ZOR: Blue (strong performance) or Red (weaker performance)
- Distance to High: Yellow-green (above 52-week high) or Dark green (below)
- Distance to EMA: Purple label showing percentage
4. Use in conjunction with other technical and fundamental analysis for comprehensive trading decisions
This indicator provides a unique, multi-faceted approach to performance analysis, combining relative strength measurement with trend and momentum indicators for a holistic market view.
Relativestrength
RSI DeviationAn oscillator which de-trends the Relative Strength Index. Rather, it takes a moving average of RSI and plots it's standard deviation from the MA, similar to a Bollinger %B oscillator. This seams to highlight short term peaks and troughs, Indicating oversold and overbought conditions respectively. It is intended to be used with a Dollar Cost Averaging strategy, but may also be useful for Swing Trading, or Scalping on lower timeframes.
When the line on the oscillator line crosses back into the channel, it signals a trade opportunity.
~ Crossing into the band from the bottom, indicates the end of an oversold condition, signaling a potential reversal. This would be a BUY signal.
~ Crossing into the band from the top, indicates the end of an overbought condition, signaling a potential reversal. This would be a SELL signal.
For ease of use, I've made the oscillator highlight the main chart when Overbought/Oversold conditions are occurring, and place fractals upon reversion to the Band. These repaint as they are calculated at close. The earliest trade would occur upon open of the following day.
I have set the default St. Deviation to be 2, but in my testing I have found 1.5 to be quite reliable. By decreasing the St. Deviation you will increase trade frequency, to a point, at the expense of efficiency.
Cheers
DJSnoWMan06

Volume Weighted Relative Strength Index (VWRSI) [AlgoAlpha]Volume Weighted Relative Strength Index 📈✨
The Volume Weighted Relative Strength Index (VWRSI) by AlgoAlpha enhances traditional RSI by incorporating volume weighting, providing a more nuanced view of market strength. It uses custom range detection to measure consolidation strength, applying dynamic scoring to highlight trend phases. The indicator includes customizable moving averages (SMA, EMA, WMA, VWMA) and color-coded visual cues for uptrends and downtrends. Additionally, it marks significant bullish and bearish trend points with symbols, making it easier to identify potential trading opportunities. This powerful tool helps traders make informed decisions by combining volume, price action, and trend analysis.
✨ Key Features :
📊 Volume-Weighted RSI : Combines RSI with volume for better accuracy.
🔄 Range Detection : Identifies consolidation phases.
🎨 Customizable MAs : Choose from various moving averages.
🔔 Alert Capabilities : Set notifications for trend points.
🚀 How to Use :
🛠 Add Indicator : Add the indicator to favorites, and customize the settings to suite your trading style.
📊 Analyze Market : Watch RSI and range score for trends.
🔔 Set Alerts : Get notified of bullish/bearish points.
✨ How It Works :
The Volume Weighted Relative Strength Index (VWRSI) combines traditional RSI with volume weighting to offer a more comprehensive view of market momentum. It calculates the RSI using the closing price, then weights it by volume to enhance the accuracy of the trend analysis. The indicator also includes a custom range detection feature that evaluates consolidation strength by dynamically scoring the RSI over a specified period. This scoring helps identify phases of strong trends and consolidations. Visual elements like color-coded trend fills and symbols for bullish and bearish points make it easier to spot key market movements and potential trading opportunities.
Stay ahead with VWRSI by AlgoAlpha! 📈💡

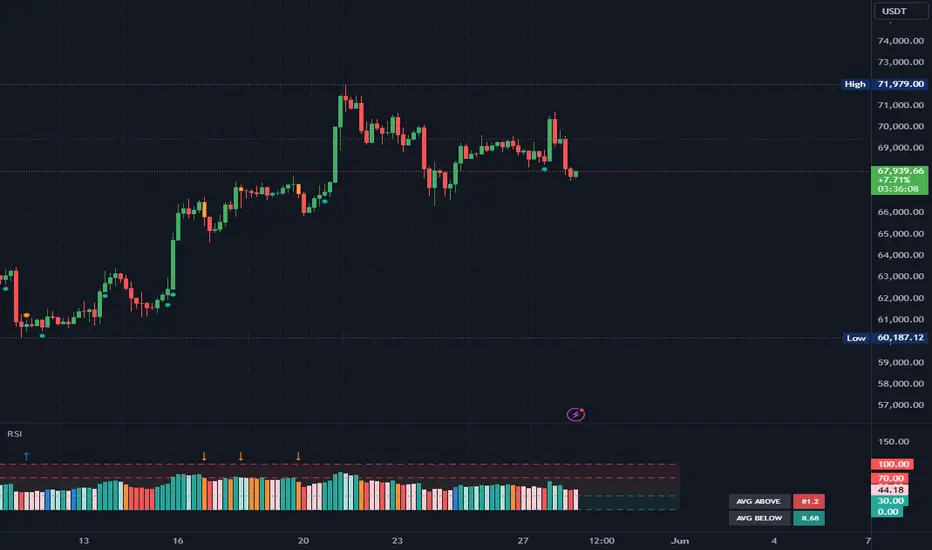
RSI - Made EasyThis indicator is a visually improved version of RSI. It makes it much easier to see what's happening by simplifying those confusing, intersecting lines. With this, you can detect the RSI direction more clearly. All the features are also explained in the tooltips of the input fields. Some extra features are included, such as average top and bottom calculation, standard deviation and divergences.
Color legend:
Green: RSI Above MA and Rising
Light Green: RSI Above MA and Falling
Red: RSI Below MA and Falling
Light Red: RSI Below MA and Rising
Blue: RSI Crossover MA
Orange: RSI Crossunder MA
Blue Arrow: Bullish Divergence
Orange Arrow: Bearish Divergence
RSI Screener / Heatmap - By LeviathanThis script allows you to quickly scan the market by displaying the RSI values of up to 280 tickers at once and visualizing them in an easy-to-understand format using labels with heatmap coloring.
📊 Source
The script can display the RSI from a custom timeframe (MTF) and custom length for the following data:
- Price
- OBV (On Balance Volume)
- Open Interest (for crypto tickers)
📋 Ticker Selection
This script uses a different approach for selecting tickers. Instead of inputting them one by one via input.symbol(), you can now copy-paste or edit a list of tickers in the text area window. This approach allows users to easily exchange ticker lists between each other and, for example, create multiple lists of tickers by sector, market cap, etc., and easily input them into the script. Full credit to @allanster for his functions for extracting tickers from the text. Users can switch between 7 groups of 40 tickers each, totaling 280 tickers.
🖥️ Display Types
- Screener with Labels: Each ticker has its own color-coded label located at its RSI value.
- Group Average RSI: A standard RSI plot that displays the average RSI of all tickers in the group.
- RSI Heatmap (coming soon): Color-coded rows displaying current and historical values of tickers.
- RSI Divergence Heatmap (coming soon): Color-coded rows displaying current and historical regular/hidden bullish/bearish divergences for tickers.
🎨 Appearance
Appearance is fully customizable via user inputs, allowing you to change heatmap/gradient colors, zone coloring, and more.

Relative Strength Universal
Relative strength is a ratio between two assets, generally it is a stock and a market average (index). RS implementation details are explained here .
This script automatically decides benchmark index for RS calculation based on market cap input values and input benchmark indices values.
Relative strength calculation:
"To calculate the relative strength of a particular stock, divide the percentage change over some time period by the percentage change of a particular index over the same time period". This indicator value oscillates around zero. If the value is greater than zero, the investment has been relatively strong during the selected period; if the value is less than zero, the investment has been relatively weak.
In this script, You can input market cap values and all are editable fields. If company market cap value is grater than 75000(Default value) then stock value will be compared with Nifty index. If company market cap is between 75000 and 25000 then stock value will be compared with midcap 150 to calculate RS. If marketcap is greater than 5000 and less than 25000 then RS will be calculated based on smallcap250. If marketcap is less than 5000 and greater than 500 then it will be compared with NIFTY_MICROCAP250

RSI AcceleratorThe Relative Strength Index (RSI) is like a fitness tracker for the underlying time series. It measures how overbought or oversold an asset is, which is kinda like saying how tired or energized it is.
When the RSI goes too high, it suggests the asset might be tired and due for a rest, so it could be a sign it's gonna drop. On the flip side, when the RSI goes too low, it's like the asset is pumped up and ready to go, so it might be a sign it's gonna bounce back up. Basically, it helps traders figure out if a stock is worn out or revved up, which can be handy for making decisions about buying or selling.
The RSI Accelerator takes the difference between a short-term RSI(5) and a longer-term RSI(14) to detect short-term movements. When the short-term RSI rises more than the long-term RSI, it typically refers to a short-term upside acceleration.
The conditions of the signals through the RSI Accelerator are as follows:
* A bullish signal is generated whenever the Accelerator surpasses -20 after having been below it.
* A bearish signal is generated whenever the Accelerator breaks 20 after having been above it.

RSI Overbought/Oversold [Overlay Highlighter]Indicator to show when the RSI is in oversold(Below 30) or overbought (Above 70) conditions. The background color of the chart changes colors in the areas where the above conditions are met.
Price can often reverse in these areas. However, this depends on the strength of the trend and price may continue higher or lower in the direction of the overall trend.
Divergence has been added to aid the user in timing reversals. Divergences are plotted by circles above or below the candles. Divergence is confirmed so there is a delay of one candle before the signal is given on the previous candle. Again, everything depends on the strength of the trend so use proper risk management.
Once the RSI has entered into oversold/overbought conditions, it is recommended to wait for divergence before entering into the trade near areas of support or resistance. It is recommended to utilize this strategy on the H4 timeframe, however, this particular strategy works on all timeframes.
This indicator is a modified version of seoco's RSI Overbought/Oversold + Divergence Indicator . The user interface has been refined, is now overlayed on the chart, and my own divergence code has been inserted.

UT Bot Stochastic RSIUT Bot Stochastic RSI is a powerful trading tool designed to help traders identify potential buy and sell signals in the market. This indicator combines the Stochastic and RSI (Relative Strength Index) oscillators, two of the most popular and effective technical analysis tools, to provide a comprehensive view of market conditions.
The Stochastic oscillator is a momentum indicator that compares a security's closing price to its price range over a given time period. The RSI, on the other hand, is a momentum oscillator that measures the speed and change of price movements. By combining these two indicators, the UT Bot Stochastic RSI can help traders identify overbought and oversold conditions, as well as potential trend reversals.
The UT Bot Stochastic RSI also includes an ATR (Average True Range) trailing stop, which can be used to set stop-loss levels and manage risk. This feature is particularly useful in volatile markets, where price movements can be large and unpredictable.
In addition to its powerful technical analysis tools, the UT Bot Stochastic RSI also includes a backtesting feature, allowing traders to test their strategies on historical data. This can help traders identify the most effective settings for the indicator and improve their trading performance.
Overall, the UT Bot Stochastic RSI is a versatile and effective tool for traders of all levels, providing valuable insights into market conditions and helping to improve trading decisions

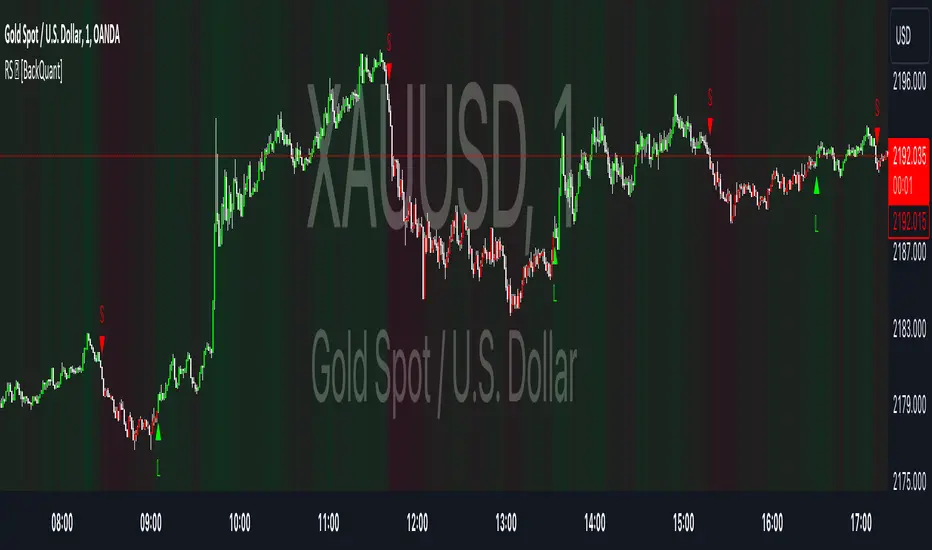
Relative Strength Overlay [BackQuant]Relative Strength Overlay
Relative Strength Overlay is a new innovative proprietary adaptive calculation to get an assets relative strength. To ensure this is well put together and easy for traders to use we have made it into an overlay. Allowing traders and investors to spot clear trends in both the up and down directions. Providing clear signals, and an option for a gradient to allow users to screen assets with strong relative strength and potentially define a trading period.
Please take the time to read the following.
Importance and Concepts
1. Adaptive Relative Strength Calculation:
At the heart of this indicator lies an adaptive relative strength calculation, a pivotal concept that goes beyond the traditional RSI (Relative Strength Index) by dynamically adjusting its sensitivity based on recent price action. This adaptability ensures that the indicator is more responsive to current market conditions, enhancing its effectiveness in signaling potential reversals or continuations.
2. Volatility and Price Action Adaptivity:
Incorporating an adaptive approach to both volatility and price action, the indicator refines its signals to reflect the current market environment more accurately. This adaptability is achieved through a custom calculation that considers the volatility (using ATR - Average True Range) and price action (through DEMA - Double Exponential Moving Average), ensuring that the indicator remains sensitive to sudden changes in market dynamics.
3. DEMA Utilization:
The use of DEMA provides a price-adaptive mechanism that smoothens the indicator's output, making it more reliable during volatile periods. DEMA helps in reducing the lag associated with traditional moving averages, offering a quicker response to price changes and enhancing the adaptive nature of the relative strength calculation.
Main Features and Trading Applications
Comprehensive UI Settings:
The indicator comes with extensive user interface settings, allowing traders to customize various parameters according to their trading preferences. These settings include adjustment options for calculation periods, standard deviation factors, and the ability to toggle features like volatility bands and signal lines on or off.
Volatility-Adjusted Bands:
Utilizing a custom ATR calculation, the indicator plots volatility bands that adjust according to current market volatility. These bands serve as dynamic support and resistance levels, providing traders with potential entry and exit points based on the confluence of relative strength signals and band breaches.
Calibrated Trading Conditions:
The indicator features pre-modeled long and short conditions that have been backtested to ensure robustness. These conditions help in identifying high-probability trading setups, making the indicator a valuable tool for both discretionary and systematic traders, mainly looking to either define a trading period, or capture clear trends in confluence with other metrics.
Trading Range Identification:
By filtering assets based on their relative strength, traders can use the indicator to identify securities with strong momentum. This feature is particularly useful for portfolio selection and asset screening, allowing traders to focus on the most promising opportunities.
Gradient Background Hue:
The indicator offers a unique visual aid in the form of a gradient background hue, which assists in quickly screening assets based on their relative strength. This color-coding feature aids in identifying potential reversals as it highlights changes in the strength's direction.
Adaptive Volatility Bands with Standard Deviations:
The inclusion of three sets of volatility bands, each corresponding to different standard deviations, provides a probabilistic view of price movements. These bands adapt to current market volatility, offering traders insights into the likelihood of price staying within certain ranges. This goes up to +-3 Standard Deviations.
Alert Conditions and Signal Visualization:
With built-in alert conditions for long and short signals, along with the ability to paint candles according to the prevailing trend, traders can stay informed about significant market movements. This feature enhances the decision-making process by visually representing the strength and direction of the trend.
alertcondition(ta.crossover(BackQuant, 0), title="Positive RS", message="Positive RS {{exchange}}:{{ticker}}")
alertcondition(ta.crossunder(BackQuant, 0), title="Negative RS", message="Negative RS {{exchange}}:{{ticker}}")
Concluding Remarks.
In conclusion our Relative Strength Overlay indicator is a comprehensive tool that leverages adaptive calculations and volatility adjustments to provide traders with nuanced insights into market conditions. By combining traditional concepts with innovative features, this indicator offers a versatile solution for traders seeking to enhance their market analysis and identify high-probability trading opportunities.
Thus following all of the key points here are some sample backtests on the 1D Chart
Disclaimer: Backtests are based off past results, and are not indicative of the future.
INDEX:BTCUSD
INDEX:ETHUSD
BINANCE:SOLUSD
RSI over screener (any tickers)█ OVERVIEW
This screener allow you to watch up to 240 any tickers you need to check RSI overbought and oversold using multiple periods, including the percentage of RSIs of different periods being overbought/oversold, as well as the average between these multiple RSIs.
█ THANKS
LuxAlgo for his RSI over multi length
I made function for this RSI and screener based on it.
allanster for his amazing idea how to split multiple symbols at once using a CSV list of ticker IDs
█ HOW TO USE
- hide chart:
- add 6 copies of screener
- change list number at settings from 1 to 6
- add you tickers
Screener shows signals when RSI was overbought or oversold and become to 0, this signal you may use to enter position(check other market condition before enter).
At settings you cam change Prefics, Appendix and put you tickers.
limitations are:
- max 40 tickers for one list
- max 4096 characters for one list
- tickers list should be separated by comma and may contains one space after the comma
By default it shows almost all BINANCE USD-M USDT tickers
Also you can adjust table for your screen by changing width of columns at settings.
If you have any questions or suggestions write comment or message.

Supertrended RSI [AlgoAlpha]🚀📈 Introducing the Supertrended RSI Indicator by AlgoAlpha!
Designed to empower your trading decisions, this innovative Pine Script™ creation marries the precision of the Relative Strength Index (RSI) with the dynamic prowess of the SuperTrend methodology. Whether you’re charting the course of cryptos, riding the waves of stock markets, or navigating the futures landscape, our SuperTrended RSI Indicator is your go-to tool for uncovering unique trend insights and crafting trading strategies. 🌟
Key Features:
🔍 Enhanced RSI Analysis: Combines the traditional RSI with a supertrend calculation for a dynamic look at market trends.
🔄 Multiple Moving Averages: Offers a selection of moving averages including SMA, HMA, EMA, and more for tailored analysis.
🎨 Customizable Visuals: Choose your own color scheme for uptrends and downtrends to match your trading dashboard.
📊 Flexible Input Settings: Tailor the indicator with customizable lengths, factors, and smoothing options.
⚡ Real-Time Alerts: Set alerts for bullish and bearish reversals to stay ahead of market movements.
Quick Guide to Using the Supertrended RSI Indicator
Maximize your trading with the Supertrended RSI by following these streamlined steps! 🚀✨
🛠 Add the Indicator: Search for "Supertrended RSI " in TradingView's Indicators & Strategies. Customize settings like RSI length, MA type, and Supertrend factors to fit your trading style.
🎨 Visual Customization: Adjust uptrend and downtrend colors for clear trend visualization.
📊 Market Analysis: Watch for the Supertrend color change for trend reversals. Use the 70 and 30 lines to spot overbought/oversold conditions.
🔔 Alerts: Enable notifications for reversal conditions to capture trading opportunities without constant chart monitoring.
How It Works:
At the core of this indicator is the combination of the Relative Strength Index (RSI) and the Supertrend framework, it does so by applying the SuperTrend on the RSI. The RSI settings can be adjusted for length and smoothing, with the option to select the data source. The Supertrend calculation takes into account a specified trend factor and the Average True Range (ATR) over a given period to determine trend direction.
Visual elements include plotting the RSI, its moving average, and the Supertrend line, with customizable colors for clarity. Overbought and oversold conditions are highlighted, and trend changes are filled with distinct colors.
🔔 Alerts: Enable alerts for crossover and crossunder events to catch every trading opportunity.
🌈 Whether you're a seasoned trader or just starting, the Supertrended RSI offers a fresh perspective on market trends. 📈
💡 Tip: Experiment with different settings to find the perfect balance for your trading style!
🔗 Explore, customize, and enhance your trading experience with the Supertrended RSI Indicator! Happy trading! 🎉

Relative Strength Scatter Plot [LuxAlgo]The Relative Strength Scatter Plot indicator is a tool that shows the historical performance of various user-selected securities against a selected benchmark.
This tool is inspired by Relative Rotation Graphs®. Relative Rotation Graphs® is a registered trademark of JOOS Holdings B.V. This script is neither endorsed, nor sponsored, nor affiliated with them.
🔶 USAGE
This tool depicts a simple scatter plot using the relative strength ratio as the X-axis and its momentum as the Y-axis of the user-selected symbols against the selected benchmark.
The graph is divided into four quadrants, and the interpretation of the graph is done depending on where a point is situated on the graph:
A point in the green quadrant would indicate that the security is leading the benchmark in strength, with positive strength momentum.
A point in the yellow quadrant would indicate that the security is leading the benchmark in strength, with negative strength momentum.
A point in the blue quadrant would indicate that the security is lagging behind the benchmark in strength, with positive strength momentum.
A point in the red quadrant would indicate that the security is lagging behind the benchmark in strength, with negative strength momentum.
The trail of each symbol allows the user to see the evolution of the relative strength momentum relative to the relative strength ratio. The length of the trail can be controlled by the "Trail Length" setting.
🔶 DETAILS
Our relative strength ratio estimate is first obtained from the relative strength between the symbol of interest and the benchmark, the result is then smoothed using a linearly weighted moving average (wma). This result is then normalized with a wma of the smoothed relative strength, this ratio is again smoothed with the wma and multiplied by 100.
The relative strength momentum estimate is obtained from the ratio between the previously estimated RS-Ratio and its wma, this ratio is then multiplied by 100.
🔶 SETTINGS
Calculation Window: Calculation window of the RS-Ratio and RS-Momentum metrics.
Symbols: Symbols used for the computation of the graph, each settings line allows us to determine whether the symbol is to be displayed on the graph as well as its color.
Benchmark: Benchmark symbol used for the computation of the graph. Indices are commonly used as a benchmark.
🔹 Graph Settings
Trail Length: Number of past data points to display on the graph for each symbol.
Resolution: Controls the horizontal length of the graph.

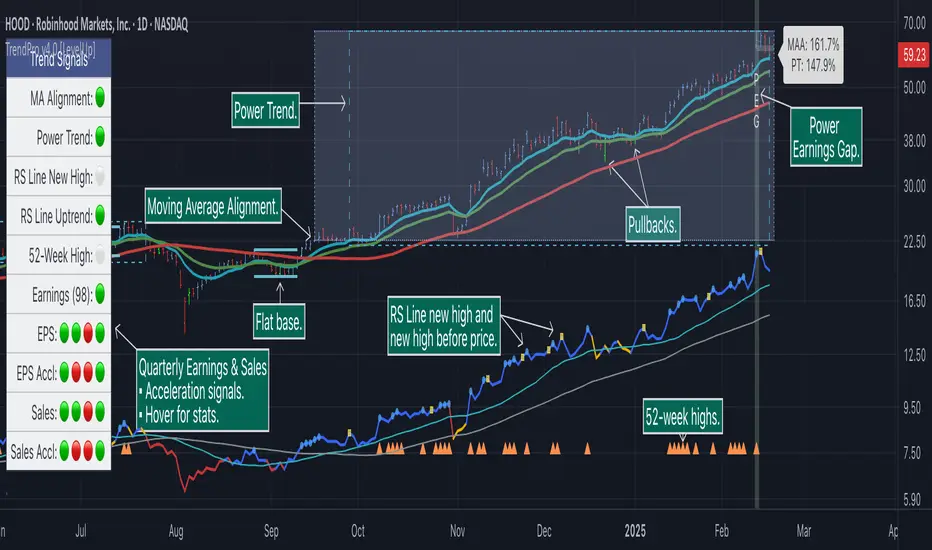
Trend Alignment Pro [LevelUp]Trend Alignment Pro™ is designed for traders who focus on trading with the trend. This indicator automates key aspects of fundamental and technical analysis to identify and highlight chart patterns and signals, drawing on the proven techniques of legendary trend-following traders such as William O'Neil, Jesse Livermore, and Stan Weinstein.
The indicator name, Trend Alignment , emphasizes the importance of confirming price action, patterns, and signals across multiple timeframes. It provides both daily and weekly analysis to enable accurate and timely trend identification.
🔹—— Key Features ——🔹
Daily Timeframe
Moving Average Alignment™
▪ Highlight trends based on moving averages and price action.
▪ Specify price in relation to moving averages (e.g. close above).
▪ Specify which moving averages are required to be in an uptrend.
▪ Specify moving average stacking requirements (e.g. fast above slow).
▪ Require active Power Trend (optional).
▪ Set stop-loss and requirements to end Moving Average Alignment.
Power Trend Tools and Analysis
▪ Highlight Power Trends with box or symbols at start/end points.
▪ Auto-tracking of key metrics towards a new Power Trend.
Custom Moving Averages
▪ Specify type (EMA/SMA), length and color.
▪ View 10-week SMA on daily chart.
Stats Table
▪ Comprehensive daily price and percent change stats.
Signals Table
▪ Track important trend signals with clear visuals.
Power Earnings Gap (PEG) Detection
▪ Auto-detect and highlight Power Earnings Gaps.
▪ Customize requirements, such as gap-up percent and earnings surprise.
Weekly Timeframe
Custom Moving Averages
▪ Specify type (EMA/SMA), length and color.
Tight Weeks and Up Weeks
▪ Specify weekly and percent change requirements.
Stats Table
▪ Comprehensive weekly price and percent change stats.
Daily & Weekly Timeframes
Flat Base & Consolidation
▪ Automated detection with defaults based on the active timeframe.
Custom Relative Strength Line
▪ Specify index and lookback range.
▪ Symbols plotted on RS Line indicating new high and new high before price.
▪ Two custom moving averages for daily & weekly timeframes.
Anchored VWAP (AVWAP)
▪ Multiple anchor options: year-to-date, year-to-date low/high.
Pullbacks
▪ Set key requirements and minimum number of bars.
52-Week and All-Time Highs
▪ Bullish indicators indicating outperformance.
Marked Highs & Lows
▪ Identify potential areas of support/resistance.
🔹—— Daily Chart Examples ——🔹
Daily charts are ideal for analyzing short to intermediate term trends and spotting actionable setups as they develop.
🔹—— Weekly Chart Example ——🔹
Weekly charts are helpful for identifying longer-term trends and patterns.
🔹—— Moving Average Alignment (Daily) ——🔹
Moving Average Alignment™ (MAA) is a trend-identification tool that uses moving averages, price action and their relationships to one another to detect momentum and upward trends. MAA offers extensive customization, including the following:
▪ Moving average types (EMA/SMA) and length.
▪ Which moving averages are required to be in an uptrend.
▪ Requirements on the order of moving averages (e.g. fast above slow).
▪ Optional requirement that the stock be in a Power Trend.
▪ Set stop-loss and requirements to signal the end of the MAA.
MAA delivers clear visual confirmation of trend strength and helps identify both the start and potential end of an uptrend.
🔹—— Power Trend (Daily) ——🔹
The concept of a Power Trend was created by Mike Webster, Justin Nielsen and Charles Harris while working with William O’Neil, founder of Investor's Business Daily and creator of the CANSLIM methodology. When a Power Trend is active, there is a stronger than usual uptrend underway.
A Power Trend by definition uses a major index, such as the Nasdaq Composite (IXIC), as the data source for determining a Power Trend's state. The Trend Alignment indicator builds upon this concept by enabling the current chart symbol to be the data source for the Power Trend, thus offering traders a unique and quantifiable signal when a stock is in a strong uptrend.
What Starts A Power Trend
▪ Low is above the 21-EMA for at least 10 days.
▪ 21-EMA is above the 50-SMA for at least five days.
▪ 50-SMA is in an uptrend.
▪ Close up for the day.
What Ends A Power Trend
▪ 21-EMA crosses under 50-SMA and the close is below prior day close.
▪ Close below the 50-SMA and low is 10% below recent high.
One unique feature of the Trend Alignment indicator is that you can track the progress towards a new Power Trend beginning. See the chart below for more details.
🔹—— Power Earnings Gap (Daily) ——🔹
A Power Earnings Gap refers to a stock experiencing a significant price gap-up, on high volume, following an earnings report. This typically occurs when the stock opens at least 5-10% (or more) above the prior day's close, forming a gap-up bar on the chart that signals strong retail and/or institutional buying and the start or continuation of a major uptrend. It's a bullish pattern seen in leading growth stocks that often continue to outperform.
There are extensive customization options including required gap-up percent, minimum volume change over the average volume and preferred earnings surprise requirements.
🔹—— Relative Strength Line ▪ RS Line (Daily & Weekly) ——🔹
The Relative Strength Line (RS Line), another concept popularized by William O’Neil, is a technical indicator used in stock analysis to measure a stock's performance relative to a benchmark index, such as the S&P 500. An upward-trending RS Line indicates the stock is outperforming the market, while a downward trend shows underperformance. This helps identify potential leaders or laggards regardless of market conditions.
RS Line New High
When the RS Line reaches a new high, this signals that the stock's relative strength against the benchmark is at its highest point over the current lookback range — clear evidence of market leadership.
RS Line New High Before Price
When the RS Line hits a new high ahead of the stock's price reaching a new high, this can be a leading indicator of impending price strength, as it shows the stock gaining momentum relative to the market before that strength is reflected in its price. This signal shows early outperformance and potential market leadership, often preceding a breakout or trend continuation.
New High and New High Before Price Symbols
Easily spot RS Line new highs and new highs before price; a small circle on the RS Line indicates new highs and a small square highlights new high before price.
Highlight Breaks of Moving Averages
There are two custom moving averages of the RS Line that can be configured. Looking for breaks above or below these moving averages can be helpful to effectively manage positions, such as scaling out of a trade systematically.
🔹—— Tight Weeks and Up Weeks (Weekly) ——🔹
In William O'Neil's CANSLIM methodology, tight weekly closes and up weeks are key technical indicators used to evaluate stock chart patterns and identify potential buying opportunities. Tight and up weeks may indicate institutional accumulation and price strength.
Tight closes on a weekly timeframe refer to consecutive weeks where closing prices stay within a narrow 1-1.5% range of the prior week's close, often with declining volume. This signals buyer control and accumulation, making it a bullish indicator, particularly in patterns like three-weeks-tight after an initial breakout.
When a stock closes higher than the prior week, this signals positive momentum. Multiple up weeks often indicate sustained buying and may help to spotlight emerging leaders. Increased volume on up weeks show institutional support and increase the potential for a breakout.
🔹—— Automated Anchored VWAP ▪ AVWAP (Daily & Weekly) ——🔹
Based on the work of Brian Shannon, CMT, the anchored VWAP (AVWAP) shows the average price a stock has traded at, weighted by volume, starting from a specific point in time, the anchor. AVWAP can be helpful for trend confirmation and reversals, breakout and breakdown signals as well as risk management for placing stops.
The AVWAP works with any exchange around the globe, respecting trading days, hours and holidays. Use the AVWAP with the TradingView Replay feature for historical and post-mortem analysis.
🔹—— Marked Highs and Lows (Daily & Weekly) ——🔹
Pivot highs and pivot lows are core principles in technical analysis for identifying potential turning points, support/resistance, and trends. Shown on the chart as either price or a triangle symbol, these visual cues help to quickly spot significant price levels.
Pivots highlight historical turning points in price, serving as reliable zones for potential bounces or breakouts. They can also help determine overall market direction, for example, higher highs and higher lows in uptrends. Pivots also represent where demand overwhelms supply or vice versa.
🔹—— Price Stats and Signals Tables (Daily & Weekly) ——🔹
Comprehensive daily and weekly price stats. Daily charts also includes real-time signals to monitor the trend as well as quarterly earnings and sales data.
🔹—— Custom Alerts ——🔹
The Trend Alignment indicator supports custom alerts:
▪ Moving Average Alignment started.
▪ Moving Average Alignment ended.
▪ Power Trend started.
▪ Power Trend ended.
▪ Power Earnings Gap started.
🔹—— Best Practices ——🔹
▪ Look for confirmation of an uptrend on multiple timeframes.
▪ Use multiple signals and/or patterns for confirmation of the trend.
▪ Relative strength is key to find stocks outperforming the market.
▪ Focus on companies with earnings and sales acceleration.
▪ Avoid chasing extended stocks.
▪ Always define risk before entering a trade — know where you’ll exit.
▪ Size positions based on volatility and conviction, not emotion.
▪ Be patient — trends take time to develop.
付费脚本
Saay RS NavigatorDescription:
The Saay RS Navigator is a comprehensive indicator designed to measure and visualize the Relative Strength (RS) of a stock or security against a benchmark across multiple time frames. This tool plots three distinct RS lines representing Short Term, Medium Term, and Long Term perspectives, each customizable in length and color to suit various trading strategies and preferences.
Functionality:
1. Short Term RS (Green Line): Offers a rapid view of the stock's strength, ideal for identifying short-term trends or quick market reactions. The default period is set to 10 days.
2. Medium Term RS (Blue Line): Balances between short-sighted and long-term views, reflecting medium-term market momentum and trends. The default period is set to 55 days.
3. Long Term RS (Yellow Line): Provides insights into the overarching market trend, helping users understand long-term strength and directional bias. The default reference time is set to 16 June 2023.
4. Zero Line (Red Line): Acts as a baseline for comparison, aiding in the visual distinction of strength or weakness relative to the benchmark.
Each line's color and period can be tailored to individual trading needs, allowing for a personalized analysis experience. By understanding a stock's strength against a benchmark across different periods, traders can make more informed decisions about entry and exit points, trend following, or potential reversals. The Saay RS Navigator is a versatile tool for traders who want to enhance their market analysis with multi-timeframe insights, providing a clearer picture of relative performance and helping to identify key trends and reversals. Whether you're a short-term trader or a long-term investor, this indicator can add depth to your technical analysis arsenal.

Trend-based Price Action StrategyThis is a strategy script that combines trend-based price action analysis with the Relative Strength Index (RSI) and Exponential Moving Averages (EMA) as trend filters. Here's a summary of the key components and logic:
Price Action Candlestick Patterns:
Bullish patterns: Engulfing candle and Morning Star.
Bearish patterns: Engulfing candle and Evening Star.
RSI Integration:
RSI is used to identify overbought and oversold conditions.
EMA Trend Filter:
Three EMAs with different periods: Fast , Medium and Slow.
Long trend condition occur when the fast EMA is above the medium and the medium is above the slow EMA.
Short trend condition occur when the slow EMA is above the medium and the medium is above the fast EMA.
Long entry conditions: RSI is oversold, RSI is decreasing, bullish candlestick pattern, and EMA trend filter conditions are met.
Short entry conditions: RSI is overbought, RSI is decreasing, bearish candlestick pattern, and EMA trend filter conditions are met.
Exit conditions:
Take profit or stop loss is reached.
Plotting:
Signals are plotted on the chart when entry conditions are met.
EMAs are plotted when the EMA trend filter is enabled.
This script aims to capture potential trend reversal points based on a combination of candlestick patterns, RSI, and EMA trend analysis.
Traders can use this script as a starting point for further customization or as a reference for developing their own trading strategies. It's important to note that past performance is not indicative of future results, and thorough testing and validation are recommended before deploying any trading strategy.

RS for VPAThis is a supporting Indicator for the Volume Price Analysis Script VPA 5.0.
Purpose
To indicate the performance of the stock compared to an Index or any other selected stock. It also provides an idea about the strength of the Reference Index as well.
Description
The indicator is an unbound oscillator moving around a zero line. If the stock is strong then the values are positive and if it is weak the values are negative. If the stock is performing better (Stronger) than the Index the indicator is positive and colored green. If the stock is weaker than the Index it is negative and is colored Red.
The background indicates the strength of the Reference Index/Stock. Bullishness/up trend of the Index/Stock is indicated by yellow colour. Short term uptrend, Mid term uptrend and Long term trends are indicated by different shades of yellow varying from light to Dark. The bearishness / down trend is indicated by blue back ground.
How it Works
The relative strength is calculated by using the formula
RS = Gain of the stock / (Gain of the Ref. Index -1)
= (Stock Price today / Stock Price (N period ago)) /
(Index Price today / Index price (N period ago)) – 1
The Index strength is calculated as below
Short term trend up = 5 ema > 22 ema
Mid Term trend up = 22 ema > 60 ema
Long term trend up = 60 ema > 130 ema
Trend down = 5 ema < 22 ema
How to use
Use this indicator to assist your Price Action Analysis using VPA 5.0. When the Price action and volume indicates Bullishness, you can check if the relative strength is also supporting (Positive and in green Territory). This adds credibility to the Price action. Also check if the index is also positive (the Back ground is yellow). This makes the Price action even stronger. Ideally both the stock and index should be strong. Many time you would find the that the stock is in green territory but the index is in blue territory. This calls for some caution in evaluating the Price Action.
When the price action is positive but the relative strength is negative then one should be cautious and wait for the relative strength to turn positive before any entry decision.
Option for the Indicator
One can select the following from the setting for the indicator
1. Index or reference stock – Default is CNX 500
2. Relative Strength Calculation period – Default is 22
3. The EMA periods for the Index/Reference stock strength calculation

Anchored Relative StrengthThe Anchored Relative Strength (RS) Indicator is a tool designed for traders to compare the performance of a selected stock or security against a benchmark index or another security starting from a specific point in time.
Traditional Relative Strength
The traditional RS line is a popular tool used to compare the performance of a stock, typically calculated as the ratio of the stock's price to a benchmark index's price. It helps identify outperformers and underperformers relative to the market or a specific sector.
The Anchored Approach
The Anchored RS line enhances the traditional concept of the RS line by introducing an anchored approach, where calculations begin from a user-defined date. This feature provides the flexibility to start the comparison from a specific historical event, earnings, market peak, trough, or any date significant to the trader's analysis.
Calculating Relative Strength
The RS value is calculated by dividing the close price of the chosen stock by the close price of the comparative symbol (SPX by default). This calculation is performed for each bar since the Anchor Date.
Indicator Features
🔶Custom Start Date
🔶Custom Comparison Symbol
🔶RS Line Moving Average
🔶Comparison Symbol Line
🔶Customize Colors & Appearance
Users can change the anchor date simply by clicking on the indicator and dragging the anchor point.

Webby's Quick & Grateful Dead RSWebby's Quick & Grateful Dead RS combines a Relative Strength Line and Moving Averages to help traders hold a core position in a winning stock by identifying moments of strength and weakness in a stocks advance.
The Relative Strength (RS) line is something many investors are familiar with. It is used to measure a stocks performance versus the S&P 500 (default setting) and is typically calculated by dividing the closing price of the stock by the closing price of the S&P. This means if a stock moves up and the S&P moves down or the stock moves up more than the S&P the RS line will increase, if the stock moves down while the S&P moves up the line will decrease.
While the RS Line by itself is a powerful tool, adding moving averages to the RS line can help better understand trends. This work was done by Mike Webster (Webby) as he tried to reverse engineer how William O'Neil was able to hold some of his biggest winning positions.
This indicator plots the RS line along with two moving averages and clearly labels and alerts the 3 signals shared by Webby:
Quick Break - RS line crosses below the fast moving average
Quicksand - RS line moves lower than it was at the time of the Quick Break
Grateful Dead Break - RS line crosses below the slow moving average
To ensure your chart doesn't get skewed, please use the multiplier in the setting to adjust the vertical offset of the RS line and moving averages.

RSI PRECISION v.3RSI PRECISION v.3 (MACD, StochRSI, SMA Signals)
Developed by Giorgos Protonotarios (2021-2023)
RSI PRECISION is an alternative to the classic Relative Strength Index (RSI). The indicator aims to enhance the classic RSI and make it more accurate on longer timeframes. Additionally, the indicator works as an advanced signaling machine, offering five different categories of leading trading signals. RSI PRECISION is an ideal tool for analyzing highly volatile markets, such as cryptocurrency and small-cap stocks.
In this 3rd version, the core formula remains the same, however, there are new trading signals and a great number of new parameters. Traders have the opportunity to fully customize the indicator according to their needs.
What is new ?
The RSI formula remains the same, however, there are additional features:
• Selected StochRSI signals
• Low-timeframe SMA signal (<60 minutes)
• High-timeframe SMA signal (>60 minutes)
• SMA on the RSI PRECISION readings
• Ability to customize everything in settings (tooltips added)
Note: You can turn off any trading signal by unselecting it in Settings>Style.
□ NEW TRADING SIGNALS (v.3)
■ SELECTED STOCHRSI SIGNALS
The selected StochRSI signals are visualized by a cross (+) on the top and bottom of the indicator. The settings for StochRSI are the classic 8.5.3 (customizable). By default, the crossover is generated when StochRSI crosses above 25, and the crossunder when StochRSI crosses below 75.
(i) Bullish StochRSI cross
• Symbol: Cross (+) on the Top
• Event: StochRSI crosses above level 25
(ii) Bearish StochRSI cross
• Symbol: Cross (+) on the Bottom
• Event: StochRSI crosses below level 75
■ SMA CROSSOVERS (LOW/HIGH TIMEFRAMES)
These trading signals are generated when the price of an asset crosses above or below a preset SMA.
There are two different SMAs, one shown on low timeframes, and one on high timeframes. You can adjust the periods for both, by default 200 periods.
(i) Low-Timeframe SMA Cross (<60 minutes)
• Symbol: Bullish (↥) on the top of the indicator and bearish (↧) on the bottom
• Event: The price crosses above or below the selected SMA on low timeframes
(ii) High-Timeframe SMA Cross (>60 minutes)
• Symbol: Bullish (↥) on the top of the indicator and bearish (↧) on the bottom
• Event: The price crosses above or below the selected SMA on high timeframes
■ SMA LINE ON RSI PRECISION
This is just a simple SMA line on the RSI PRECISION readings. By default, it is set at 50 periods.
• SMA Line (blue-dashed)
You can turn it off by unselecting it in Settings>Style.
□ OLDER TRADING SIGNALS
The 3rd version of RSI PRECISION also includes all previous signals.
■ RSI PRECISION CROSSES
This signal corresponds to a bullish/bearish RSI PRECISION cross. By default, it is 5 for a bullish crossover and 100 for a bearish crossunder. These numbers are indicative and can be customized.
(i) Bullish RSI PRECISION Cross
• Symbol: Green arrow (▲) on the Top
• Event: RSI PRECISION crosses above level 5
(ii) Bearish RSI PRECISION Cross
• Symbol: Red arrow (▼) on the Bottom
• Event: RSI PRECISION crosses below level 100
■ MACD CROSSOVER SIGNALS
The MACD signals are visualized by a green/red dot (•). The default settings are the standard MACD settings (12,6,9).
(i) Bullish MACD cross
• Symbol: Green Dot (•) on the Top
• Event: MACD crosses above its signal line
(ii) Bearish MACD cross
• Symbol: Red Dot (•) on the Bottom
• Event: MACD crosses below its signal line
NOTE: In lower timeframes, MACD generates too many signals. You can switch off “MACD BULLISH & BEARISH CROSSOVERS” by clicking on ‘SETTINGS’, then ‘STYLE’, and then unselecting ‘Bullish MACD Cross’ and ‘Bearish MACD Cross’.
■ GOLDEN/DEATH CROSSES (SMA CROSSOVERS)
The cross of the 50-day moving average above the 200-day moving average is called a golden cross, and it is considered a bullish signal. The cross of the 50-day moving average below the 200-day moving average is called a death cross, and it is considered a bearish signal.
The Golden/Death crosses are visualized by (X). By default, 50 periods for the fast SMA and 200 periods for the slow SMA (both are customizable).
(i) Bullish SMA Cross
• Symbol: (X) on the Top
• Event: The fast SMA crosses above the Slow SMA
(ii) Bearish RSI Cross
• Symbol: (X) on the Bottom
• Event: The fast SMA crosses below the Slow SMA
□ More about the Indicator
■ MISSION
Enhancing the classic Relative Strength Index (RSI) and making it more accurate on longer timeframes, during choppy market conditions, and especially near market tops/bottoms.
■ OBJECTIVES
(1) Creating a better RSI that works as an “All-in-one” indicator
(2) Identifying overbought/oversold market levels in a simple and user-friendly manner
(3) Making precise calculations near market tops and bottoms, where price volatility is always booming
(4) Making precise calculations on longer timeframes (weekly, monthly) where the classic RSI readings are hardly readable
(5) Offering five different categories of trading signals (RSI, StochRSI, MACD, Golden/Death Crosses, SMAs) in a single indicator
■ RSI PRECISION CALCULATIONS
The RSI PRECISION formula consists of three (3) different components:
(a) Relative Strength Index component (the classic RSI)
(b) Periodic Price Volatility component (PPV, essential)
(c) RSI Volatility component (less important)
RSI PRECISION FORMULA ADJUSTMENTS
(i) CLASSIC RSI
This measurement corresponds to the classic RSI. If the other two components of the formula are set to zero (0%), then by entering 100% here, the RSI PRECISION becomes identical to the classic RSI.
-By default, 100%
(ii) PERIODIC PRICE VOLATILITY -PPV
The Periodic Price Volatility (PPV) is an advanced measurement of price volatility and an essential component of the core RSI PRECISION formula. You can easily adjust the weight of PPV in the formula.
-By default, 100%
(iii) RSI VOLATILITY
This is an extra measurement of volatility. This time the focus is exclusively on periodic RSI volatility, not on price volatility.
-By default, 5%
■ FINAL THOUGHTS
RSI PRECISION v.3 is an improved RSI indicator offering five leading trading signals. Everything is combined in one place to create an all-in-one TA tool. I have been using it as my only indicator for quite some time.
As always, happy trading, and remember, if you want to rule the world, create code, not war.
□ Giorgos Protonotarios,
Financial Analyst, Building Web
(October 5th 2023)

K's Reversal Indicator IIIK's Reversal Indicator III is based on the concept of autocorrelation of returns. The main theory is that extreme autocorrelation (trending) that coincide with a technical signals such as one from the RSI, may result in a powerful short-term signal that can be exploited.
The indicator is calculated as follows:
1. Calculate the price differential (returns) as the current price minus the previous price.
2. the correlation between the current return and the return from 14 periods ago using a lookback of 14 periods.
3. Calculate a 14-period RSI on the close prices.
To generate the signals, use the following rules:
* A bullish signal is generated whenever the correlation is above 0.60 while the RSI is below 40.
* A bearish signal is generated whenever the correlation is above 0.60 while the RSI is above 60.

Bollinger RSI BandsIndicator Description:
The "Bollinger RSI Bands" is an advanced technical analysis tool designed to empower traders with comprehensive insights into market trends, reversals, and overbought/oversold conditions. This multifaceted indicator combines the unique features of candle coloration and Bollinger Bands with the Relative Strength Index (RSI), making it an indispensable tool for traders seeking to optimize their trading strategies.
Purpose:
The primary purpose of the "Bollinger RSI Bands" indicator is to provide traders with a holistic view of market dynamics by offering the following key functionalities:
Candle Coloration: The indicator's signature candle colors - green for bullish and red for bearish - serve as a visual representation of the prevailing market trend, enabling traders to quickly identify and confirm market direction.
RSI-Based Moving Average: A smoothed RSI-based moving average is plotted, facilitating the detection of trend changes and potential reversal points with greater clarity.
RSI Bands: Upper and lower RSI bands, set at 70 and 30, respectively, help traders pinpoint overbought and oversold conditions, aiding in timely entry and exit decisions.
Bollinger Bands: In addition to RSI bands, Bollinger Bands are overlaid on the RSI-based moving average, offering insights into price volatility and highlighting potential breakout opportunities.
How to Use:
To maximize the utility of the "Bollinger RSI Bands" indicator, traders can follow these essential steps:
Candle Color Confirmation: Assess the color of the candles. Green candles signify a bullish trend, while red candles indicate a bearish trend, providing a clear and intuitive visual confirmation of market direction.
Overbought and Oversold Identification: Monitor price levels relative to the upper RSI band (70) for potential overbought signals and below the lower RSI band (30) for potential oversold signals, allowing for timely adjustments to trading positions.
Trend Reversal Recognition: Observe changes in the direction of the RSI-based moving average. A transition from bearish to bullish, or vice versa, can serve as a valuable signal for potential trend reversals.
Volatility and Breakout Opportunities: Keep a watchful eye on the Bollinger Bands. Expanding bands signify increased price volatility, often signaling forthcoming breakout opportunities.
Why Use It:
The "Bollinger RSI Bands" indicator offers traders several compelling reasons to incorporate it into their trading strategies:
Clear Trend Confirmation: The indicator's distinct candle colors provide traders with immediate confirmation of the current trend direction, simplifying trend-following strategies.
Precise Entry and Exit Points: By identifying overbought and oversold conditions, traders can make more precise entries and exits, optimizing their risk-reward ratios.
Timely Trend Reversal Signals: Recognizing shifts in the RSI-based moving average direction allows traders to anticipate potential trend reversals and adapt their strategies accordingly.
Volatility Insights: Bollinger Bands offer valuable insights into price volatility, aiding in the identification of potential breakout opportunities.
User-Friendly and Versatile: Despite its advanced features, the indicator remains user-friendly and versatile, catering to traders of all experience levels.
In summary, the "Bollinger RSI Bands" indicator is an indispensable tool for traders seeking a comprehensive view of market dynamics. With its unique combination of candle coloration and Bollinger Bands, it empowers traders to make more informed and strategic trading decisions, ultimately enhancing their trading outcomes.
Note: Always utilize this indicator in conjunction with other technical and fundamental analysis tools and exercise prudence in your trading decisions. Past performance is not indicative of future results.

Ultimate RSI [LuxAlgo]The Ultimate RSI indicator is a new oscillator based on the calculation of the Relative Strength Index that aims to put more emphasis on the trend, thus having a less noisy output. Opposite to the regular RSI, this oscillator is designed for a trend trading approach instead of a contrarian one.
🔶 USAGE
While returning the same information as a regular RSI, the Ultimate RSI puts more emphasis on trends, and as such can reach overbought/oversold levels faster as well as staying longer within these areas. This can avoid the common issue of an RSI regularly crossing an overbought or oversold level while the trend makes new higher highs/lower lows.
The Ultimate RSI crossing above the overbought level can be indicative of a strong uptrend (highlighted as a green area), while an Ultimate RSI crossing under the oversold level can be indicative of a strong downtrend (highlighted as a red area).
The Ultimate RSI crossing the 50 midline can also indicate trends, with the oscillator being above indicating an uptrend, else a downtrend. Unlike a regular RSI, the Ultimate RSI will cross the midline level less often, thus generating fewer whipsaw signals.
For even more timely indications users can observe the Ultimate RSI relative to its signal line. An Ultimate RSI above its signal line can indicate it is increasing, while the opposite would indicate it is decreasing.
🔹 Smoothing Methods
Users can return more reactive or smoother results depending on the selected smoothing method used for the calculation of the Ultimate RSI. Options include:
Exponential Moving Average (EMA)
Simple Moving Average (SMA)
Wilder's Moving Average (RMA)
Triangular Moving Average (TMA)
These are ranked by the degree of reactivity of each method, with higher ones being more reactive (but less smooth).
Users can also select the smoothing method used by the signal line.
🔶 DETAILS
The RSI returns a normalized exponential average of price changes in the range (0, 100), which can be simply calculated as follows:
ema(d) / ema(|d|) × 50 + 50
where d represent the price changes. In order to put more emphasis on trends we can put higher weight on d . We can perform this on the occurrence of new higher highs/lower lows, and by replacing d with the rolling range instead (the rolling period used to detect the higher highs/lower lows is equal to the length setting).
🔶 SETTINGS
Length: Calculation period of the indicator
Method: Smoothing method used for the calculation of the indicator.
Source: Input source of the indicator
🔹 Signal Line
Smooth: Degree of smoothness of the signal line
Method: Smoothing method used to calculation the signal line.
